0725
Hyperpolarized 13C Metabolic Imaging of a Renal Cell Carcinoma Patient with Brain Metastasis1Medical Biophysics, University of Toronto, Toronto, ON, Canada, 2Physical Sciences, Sunnybrook Research Institute, Toronto, ON, Canada, 3Radiation Oncology, Sunnybrook Health Sciences Centre, Toronto, ON, Canada, 4GE Healthcare Technologies, Toronto, ON, Canada, 5Pharmacy, Sunnybrook Health Sciences Centre, Toronto, ON, Canada
Synopsis
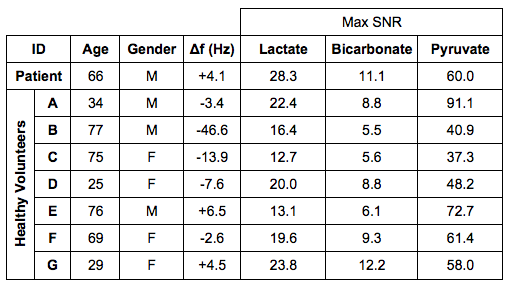
The application of hyperpolarized 13C MRI to non-invasively acquire metabolic images of [1-13C]lactate and 13C-bicarbonate from the injected [1-13C]pyruvate in the brain of metastatic renal cell carcinoma patient, as well as that of 7 healthy volunteers are investigated. Elevated [1-13C]lactate and [1-13C]pyruvate signals were observed from the metastasis, as well as high lactate-to-bicarbonate ratio. The clinical history of the patient suggests that the elevated signals observed in the metastasis may be reflecting the progressive state of the patient’s disease.
Introduction
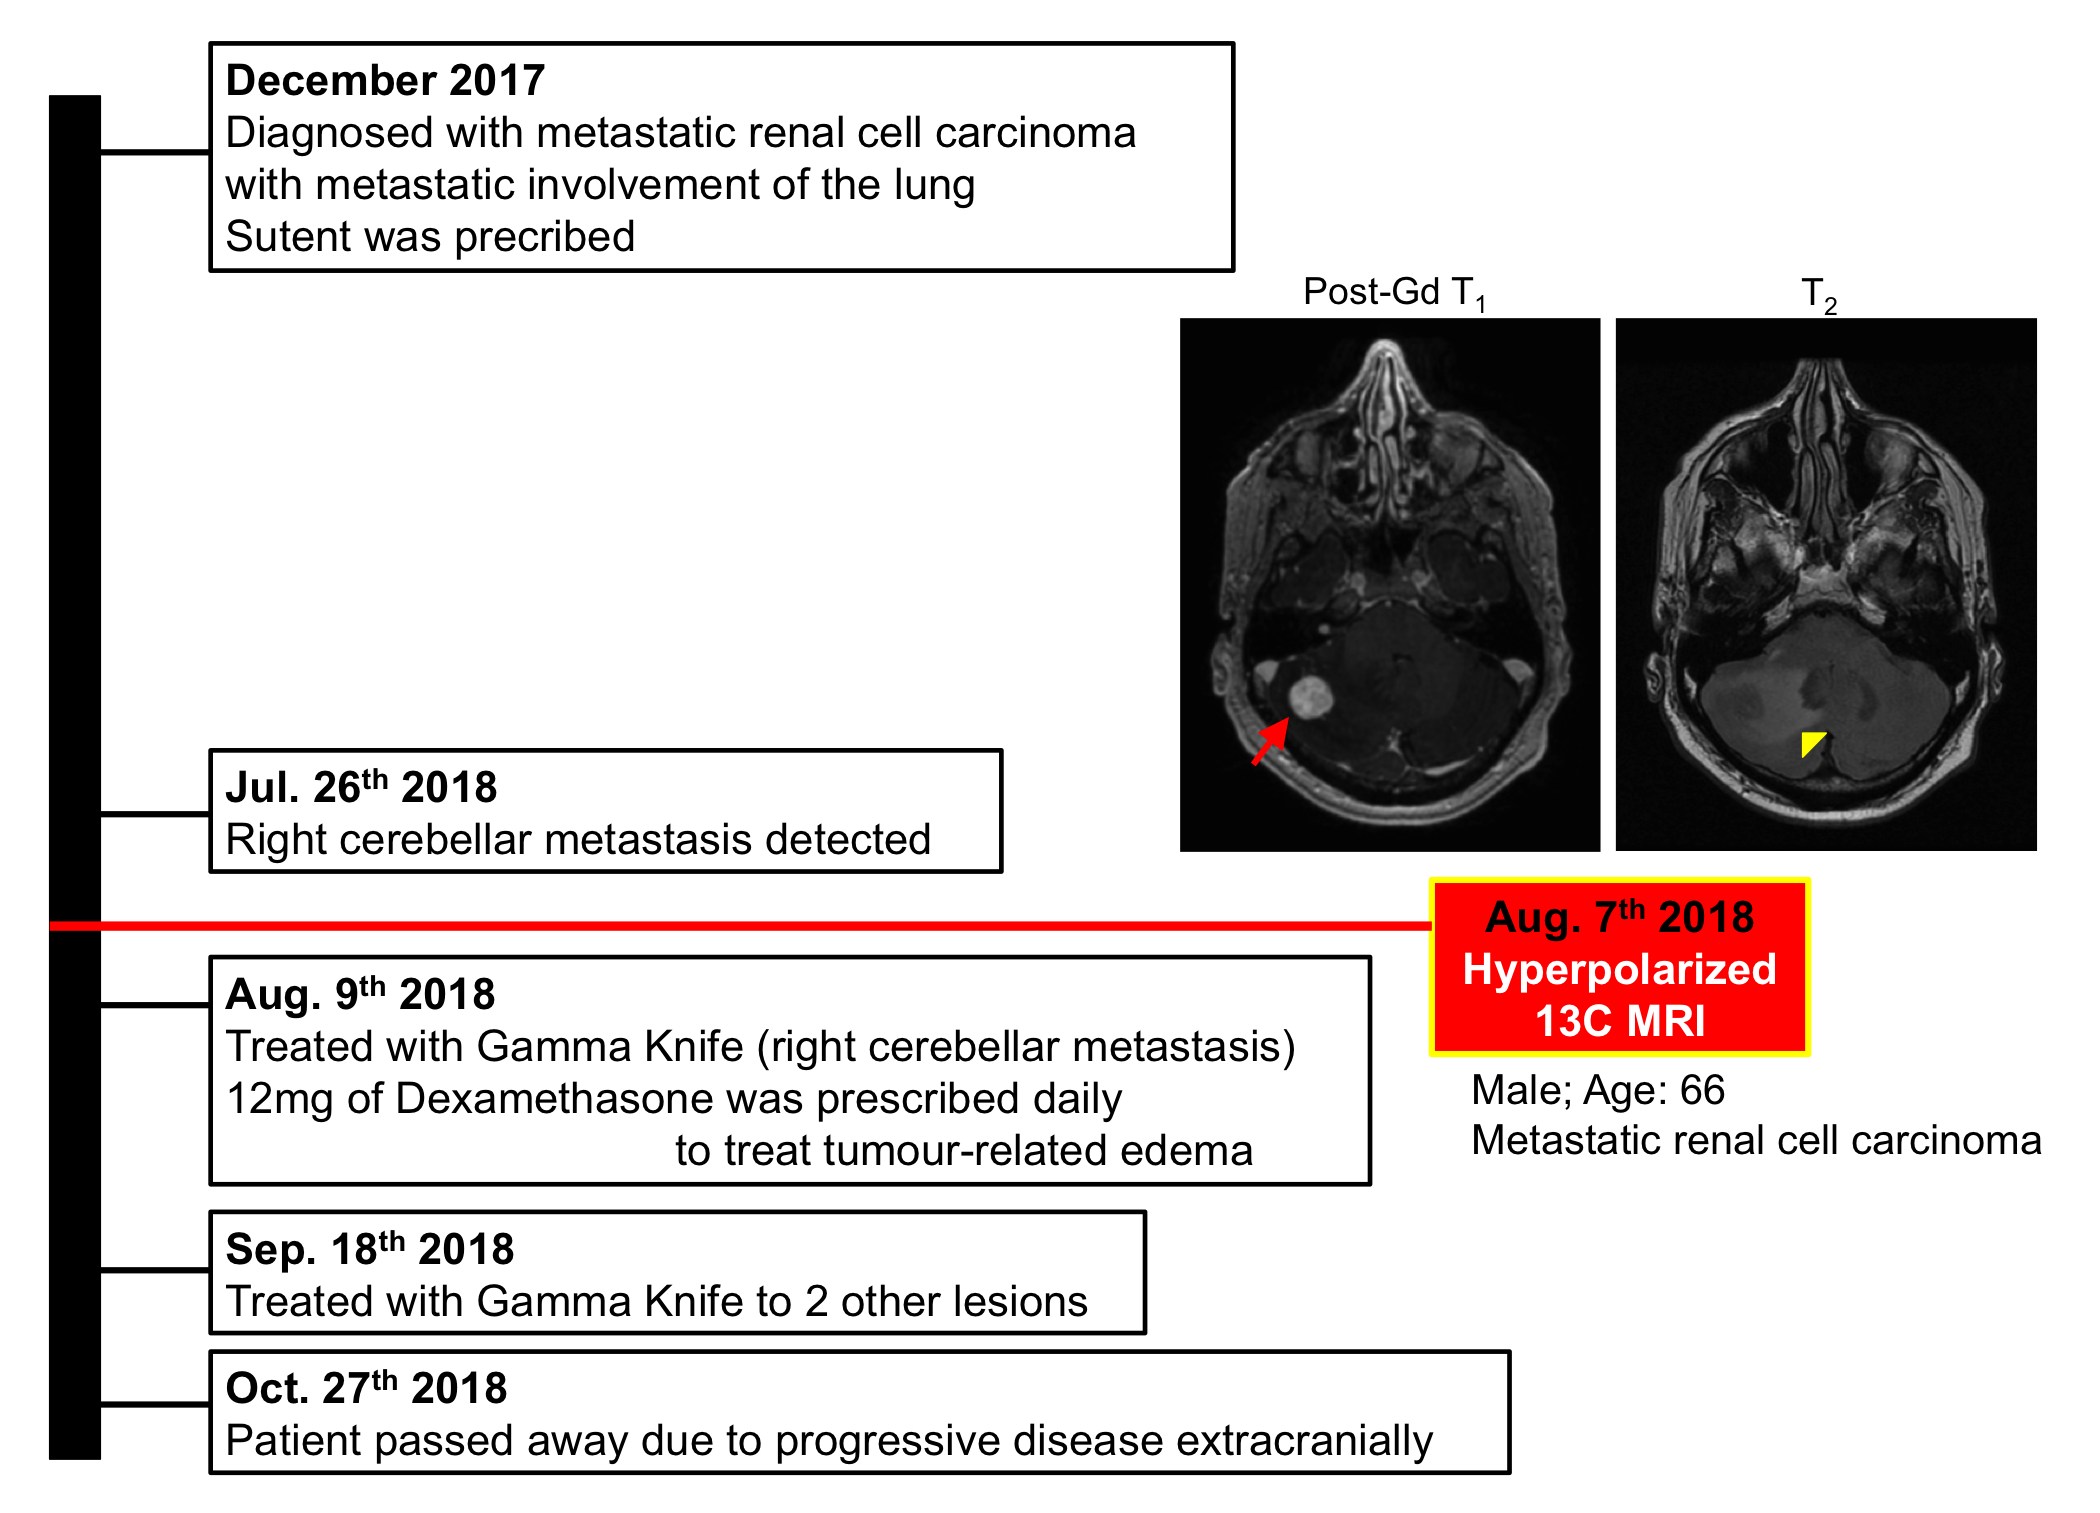
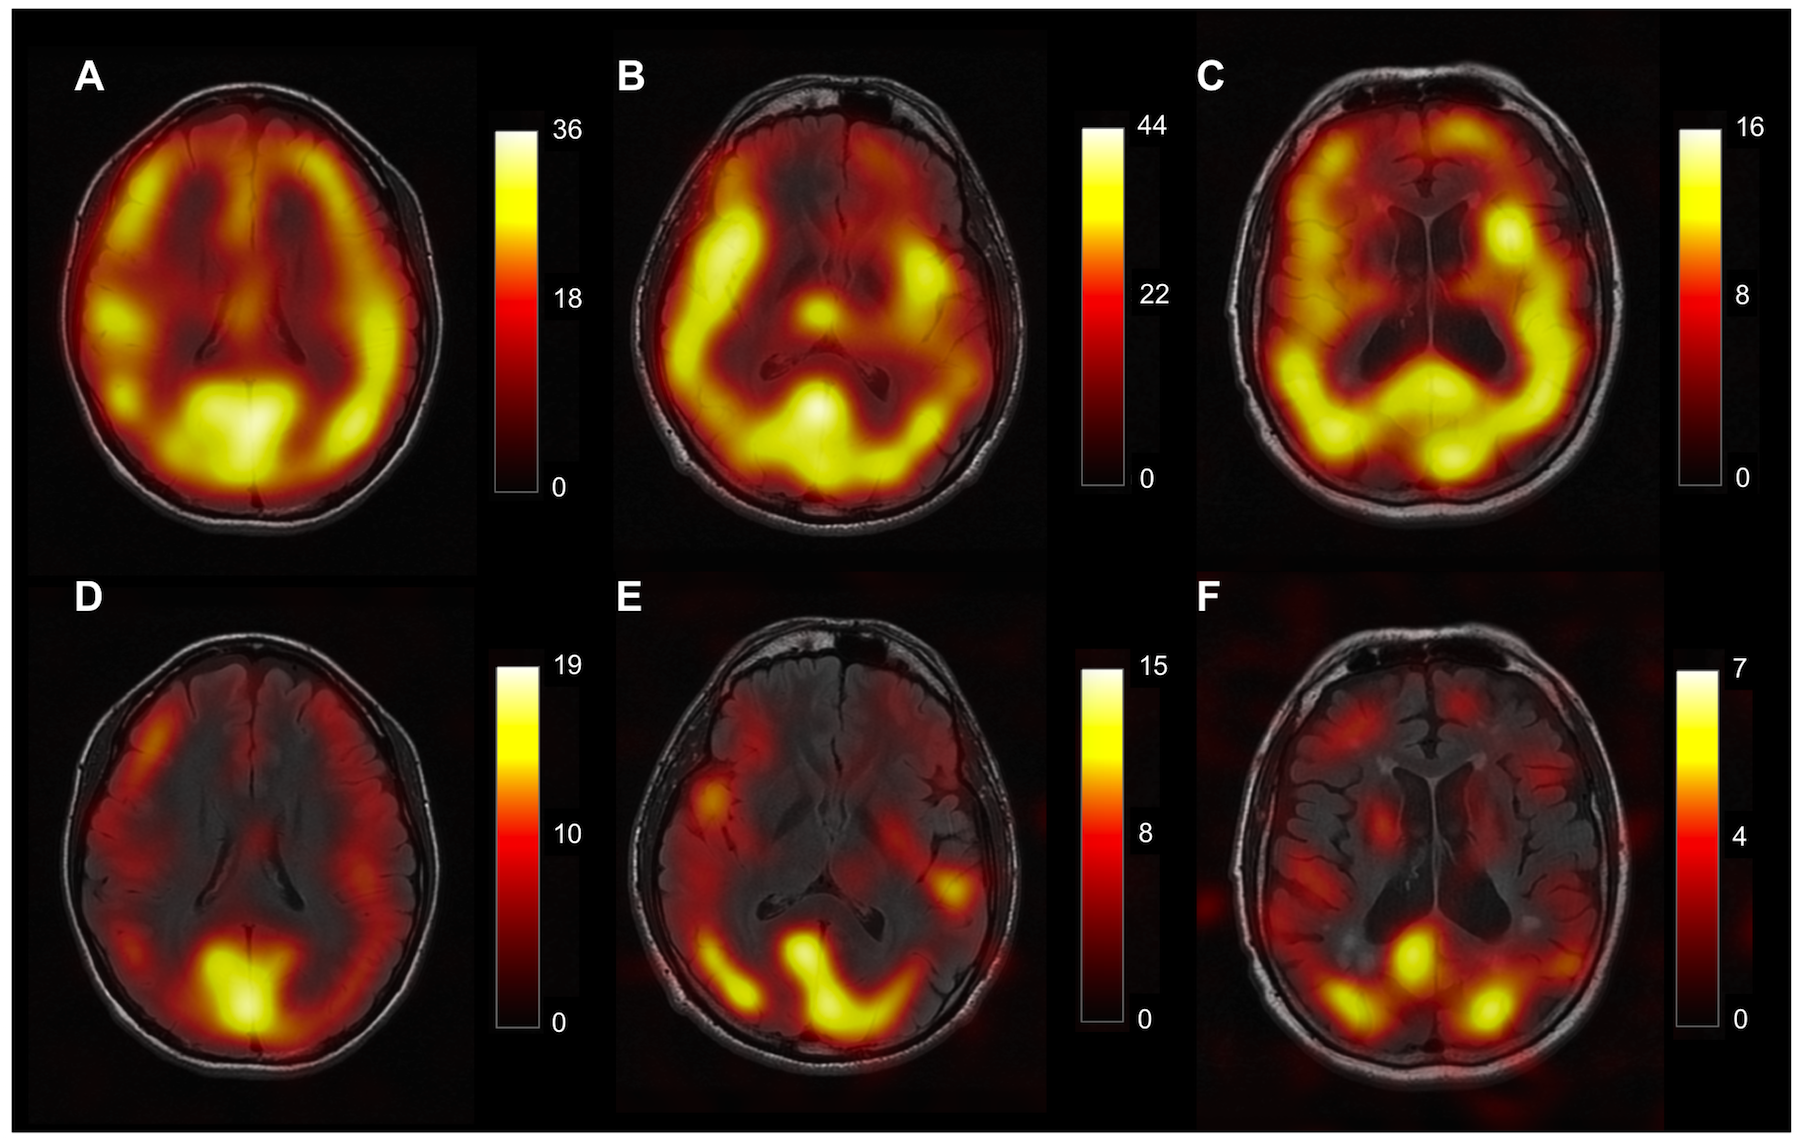
Hyperpolarized (HP) 13C MRI is a non-invasive imaging method that can acquire images of [1-13C]pyruvate, [1-13C]lactate, and 13C-bicarbonate. Recent studies1-6 have demonstrated its potential clinical applicability in the imaging of prostate, heart, and brain. In particular, it has the potential to be a powerful clinical tool in assessing tumour metastasis and to monitor response to radiation treatments, based on the known correlation between tumour lactate concentration, metastasis and radiation resistance7,8. In this study, metabolic images generated from [1-13C]pyruvate, [1-13C]lactate, and 13C-bicarbonate signals were acquired from a pilot study of patient with a brain metastasis, along with the patient’s clinical history (Fig. 1). Metabolic images from 7 healthy volunteers are also acquired to characterize the background metabolic signals from healthy brain tissue (Fig. 2).Methods
Image Acquisition: Written informed consent was obtained from a renal cell carcinoma patient with brain metastasis and 7 healthy volunteers. A 20-gauge intravenous catheter was inserted into the subject’s forearm prior to being positioned supine and head-first in a GE MR750 3.0T MRI scanner (GE Healthcare, Waukesha, WI). The subject’s head was secured upon a fixed head-coil based that could lock into either the 1H receive array or the 13C birdcage to minimize head motion between scans. Using the scanner’s built-in body coil, 1H multi-echo reference data was acquired. A home-made birdcage 13C head coil placed over the subject’s head was used to acquire 13C-signals following the injection of HP [1-13C]pyruvate (0.1 mmol/kg dose at 4 mL/s followed by a 25 mL normal saline flush at 5 mL/s). The 13C signal was acquired with spectral-spatial excitation9 of lactate/bicarbonate/pyruvate resonances (sequentially) followed by a 3D dual-echo EPI (DE-EPI) readout10 (5s TR; axial; 1.5cm isotropic resolution with FOV 24x24x36cm3). The 13C head coil was replaced with a standard 8-channel 1H neurovascular array (Invivo Inc.) and T2-FLAIR (axial, FOV 22×22 cm2, in-plane resolution 0.6875×0.982 mm2, 3 mm slice thickness, TR/TE 8000/120 ms, flip angle 111°) and fast spoiled GRE (axial, FOV 25.6×25.6 cm2, 1 mm-isotropic resolution, TR 7.6 ms, TE 2.9 ms, flip angle 11°) images were acquired for anatomical reference.
Image Analysis: 13C image reconstruction was performed offline using MATLAB R2013a (The MathWorks Inc., MA, Natick, Massachusetts). Data from the 1H multi-echo reference scan was used to correct geometric distortion artefacts from odd/even echo asymmetry, subject-dependent phase errors, and 13C centre frequency calibration error10. The final metabolite images were generated by summing odd/even echoes and summing individual time-resolved images over full 60s acquisition window to improve SNR. Voxel-by-voxel lactate z-scores were computed from the patient’s lactate data, after removing the voxels with the signal below 15% of the maximum lactate signal. The ratio maps of lactate-to-pyruvate and bicarbonate-to-pyruvate were thresholded to remove ratios with unreliable denominators. The resulting 13C metabolic images and ratio maps were overlaid on the corresponding T2-weighted images for anatomical reference in Osirix.
Results and Discussions
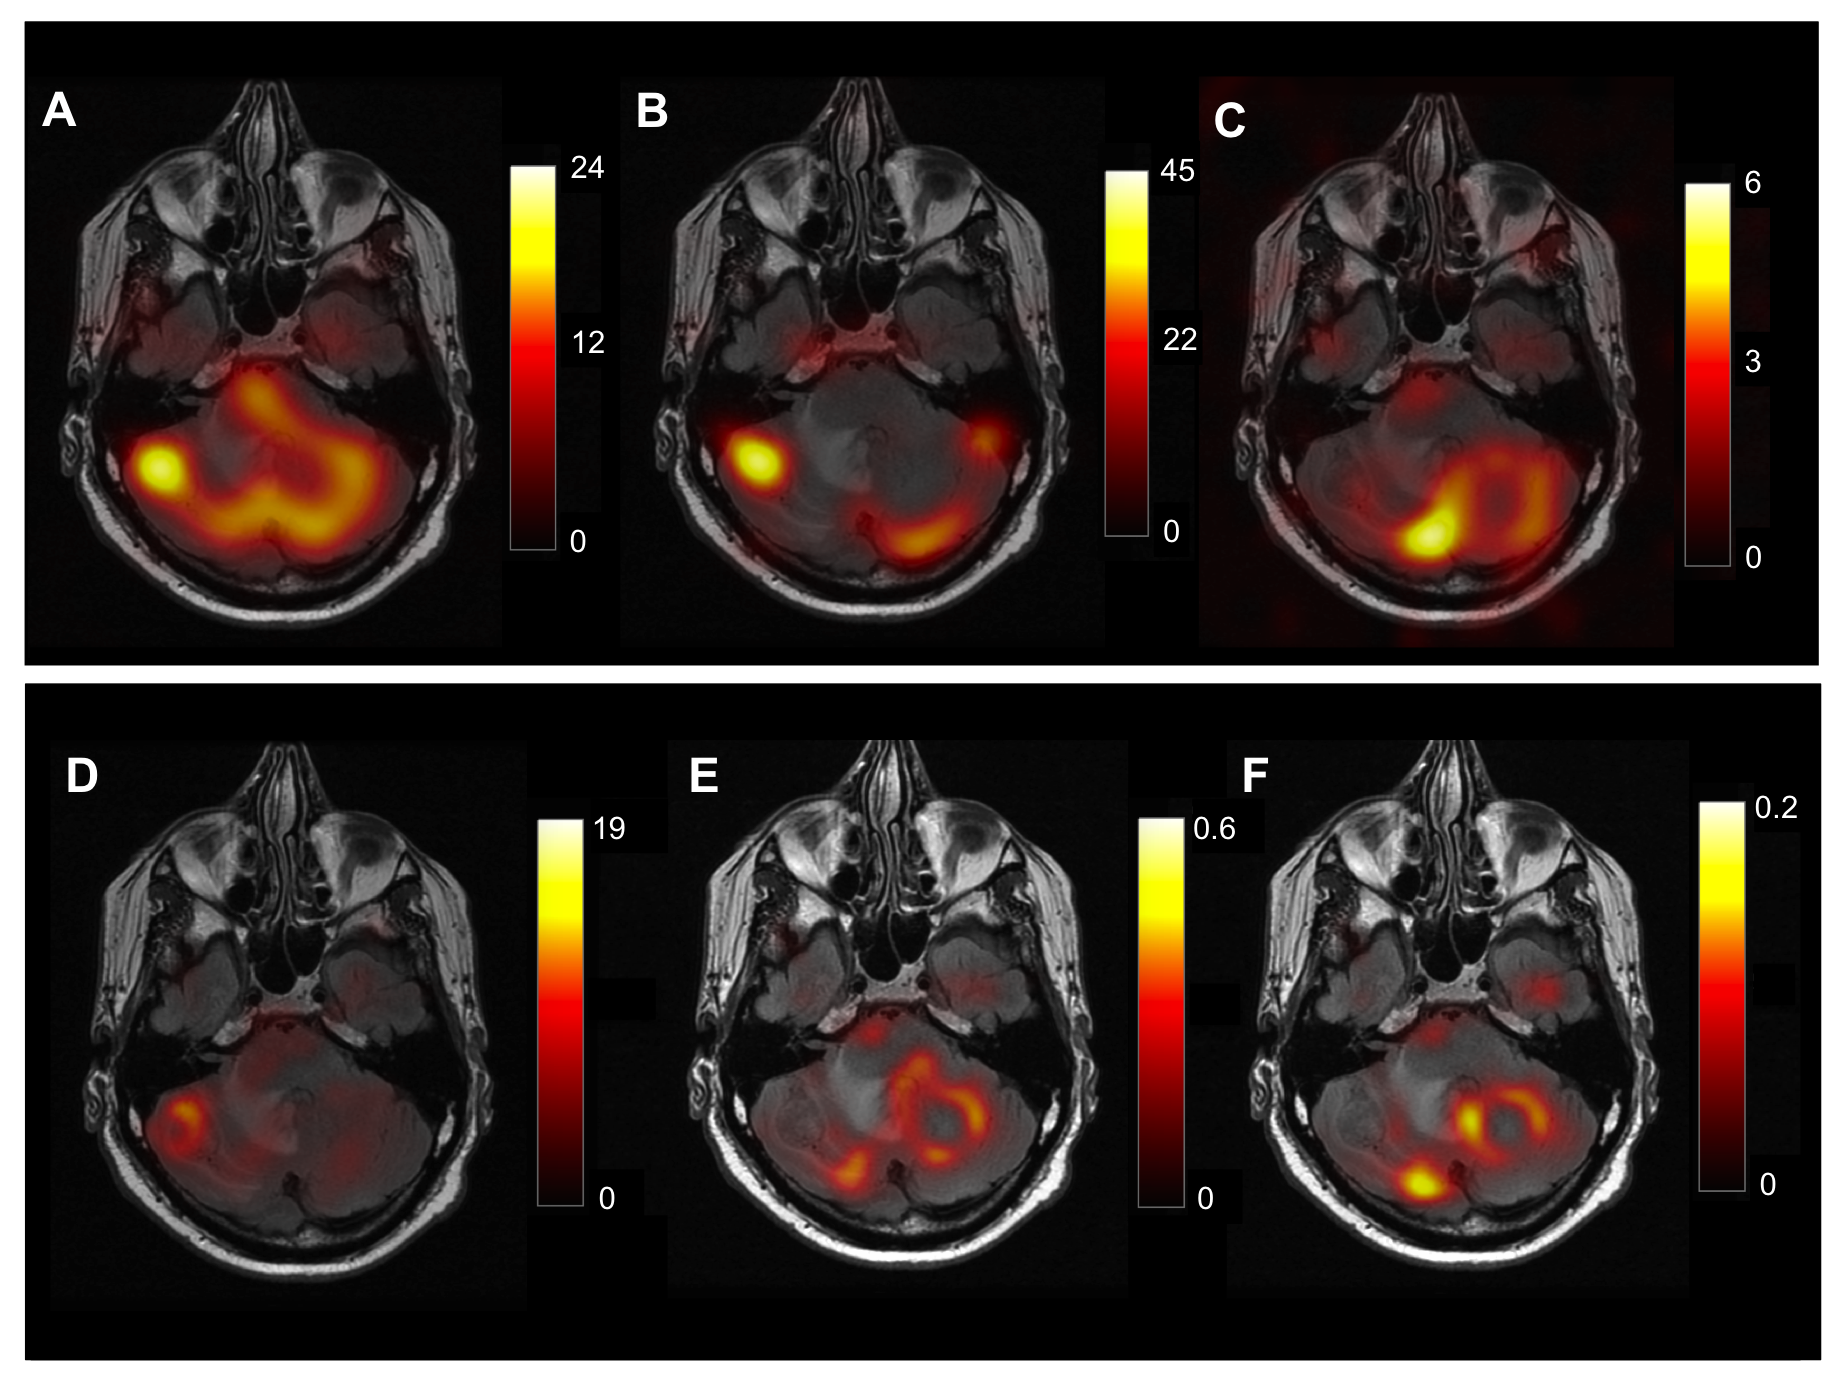
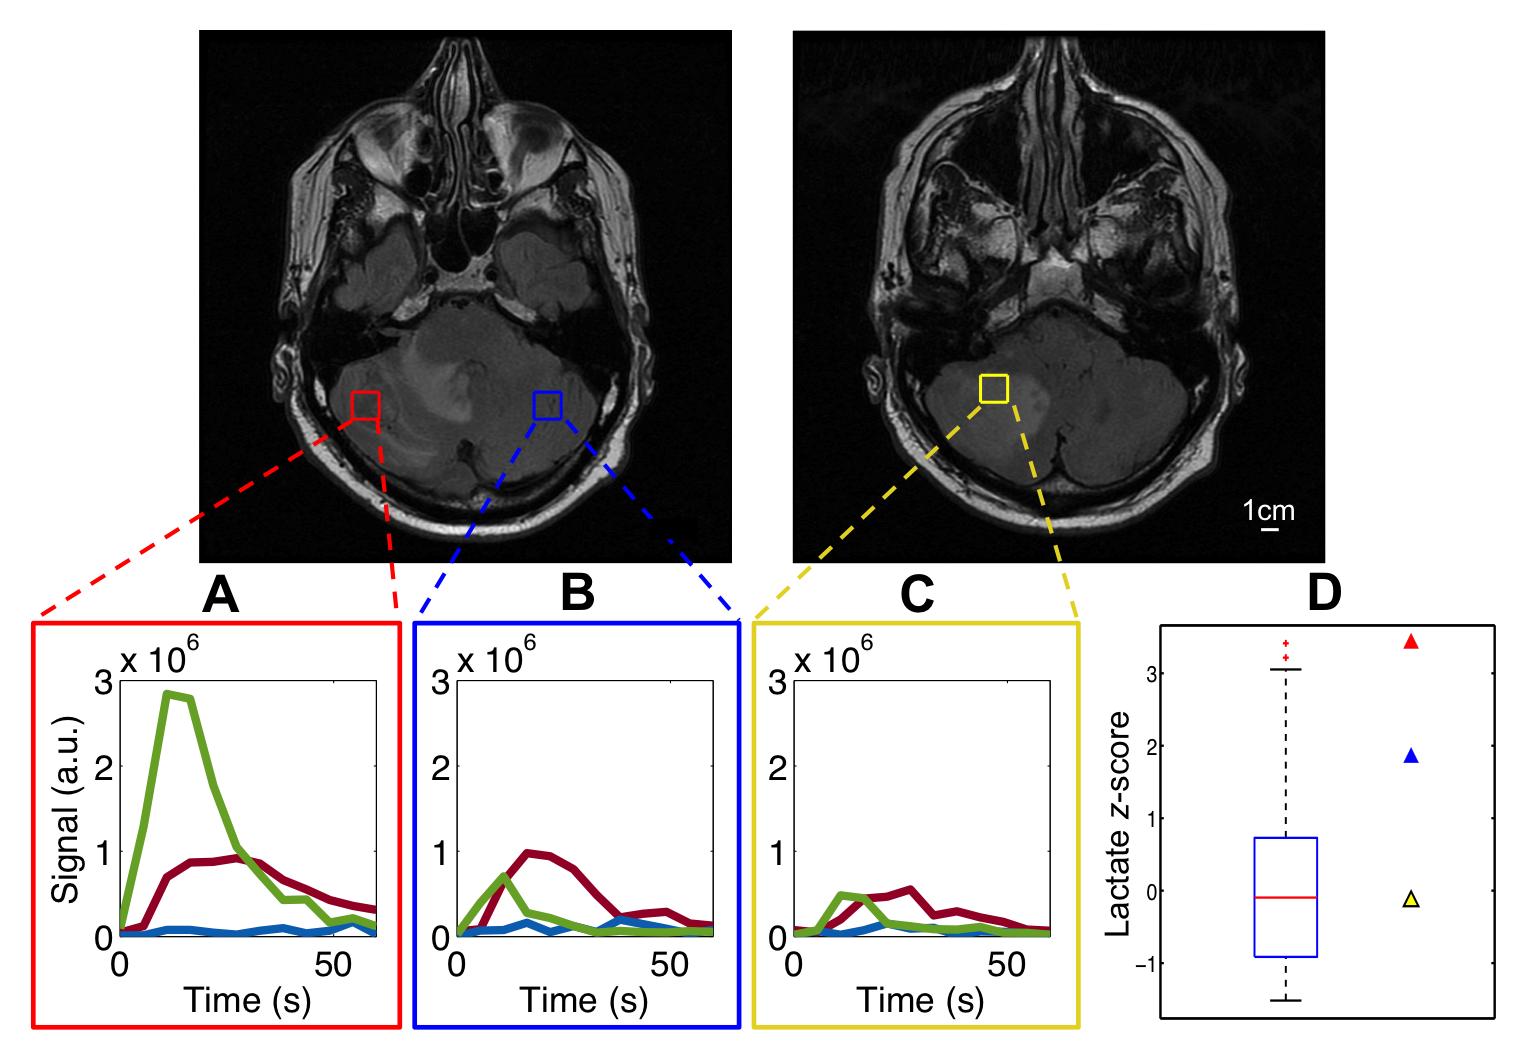
Metabolic maps of lactate, pyruvate, and bicarbonate for the slice that contains metastasis from the patient with metastatic renal cell carcinoma is shown in Fig. 3. Time-course signal profiles from a voxel within metastasis and its contralateral side, and edema are shown in Fig. 4, along with lactate z-scores. In the brains of healthy volunteers, high lactate was consistently observed in the regions around occipital lobe (Fig. 2). For the summarized study results, refer to Fig. 5. Strong lactate signals were observed in the patient’s entire cerebellar region, excluding the region of edema (surrounding the metastasis). The lactate z-score was found to be the highest (z = 3.4) in the voxel within the metastasis (Fig. 4D). Pyruvate signal was also high within the metastasis, as well as the lactate-to-bicarbonate ratio compared to background (Fig. 3). This patient passed away 2 months after these metabolic images were acquired due to disease progression and the metabolic profile shown here (i.e. high lactate and pyruvate signals within metastasis) may have been indicative of the progressive disease state.Conclusion
Hyperpolarized 13C brain images of a renal cell carcinoma patient showed elevated lactate signal within the metastasis, while regions of edema showed decreased lactate signal. Pyruvate signal and the lactate-to-bicarbonate ratio were also elevated within the metastasis, which may be indicative of the progressive disease state of this patient.Acknowledgements
The authors thank Julie Green and Sumeet Sachdeva for coordinating the study, and Ruby Endre for MR technical support. Funding support from the Brain Canada and Canadian Institutes for Health Research.References
1. Nelson, Sarah J., John Kurhanewicz, Daniel B. Vigneron, Peder EZ Larson, Andrea L. Harzstark, Marcus Ferrone, Mark van Criekinge et al. "Metabolic imaging of patients with prostate cancer using hyperpolarized [1-13C] pyruvate." Science translational medicine 5, no. 198 (2013): 198ra108-198ra108.
2. Park, Ilwoo, Peder EZ Larson, Jeremy W. Gordon, Lucas Carvajal, Hsin‐Yu Chen, Robert Bok, Mark Van Criekinge et al. "Development of methods and feasibility of using hyperpolarized carbon‐13 imaging data for evaluating brain metabolism in patient studies." Magnetic resonance in medicine 80, no. 3 (2018): 864-873.
3. Cunningham, Charles H., Justin YC Lau, Albert P. Chen, Benjamin J. Geraghty, William J. Perks, Idan Roifman, Graham A. Wright, and Kim A. Connelly. "Hyperpolarized 13C Metabolic MRI of the Human Heart: Initial Experience." Circulation research 119, no. 11 (2016): 1177-1182.
4. Miloushev, Vesselin Z., Kristin L. Granlund, Rostislav Boltyanskiy, Serge K. Lyashchenko, Lisa M. DeAngelis, Ingo K. Mellinghoff, Cameron W. Brennan et al. "Metabolic Imaging of the Human Brain with Hyperpolarized 13C Pyruvate Demonstrates 13C Lactate Production in Brain Tumor Patients." Cancer research (2018): canres-0221.
5. Gordon, Jeremy W., Hsin‐Yu Chen, Adam Autry, Ilwoo Park, Mark Van Criekinge, Daniele Mammoli, Eugene Milshteyn et al. "Translation of Carbon‐13 EPI for hyperpolarized MR molecular imaging of prostate and brain cancer patients." Magnetic resonance in medicine (2018).
6. Aggarwal, Rahul, Daniel B. Vigneron, and John Kurhanewicz. "Hyperpolarized 1-[13C]-pyruvate magnetic resonance imaging detects an early metabolic response to androgen ablation therapy in prostate cancer." European urology 72, no. 6 (2017): 1028-1029.
7. Walenta, Stefan, Michael Wetterling, Michael Lehrke, Georg Schwickert, Kolbein Sundfør, Einar K. Rofstad, and Wolfgang Mueller-Klieser. "High lactate levels predict likelihood of metastases, tumor recurrence, and restricted patient survival in human cervical cancers." Cancer research 60, no. 4 (2000): 916-921.
8. Quennet, Verena, Ala Yaromina, Daniel Zips, Andrea Rosner, Stefan Walenta, Michael Baumann, and Wolfgang Mueller-Klieser. "Tumor lactate content predicts for response to fractionated irradiation of human squamous cell carcinomas in nude mice." Radiotherapy and Oncology 81, no. 2 (2006): 130-135.
9. Cunningham, Charles H., Albert P. Chen, Michael Lustig, Brian A. Hargreaves, Janine Lupo, Duan Xu, John Kurhanewicz et al. "Pulse sequence for dynamic volumetric imaging of hyperpolarized metabolic products." Journal of magnetic resonance 193, no. 1 (2008): 139-146.
10. Geraghty, Benjamin J., Justin YC Lau, Albert P. Chen, and Charles H. Cunningham. "Dual‐Echo EPI sequence for integrated distortion correction in 3D time‐resolved hyperpolarized 13C MRI." Magnetic resonance in medicine 79, no. 2 (2018): 643-653.
Figures