0723
Metabolic imaging of brain inflammation using hyperpolarized 13C MRSI of pyruvate and urea in a mouse model of multiple sclerosis1Department of Physical Therapy and Rehabilitation Science, University of California San Francisco, San Francisco, CA, United States, 2Department of Radiology and Biomedical Imaging, University of California San Francisco, San Francisco, CA, United States, 3Division of Neuroimmunology and Glial Biology, Department of Neurology, University of California San Francisco, San Francisco, CA, United States, 4Department of Radiology, C.J. Gorter Center for High Field MRI, Leiden University Medical Center, Leiden, Netherlands, 5Department of Ophthalmology, University of California San Francisco, San Francisco, CA, United States
Synopsis
We used conventional MRI and hyperpolarized 13C magnetic resonance spectroscopy (HP 13C MRSI) quantitative imaging of pyruvate and urea to assess lesion pathology and the metabolic signature in a model of multiple sclerosis (MS). T2 sequences detected white matter lesions and gadolinium-enhanced MRI showed blood-brain-barrier breakdown. HP 13C MRSI revealed increased lactate production and lactate-to-pyruvate ratios while urea levels remained unchanged. This is consistent with macrophage/monocyte infiltration into the CNS found in the model. Altogether, these findings demonstrate that HP 13C MRSI has potential to monitor macrophage infiltration and innate immune activation in inflammatory diseases of the central nervous system.
Introduction
The combined cuprizone and experimental autoimmune encephalomyelitis (CPZ/EAE) is a recently developed model of multiple sclerosis (MS) that recapitulates key features of MS such as neurological symptoms, recruitment of T-cells into demyelinated brain lesions and increased number of innate immune cells1,2. Several recent studies have shown that hyperpolarized 13C magnetic resonance spectroscopy imaging (HP 13C MRSI) of pyruvate can detect the presence of activated macrophages both in vitro and in vivo3-9. In this study, our goal was to characterized the CPZ/EAE model using conventional MRI, HP 13C MRSI of pyruvate and urea, clinical evaluation of disease severity, evaluation of visual pathway conduction using visual evoked potential (VEP)10, and immunofluorescence (IF) analyses.
Methods
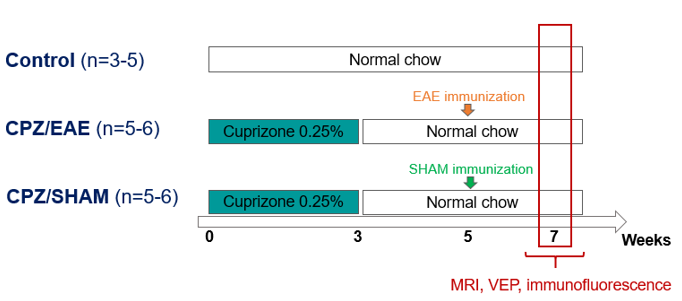
Animals and experimental setup: C57/BL6J mice were separated in three groups: 1-Control (n=3-5), 2-CPZ/SHAM (n=5-6) and 3-CPZ/EAE (n=5-6). Control received a normal chow while groups 2 and 3 were fed a CPZ diet (0.25%) for three weeks to induce brain demyelination/neuroinflammation, and were returned to a normal chow for five weeks. Groups 2 and 3 were SHAM-immunized or MOG35-55-immunized, respectively. MRI, VEP and IF were performed at seven weeks post-induction of the disease, as described in Figure 1.A.
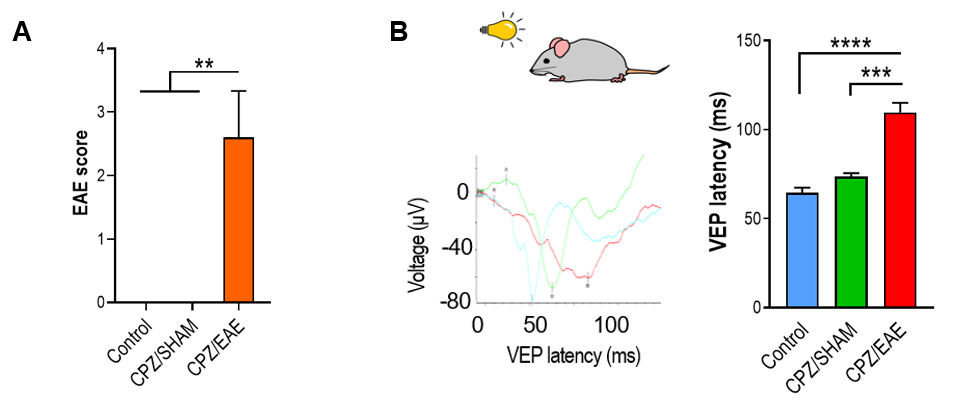
EAE scoring: Scoring of disease severity was performed as followed: 0) normal, 1) decreased tail tone, 2) hind limb weakness, 3) hind limb paralysis, 4) forelimbs weakness/paraplegia, 5) limbs paralysis.
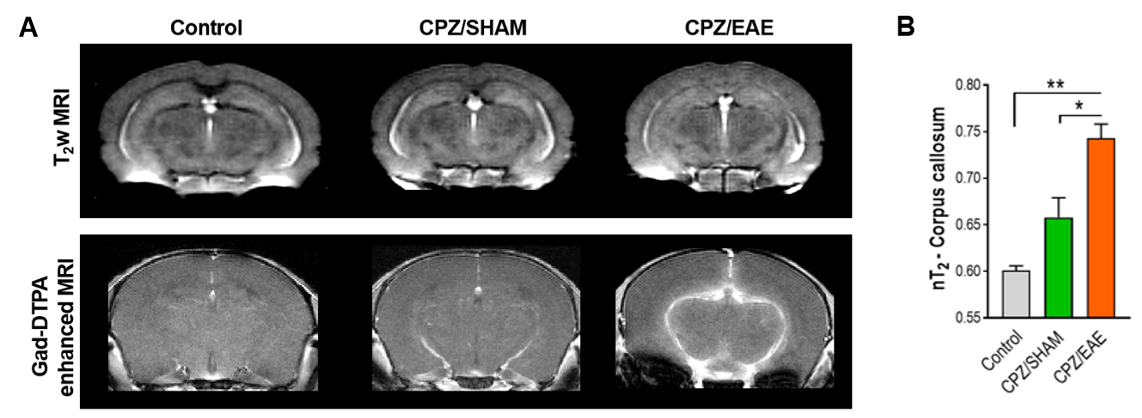
MR acquisitions: MR acquisitions were performed on a 14.1T MR scanner. T2-weighted images were acquired using: TE/TR=12/2000ms, thickness=0.5mm, NA=8, matrix=256x256, FOV=30x30mm². To evaluate blood brain barrier (BBB) integrity, T1-weighted images post-gadolinium-DTPA injection were acquired: TE/TR=2/120ms, thickness=0.8mm, NA=10, matrix=256x256, FOV=20x20mm².
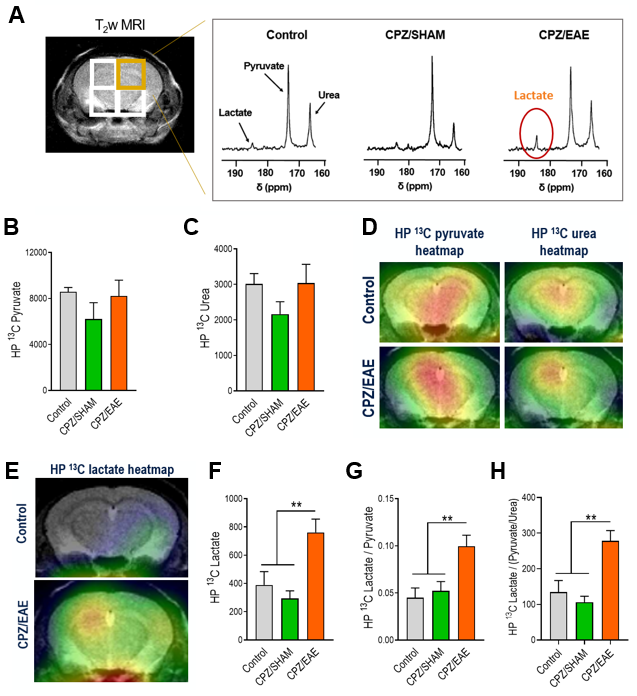
For 13C MRS, 2D dynamic CSI, 24μl [1-13C] pyruvate and 55μl 13C urea were co-polarized for ~1h in a Hypersense polarizer (Oxford Instruments), and rapidly dissolved in 4.5ml heated buffer (80mM NaOH in PBS). 13C data were acquired from the beginning of HP 13C pyruvate and urea injection: TE/TR=1.2/60ms; SW=2500Hz; 128points; 4sec resolution; FA=10deg; FOV=24x24 mm²; thickness=5mm.
MR analyses: Corpus callosum was delineated on T2-weighted images and the average T2 signals were normalized (nT2) to T2 from the cerebrospinal fluid.
For HP 13C MRSI, spectra were summed over time, HP 13C lactate, pyruvate, urea levels were calculated as the fit integrals.
VEP: Visual pathway conduction was examined by recording of flash VEP using an Espion Diagnosys setup. The time (in milliseconds) to the N1 (first negative deflection) was used to calculate VEP latency.
Immunofluorescence: IF analyses were performed for macrophages (Iba-1), CD3 T-cells and nuclei (Hoechst).
Statistical analyses: Statistical significance was
evaluated using a One-Way ANOVA with post-hoc Tukey (*p<0.05, **p<0.01,
***p<0.001, ****p<0.0001).
Results
In this study, only mice from the CPZ/EAE group developed limb weakness and paralysis (Figure 2.A, p≤0.007). Similarly, only CPZ/EAE mice showed increased VEP latency at 7 weeks, indicating persistent injury to the visual pathway (Figure 2.B, p≤0.0001).
CPZ/EAE mice showed a hyper-intense corpus callosum on T2-weighted MRI indicating demyelination and edema/inflammation (Figure 3.A, top row). Quantitative analyses revealed a significant increase of nT2 values from the corpus callosum of CPZ/EAE compared to Control and CPZ/SHAM (Figure 3.B, p≤0.0355). Hyper-intense contrast seen on T1-weighted Gadolinium-enhanced MRI clearly indicated leaky BBB in CPZ/EAE mice (Figure 3.A, bottom row).
CPZ/EAE mice displayed significantly higher level of HP 13C lactate as indicated on HP 13C spectra (Figure 4.A). Quantitative analyses revealed no changes in HP 13C pyruvate and urea levels between groups (Figure 4.B-D, p≤0.35 and p≤0.30, respectively). In contrast, HP 13C lactate levels, HP 13C lactate-to-pyruvate ratios, and HP 13C lactate-to-pyruvate ratios normalized to urea levels, were significantly increased in CPZ/EAE mice (Figure 4. E-F, p≤0.0049, p≤0.0095 and, p≤0.0068, respectively).
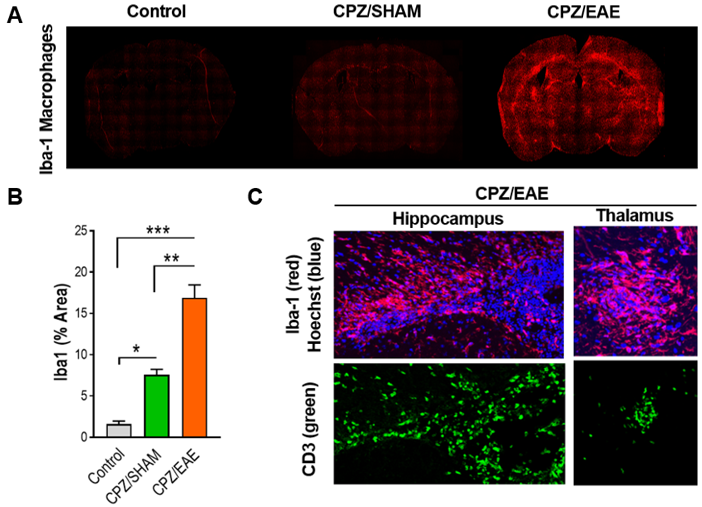
IF
analyses revealed higher number of macrophages throughout the brain in CPZ/EAE
mice (Figure 5.A-B, p≤0.0015) and
infiltration of CD3 T-cells in close vicinity of blood vessels, beneath the
hippocampus and thalamus (Figure 5.C).
Discussion
In conclusion, we showed that conventional T2-weighted and gadolinium-enhanced imaging can detect demyelinated and inflammatory lesions in the CPZ/EAE model. HP 13C lactate production was increased in CPZ/EAE mice, in agreement with increased neuroinflammation levels. Interestingly, urea delivery did not increase despite a leaky BBB. Enzyme activity assays for pyruvate dehydrogenase and lactate dehydrogenase will be performed to further confirm the HP 13C MRSI result, and specific inhibitors may be used to further validate the origin of the HP 13C lactate signal. Future studies will include monitoring of response to anti-inflammatory therapies.Acknowledgements
This work was supported by research grants: NIH R01NS102156, Cal-BRAIN 349087, NMSS research grant RG-1701-26630, Hilton Foundation – Marilyn Hilton Award for Innovation in MS Research #17319. Dana Foundation: The David Mahoney Neuroimaging program, NIH Hyperpolarized MRI Technology Resource Center #P41EB013598, fellowship from the NMSS (FG-1507-05297).References
- 1. Scheld, M. et al. Neurodegeneration Triggers Peripheral Immune Cell Recruitment into the Forebrain. J Neurosci 36, 1410-1415, doi:10.1523/JNEUROSCI.2456-15.2016 (2016).
- 2. Ruther, B. J. et al. Combination of cuprizone and experimental autoimmune encephalomyelitis to study inflammatory brain lesion formation and progression. Glia 65, 1900-1913, doi:10.1002/glia.23202 (2017).
- 3. Guglielmetti, C. et al. Hyperpolarized 13C MR metabolic imaging can detect neuroinflammation in vivo in a multiple sclerosis murine model. Proc Natl Acad Sci U S A 114, E6982-E6991, doi:10.1073/pnas.1613345114 (2017).
- 4. Guglielmetti, C. et al. In vivo metabolic imaging of Traumatic Brain Injury. Sci Rep 7, 17525, doi:10.1038/s41598-017-17758-4 (2017).
- 5. Josan, S. et al. Assessing inflammatory liver injury in an acute CCl4 model using dynamic 3D metabolic imaging of hyperpolarized [1-(13)C]pyruvate. NMR Biomed 28, 1671-1677, doi:10.1002/nbm.3431 (2015).
- 6. Lewis, A. J. M. et al. Noninvasive Immunometabolic Cardiac Inflammation Imaging Using Hyperpolarized Magnetic Resonance. Circ Res 122, 1084-1093, doi:10.1161/CIRCRESAHA.117.312535 (2018).
- 7. MacKenzie, J. D. et al. Detection of inflammatory arthritis by using hyperpolarized 13C-pyruvate with MR imaging and spectroscopy. Radiology 259, 414-420, doi:10.1148/radiol.10101921 (2011).
- 8. Sriram, R. et al. Molecular detection of inflammation in cell models using hyperpolarized (13)C-pyruvate. Theranostics 8, 3400-3407, doi:10.7150/thno.24322 (2018).
- 9. Thind, K. et al. Detection of radiation-induced lung injury using hyperpolarized (13)C magnetic resonance spectroscopy and imaging. Magn Reson Med 70, 601-609, doi:10.1002/mrm.24525 (2013).
- 10. Schirmer, L. et al. Oligodendrocyte-encoded Kir4.1 function is required for axonal integrity. Elife 7, doi:10.7554/eLife.36428 (2018).
Figures