0721
Longitudinal Hyperpolarized 13C Imaging of Metabolic Changes Following Myocardial Infarction in Pigs1Institute for Biomedical Engineering, University and ETH Zurich, Zurich, Switzerland, 2Department of Cardiology, University Heart Center, University Hospital Zurich, Zurich, Switzerland, 3Department Cardiology, Pneumology and Angiology, Heinrich Heine University, Duesseldorf, Germany, 4Division of Surgical Research, University Hospital Zurich, Zurich, Switzerland
Synopsis
The heart’s dynamic, bimodal response to myocardial infarction warrants longitudinal study designs to better understand the interplay between perfusion deficits, metabolic processes and function. To this end, a longitudinal study over 12 weeks was set up to probe myocardial metabolism post-infarction in an infarct pig model using hyperpolarized [13C]-pyruvate. Image acquisition was optimized for improved spatial and temporal image fidelity based on spectrally-selective excitation and EPI readouts. Initial results demonstrate good agreement with supplementary gadolinium enhanced imaging and indicate a temporal metabolic shift towards increased lactate-to-bicarbonate ratios in the lesion territory caused by cardiac infarction.
Introduction
Dynamic Nuclear Polarization has been used to probe cardiac metabolism of various pathologies in animal models and recently in humans1-5. Myocardial infarction is of particular interest due to the high prevalence and the potential of identifying salvageable hibernating myocardium with hyperpolarized [13C]-pyruvate along with triggers of tissue remodeling around the necrotic zones. The heart’s response to myocardial infarction follows an intricate bimodal temporal pattern of inflammatory and reparative activity6-7.
To better understand these dynamics, a longitudinal study design in a chronic infarction pig model has been implemented and initial results are presented.
Methods
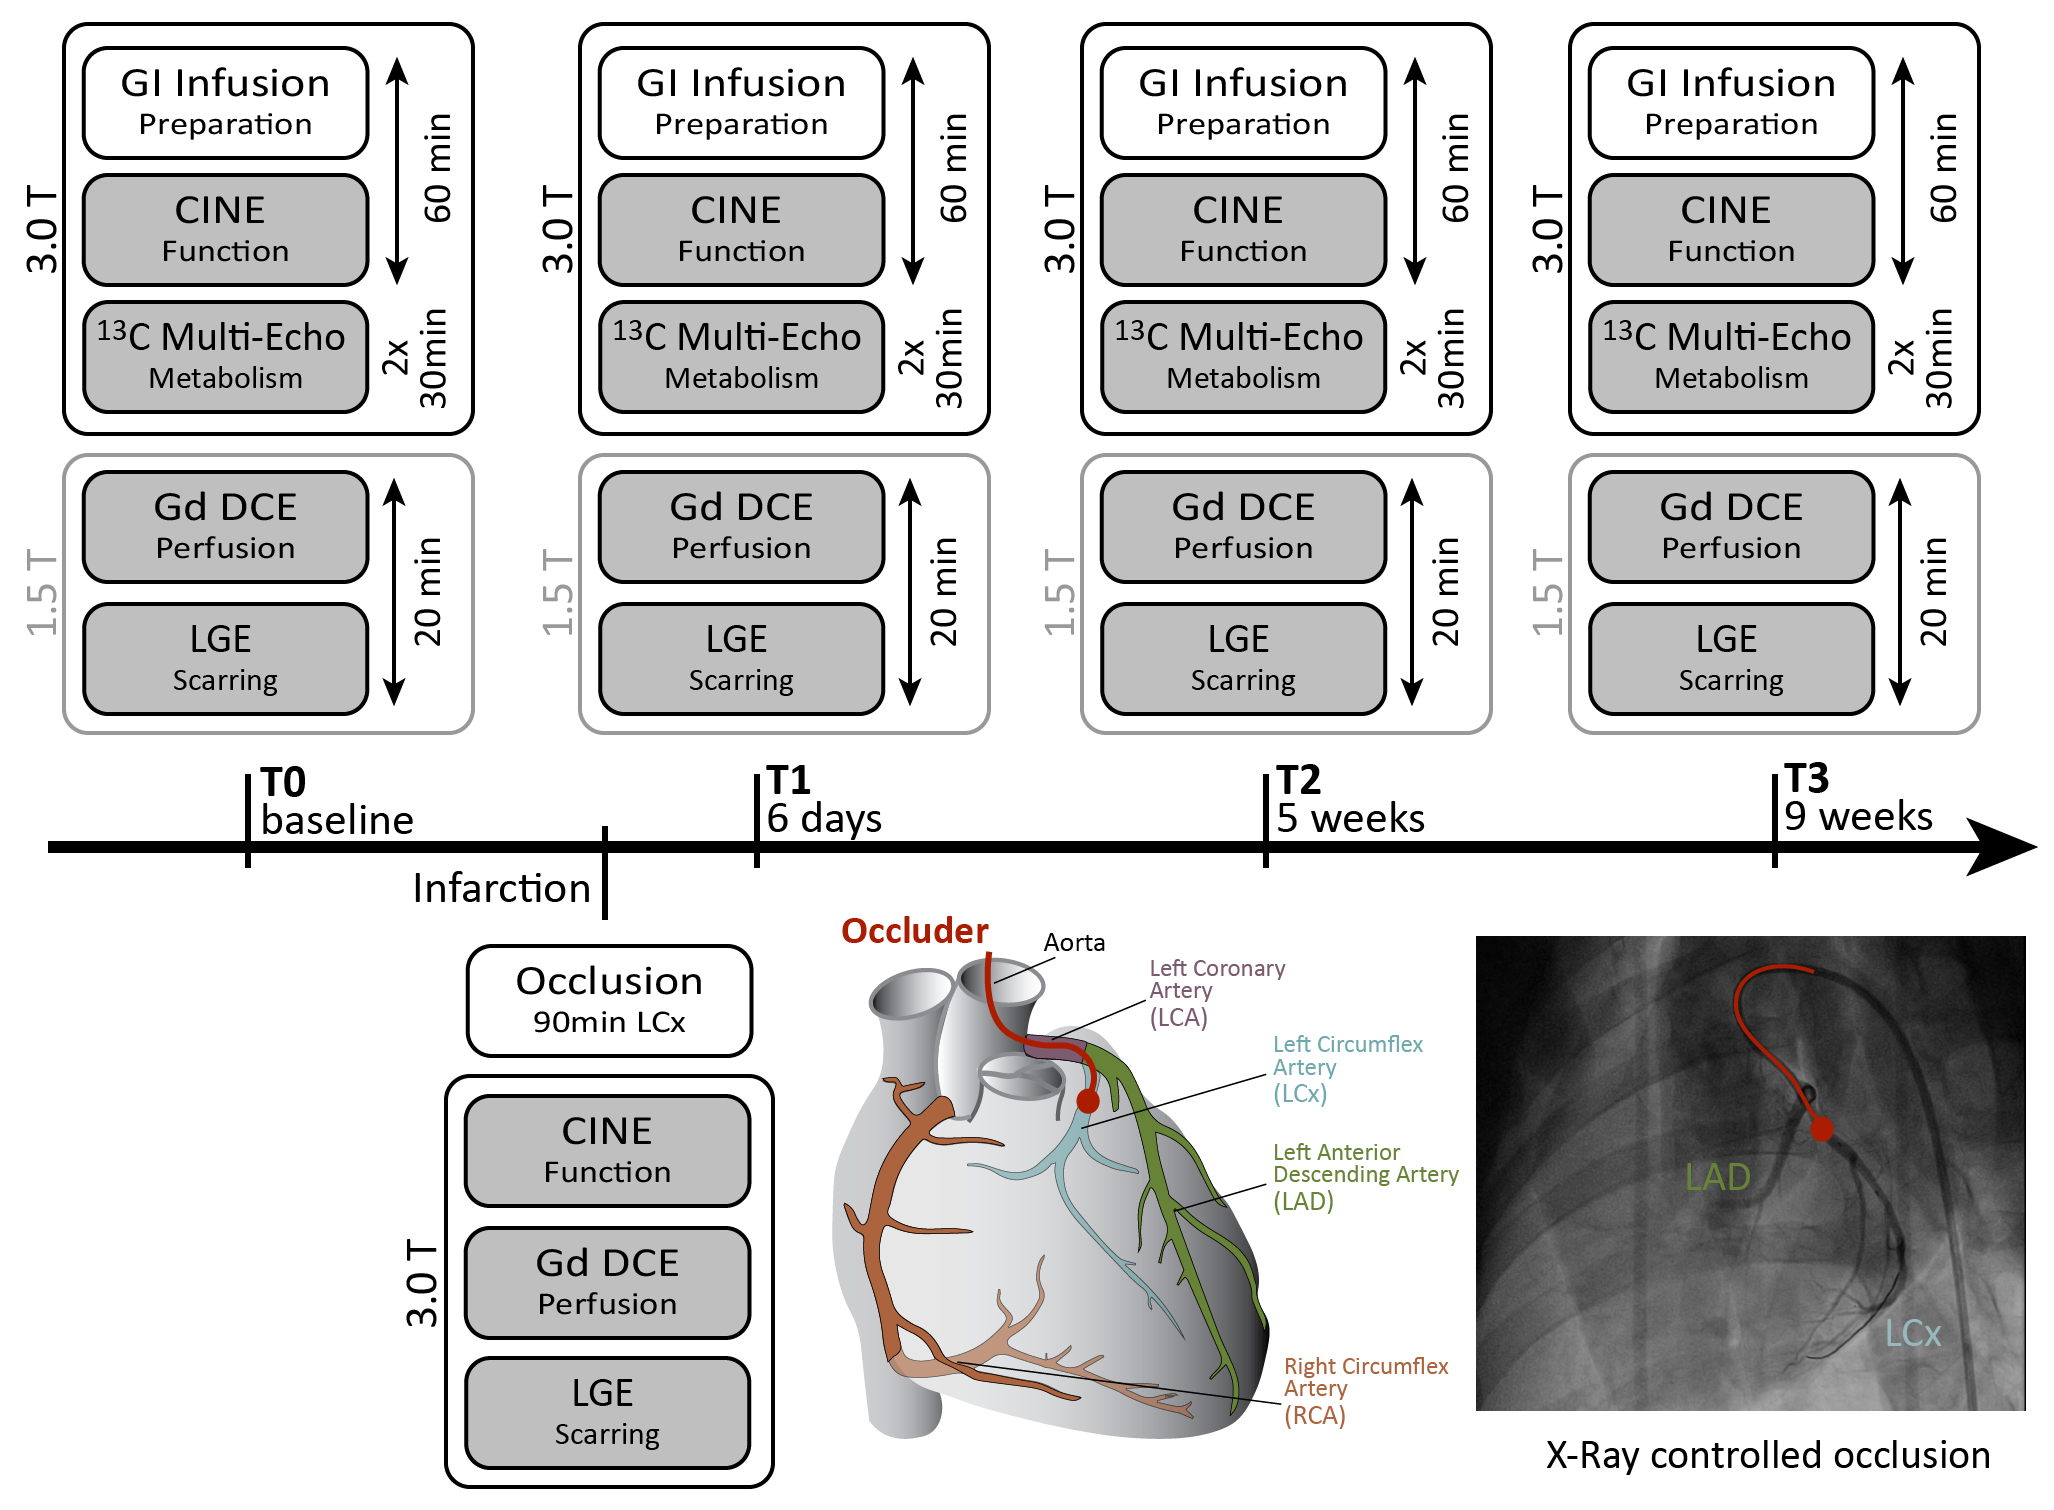
The experimental timeline is outlined in Fig-1: Three healthy female pigs were anesthetized, ventilated and treated with a glucose(20%)–insulin(50U/L) solution to a target blood-glucose level of 6.7mmol/l, 60min prior to metabolic imaging8-10. After baseline measurements, infarction is induced by fluoroscopically guided occlusion of the left circumflex artery (LCX) for 90min. Metabolic and functional imaging is then repeated at day #6, week #5 and week #9 post-infarction. All experiments were performed in accordance with the Swiss Animal Protection Law and Ordinance.
Neat [1-13C]-pyruvic acid doped with 15mM trityl radical was polarized in a commercial SpinLab hyperpolarizer (GE Healthcare) and 0.7ml/kg of 250mM [1-13C]-pyruvate solution were injected over 10s into the femoral vein after dissolution, neutralization in 0.72M NaOH and transport to the scanner. Injection and image acquisition was started approximately 20s after dissolution.
Metabolic image series were reconstructed from echo-shifted ($$$N_{echo}$$$=6, $$$\Delta{}$$$TE=1.15ms) single-shot EPI acquisitions based on an extended IDEAL11 signal model presented previously12:
$${{u}_{n}}(\overset{\scriptscriptstyle\rightharpoonup}{k})=\sum\limits_{m=1}^{M}{{{e}^{i2\pi \Delta {{f}_{m}}{{t}_{n}}}}{{e}^{-i\overset{\scriptscriptstyle\rightharpoonup}{k}\Delta {{{\overset{\scriptscriptstyle\rightharpoonup}{r}}}_{m}}}}\sum\limits_{r}{{{e}^{i\overset{\scriptscriptstyle\rightharpoonup}{k}\overset{\scriptscriptstyle\rightharpoonup}{r}}}}}{{w}_{m,n}}{{e}^{i2\pi \tilde{\gamma }{{B}_{0}}(\overset{\scriptscriptstyle\rightharpoonup}{r}){{t}_{n}}}}{{\rho }_{m}}(\overset{\scriptscriptstyle\rightharpoonup}{r})$$
With,$$$\;\Delta{f_{m}},\Delta\overset{\scriptscriptstyle\rightharpoonup}{r}_{m}\;$$$the metabolite specific chemical and spatial shift, $$$t_{n}$$$=TE+n$$$\Delta$$$TE the echo time,$$$\;w_{m,n}\;$$$a signal weighting factor accounting for excitation flip-angles and saturation and$$$\;\rho_{m}\;$$$the metabolite intensities. Off-resonances were obtained from a separately acquired B0 map.
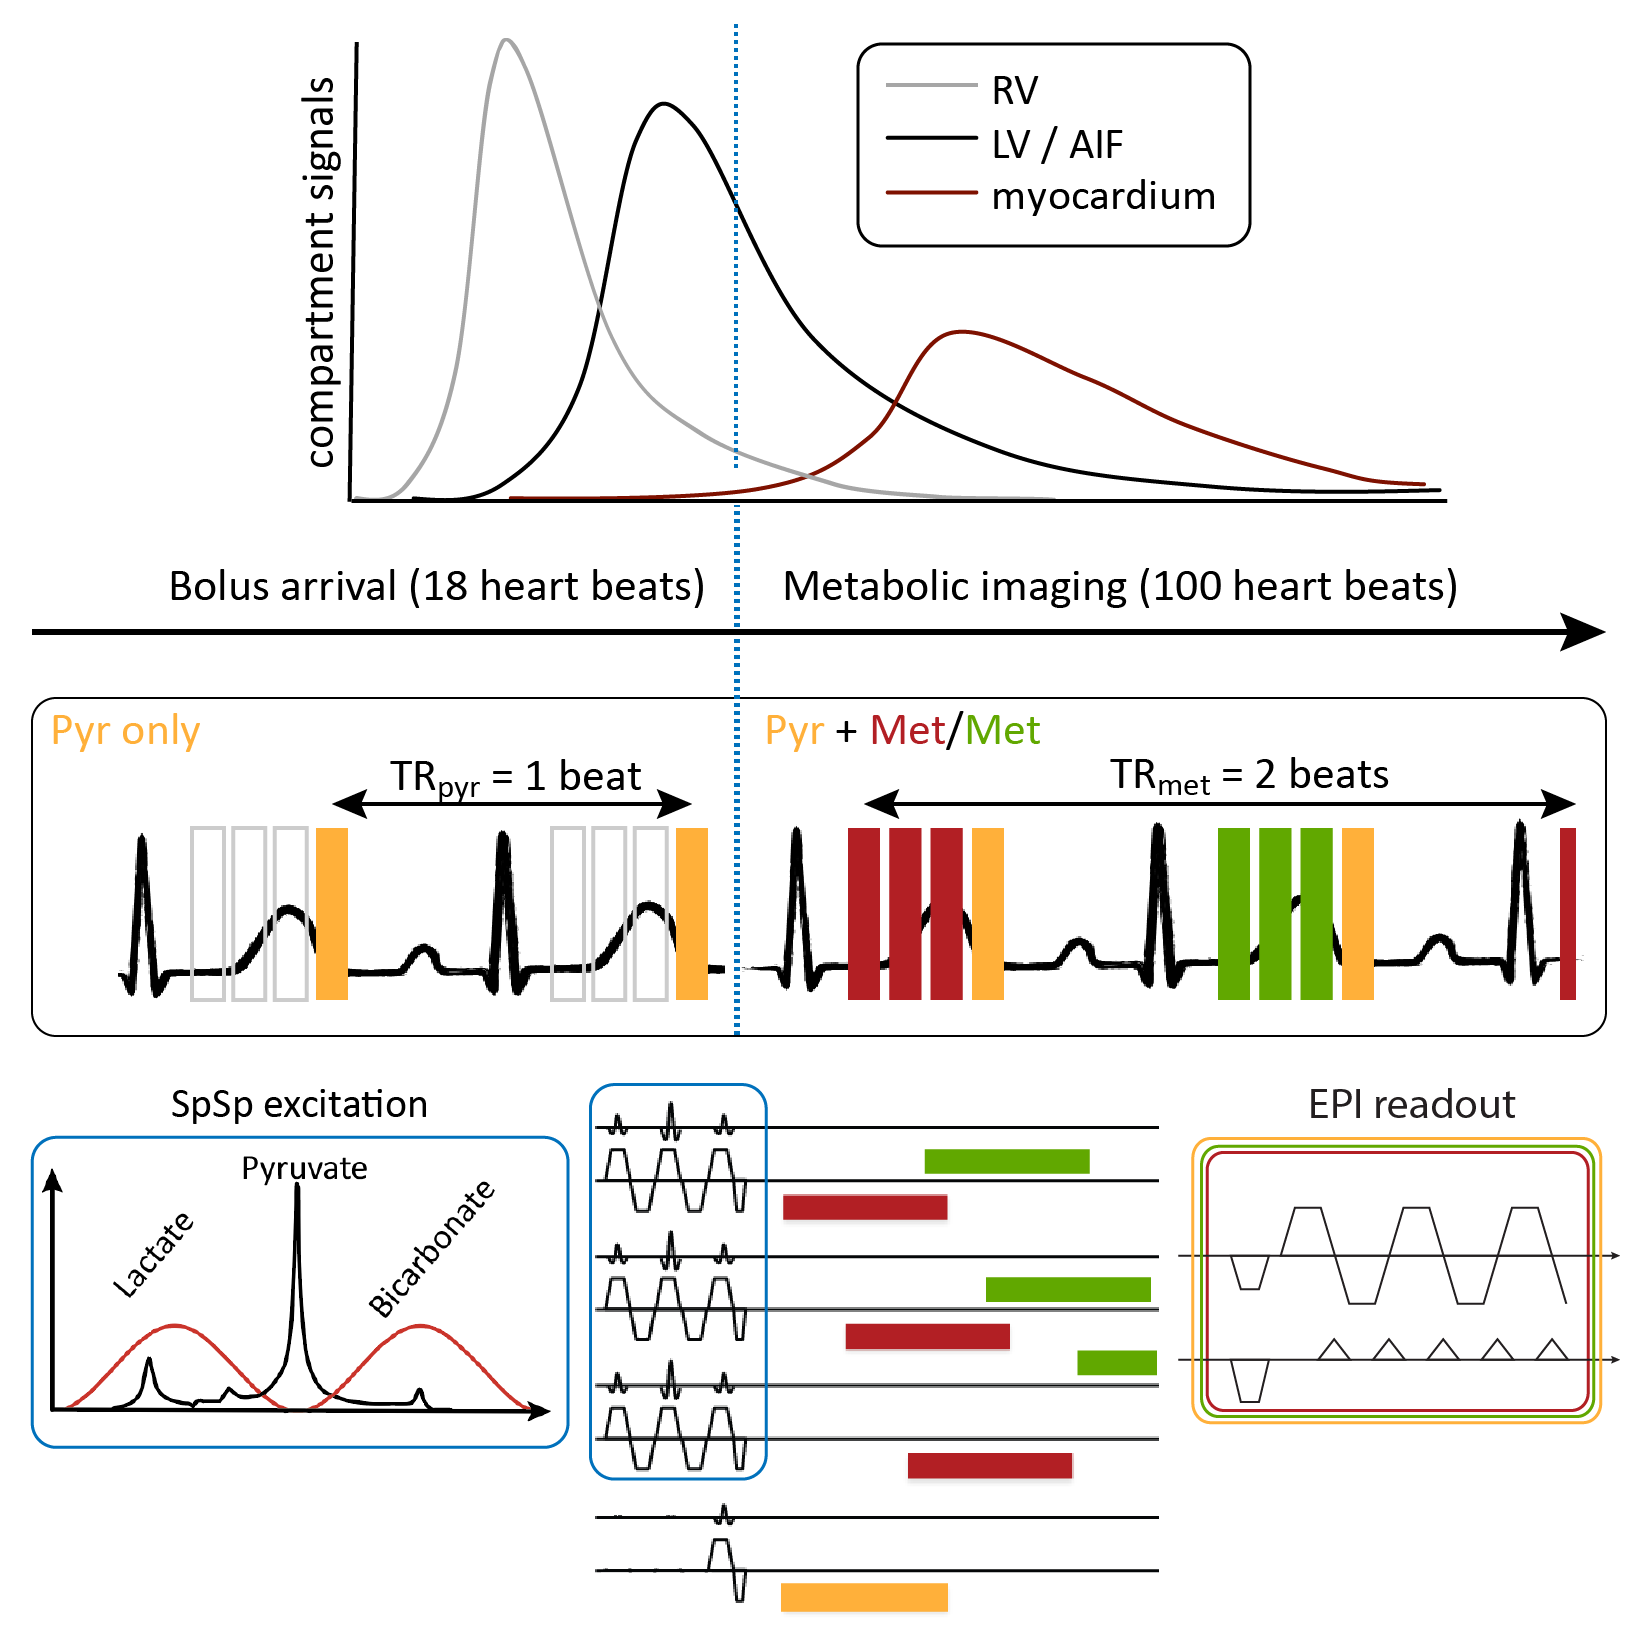
Imaging was performed on a clinical 3T Ingenia system (Philips Healthcare) equipped with a 4-channel 13C transmit/receive coil (Rapid Biomedical). The dynamic acquisition scheme is illustrated in Fig-2. Within one heartbeat, three echo-shifted images were acquired with a spectrally-selective binomial 1-2-1 excitation pulse13 (BW=20ppm, FA=30°), followed by a pyruvate shot acquired with conventional excitation and a reduced flip-angle (FA=5°). The effective TR for pyruvate and metabolite signals were therefore 1 and 2 heartbeats, respectively. During the first 18 heartbeats, metabolic imaging was suspended to reduce bolus saturation. All dynamic images were acquired during suspended ventilation using ECG synchronization and triggering.
Prior
to hyperpolarized imaging, cine scans for functional assessment and a B0-map were acquired. Sequence
parameters for the echo-shifted 13C EPI were: FOV 220x220mm2,
in-plane resolution 5x5mm2 (reconstructed to 1x1mm2),
slice-thickness 20mm, partial Fourier factor 0.75, TE=11.6ms.
Acquisition duration per heartbeat was 130-150ms for 4 frames.
Gadolinium enhanced 1H dynamic perfusion (DCE) and late gadolinium enhancement (LGE) images were acquired on a 1.5T Philips Achieva system during the same scan session using a 0.1mmol/kg dose of Gadolinium with a waiting period of 20min before LGE imaging.
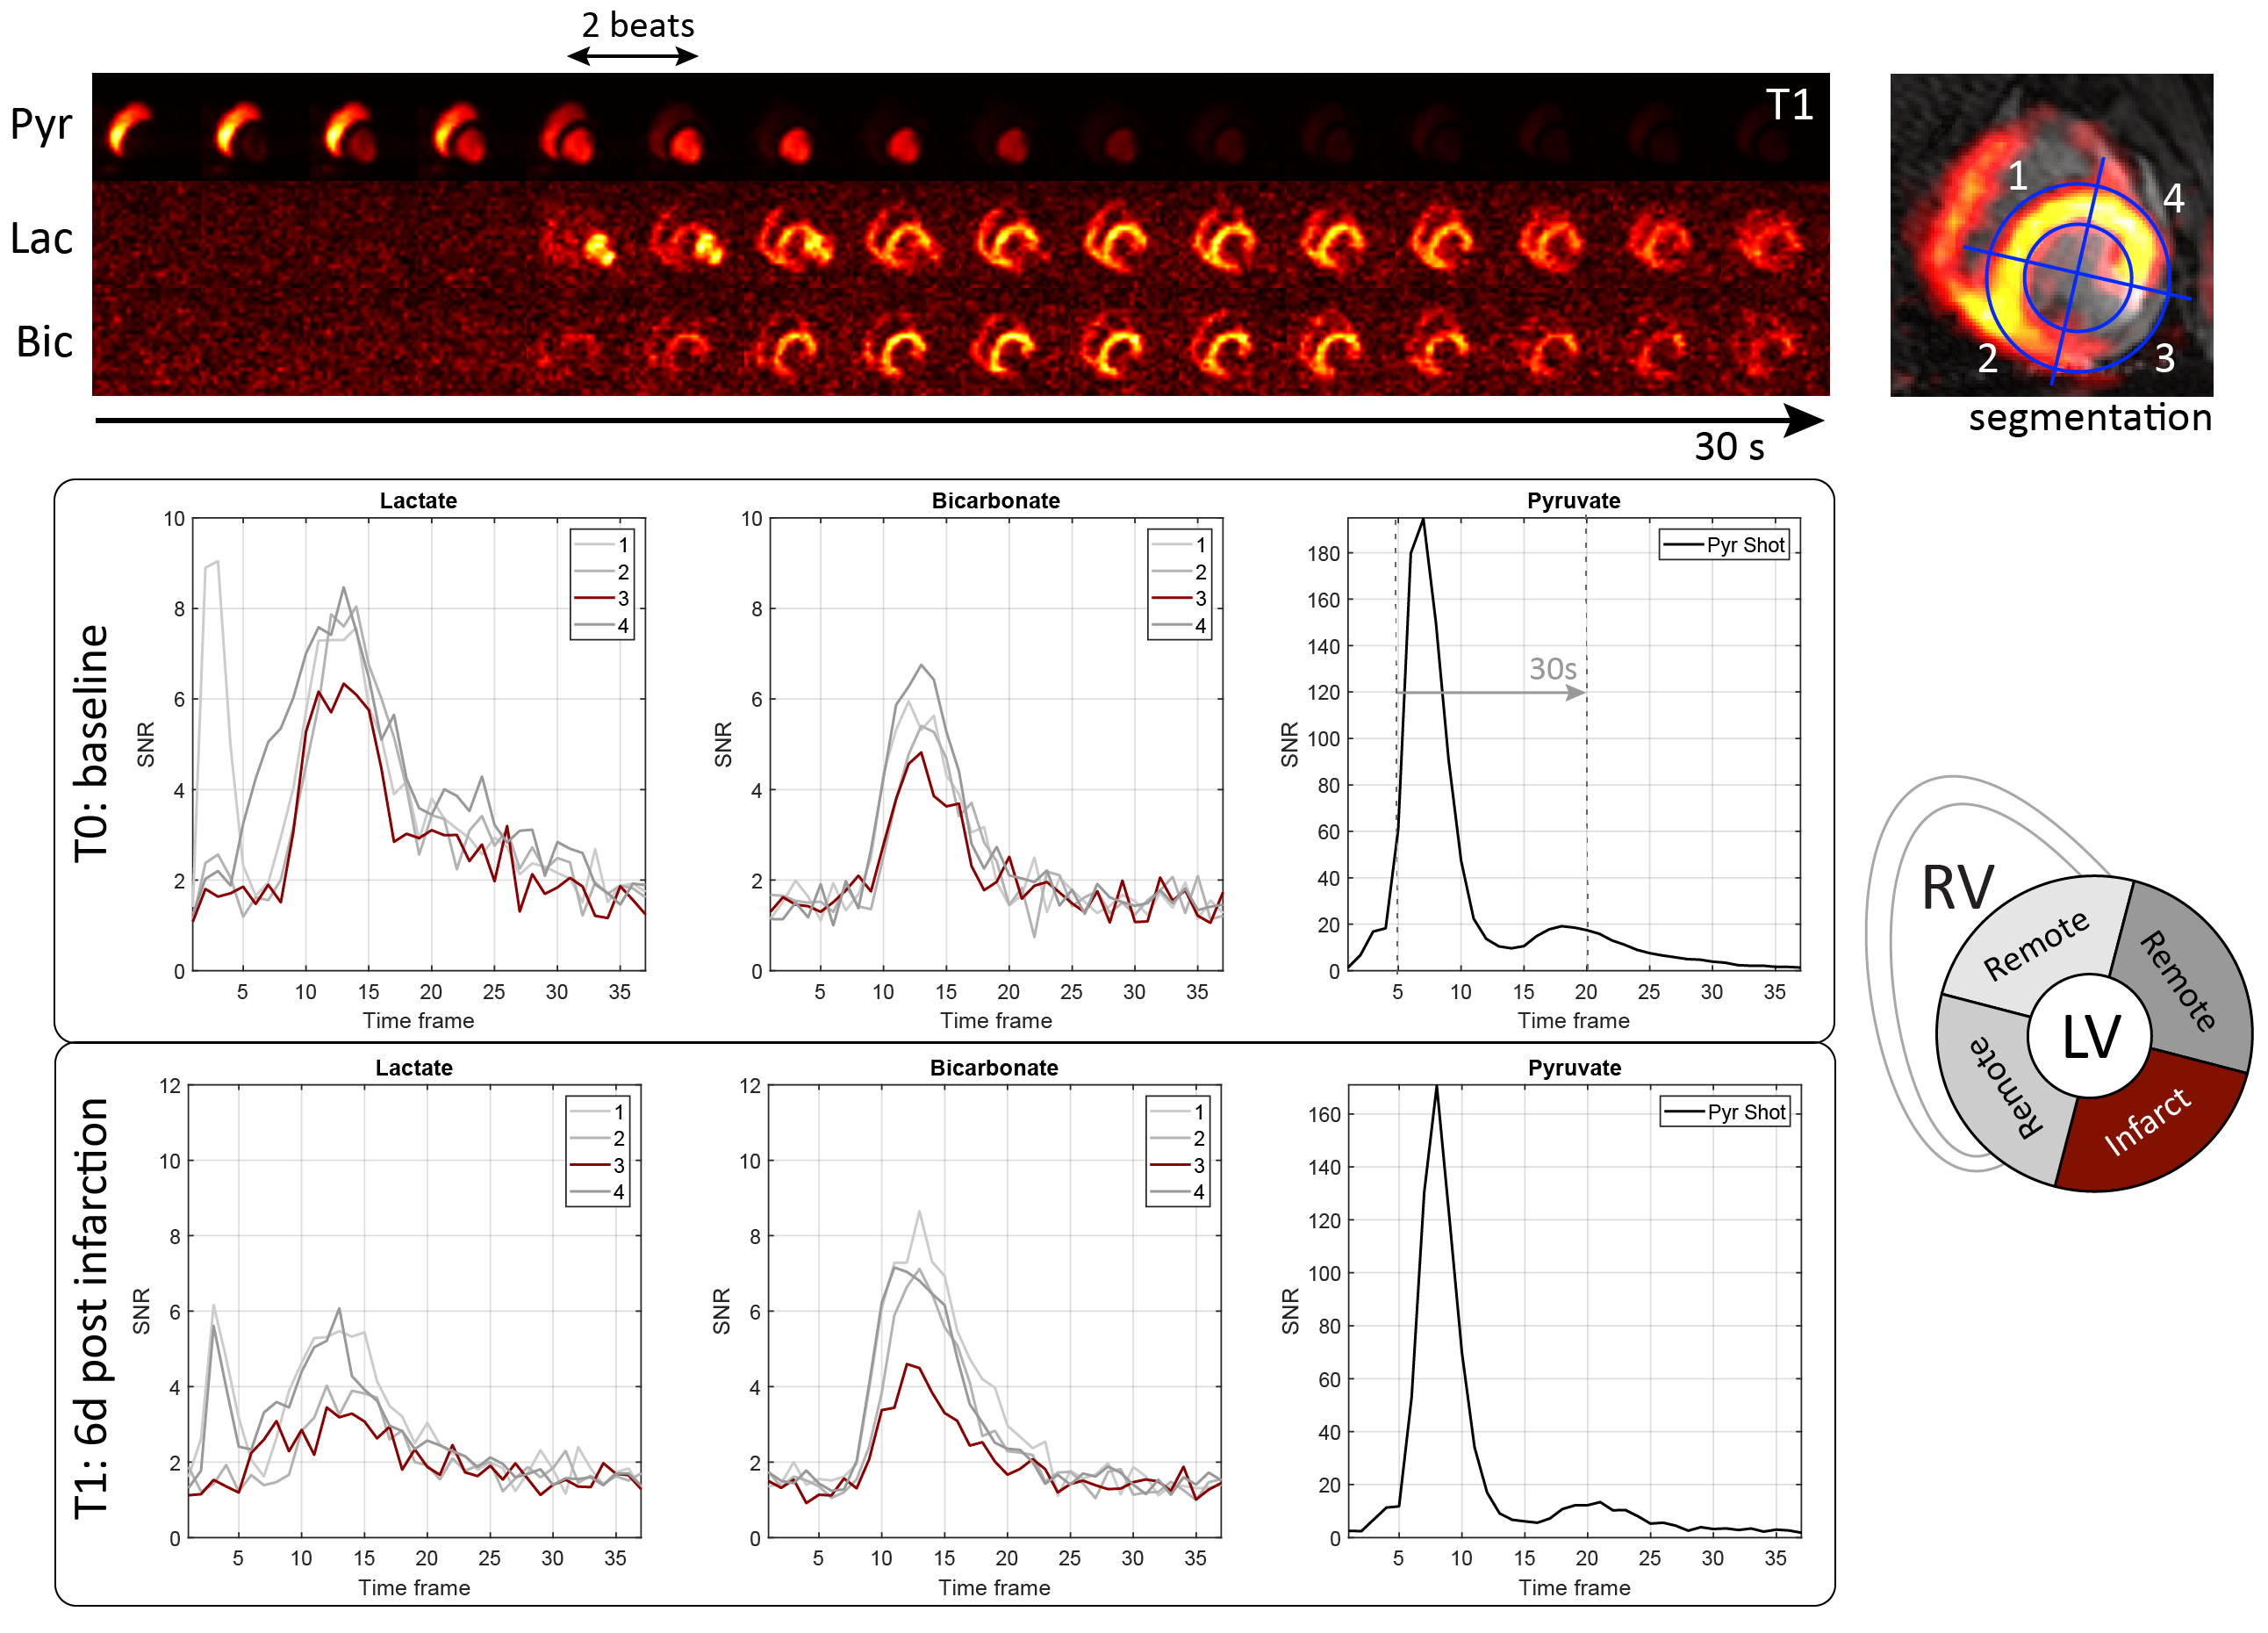
Metabolite image series were reconstructed using a conjugate gradient descent algorithm implemented in MATLAB for the inversion of Eq-1. The myocardium was segmented based on metabolic and LGE images (Fig-4) to extract metabolite time curves. Area-under-the-curve (AUC) ratios for lactate and bicarbonate were calculated and normalized to the AUC of pyruvate as estimates for kinetic conversion14. For further analysis, the remote sectors were averaged.
Results
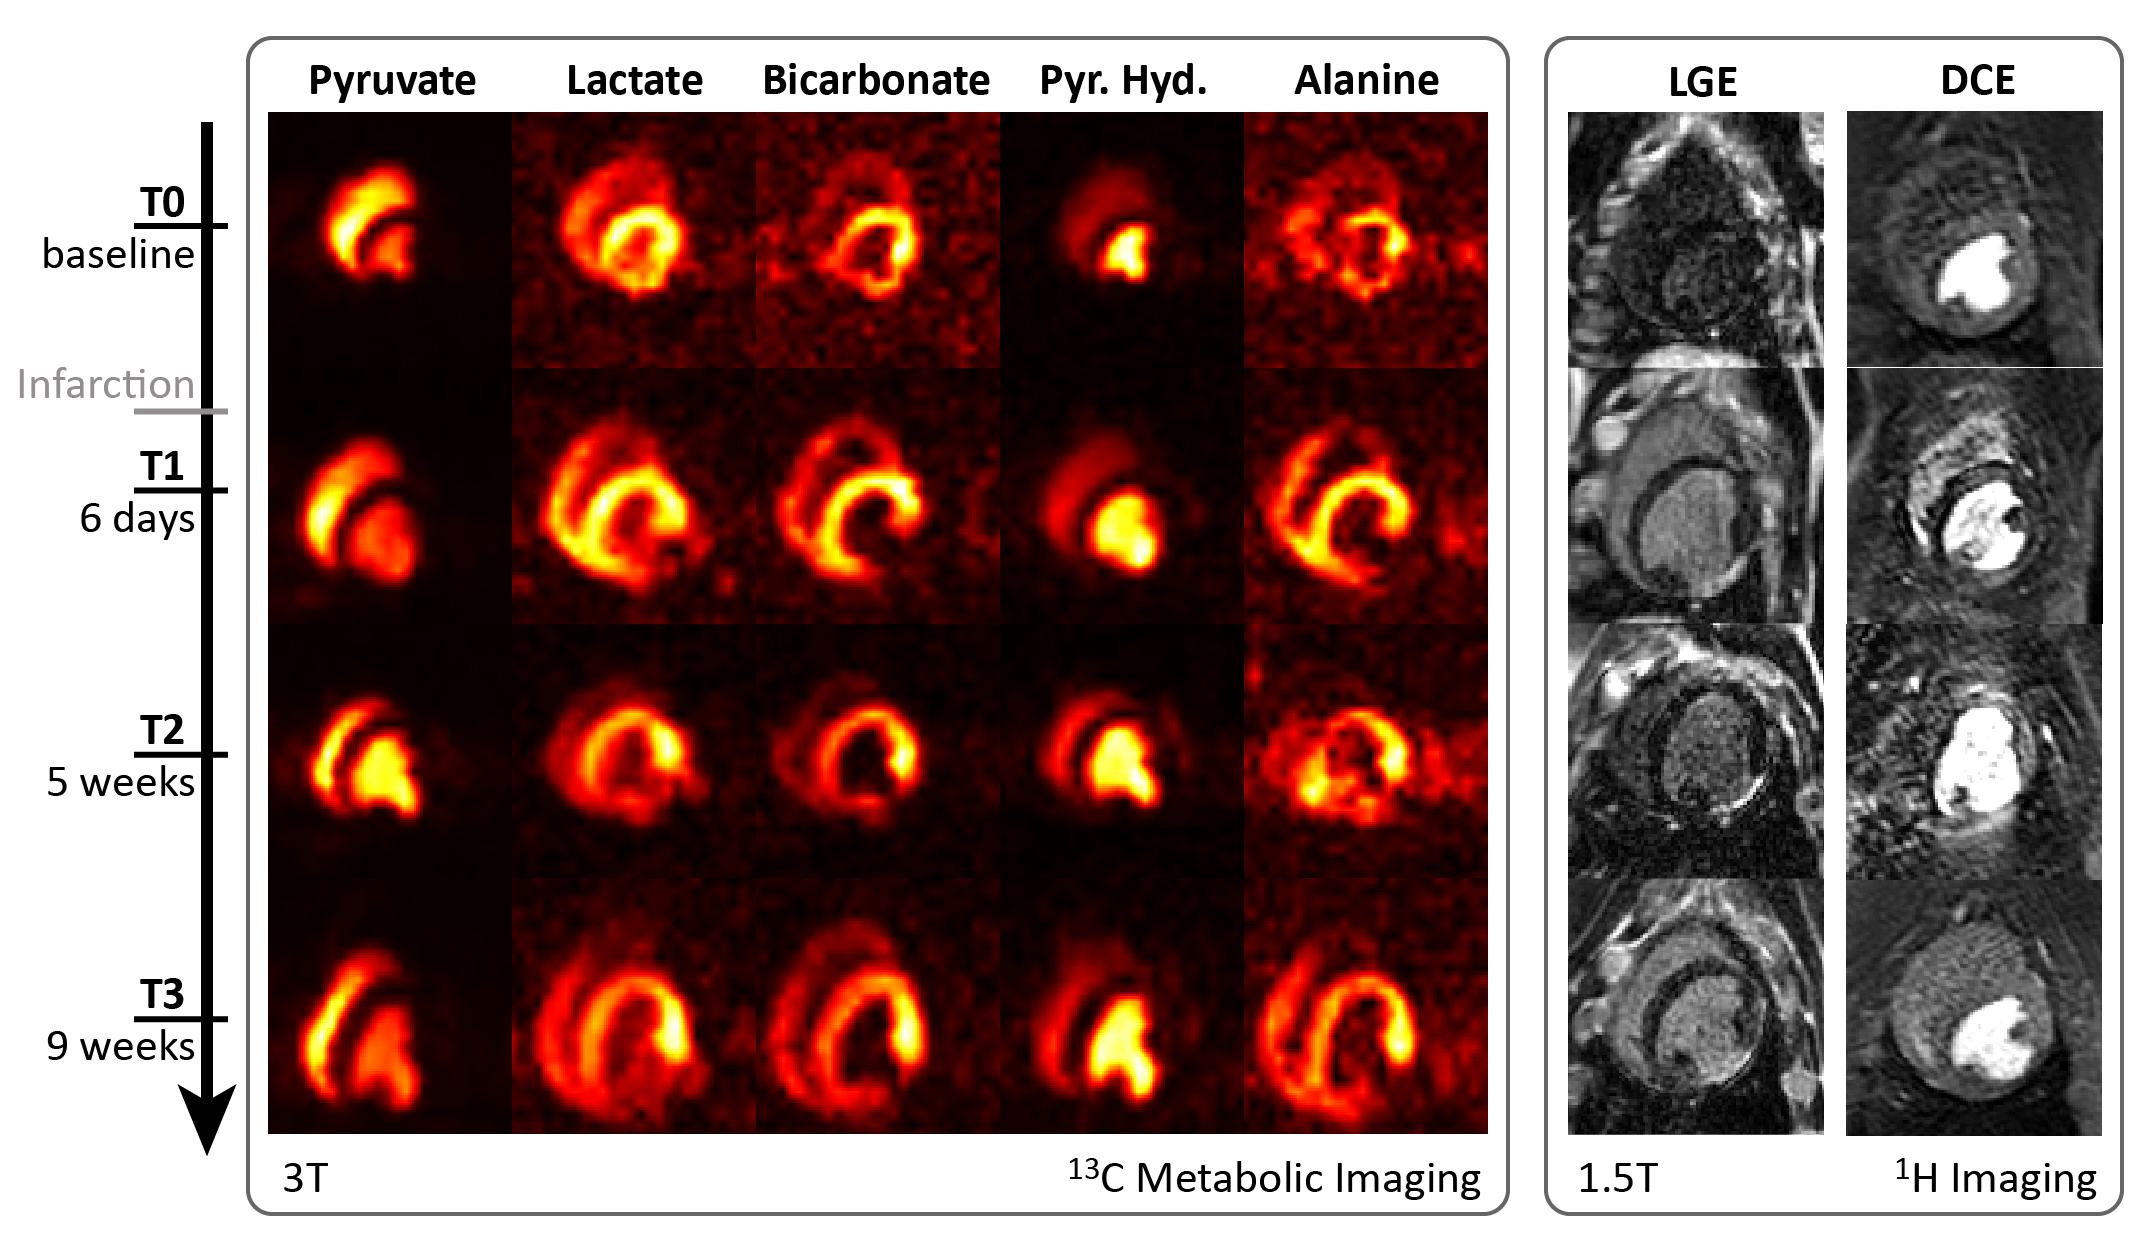
Visual comparison of [13C]-metabolite images with [1H]-Gadolinium enhanced images over the course of the experiment is shown in Fig-3. The infarcted region in the mid inferior lateral area of the myocardium is clearly depicted and in excellent spatial alignment in both modalities.
Representative dynamic image series with corresponding time curves are shown in Fig-4. Decreased bicarbonate signal was observed in all subjects 1-week post-infarction. Peak SNR per image frame was 5.3±0.8, 5.7±0.7 and 123±52 for bicarbonate, lactate and pyruvate, respectively.
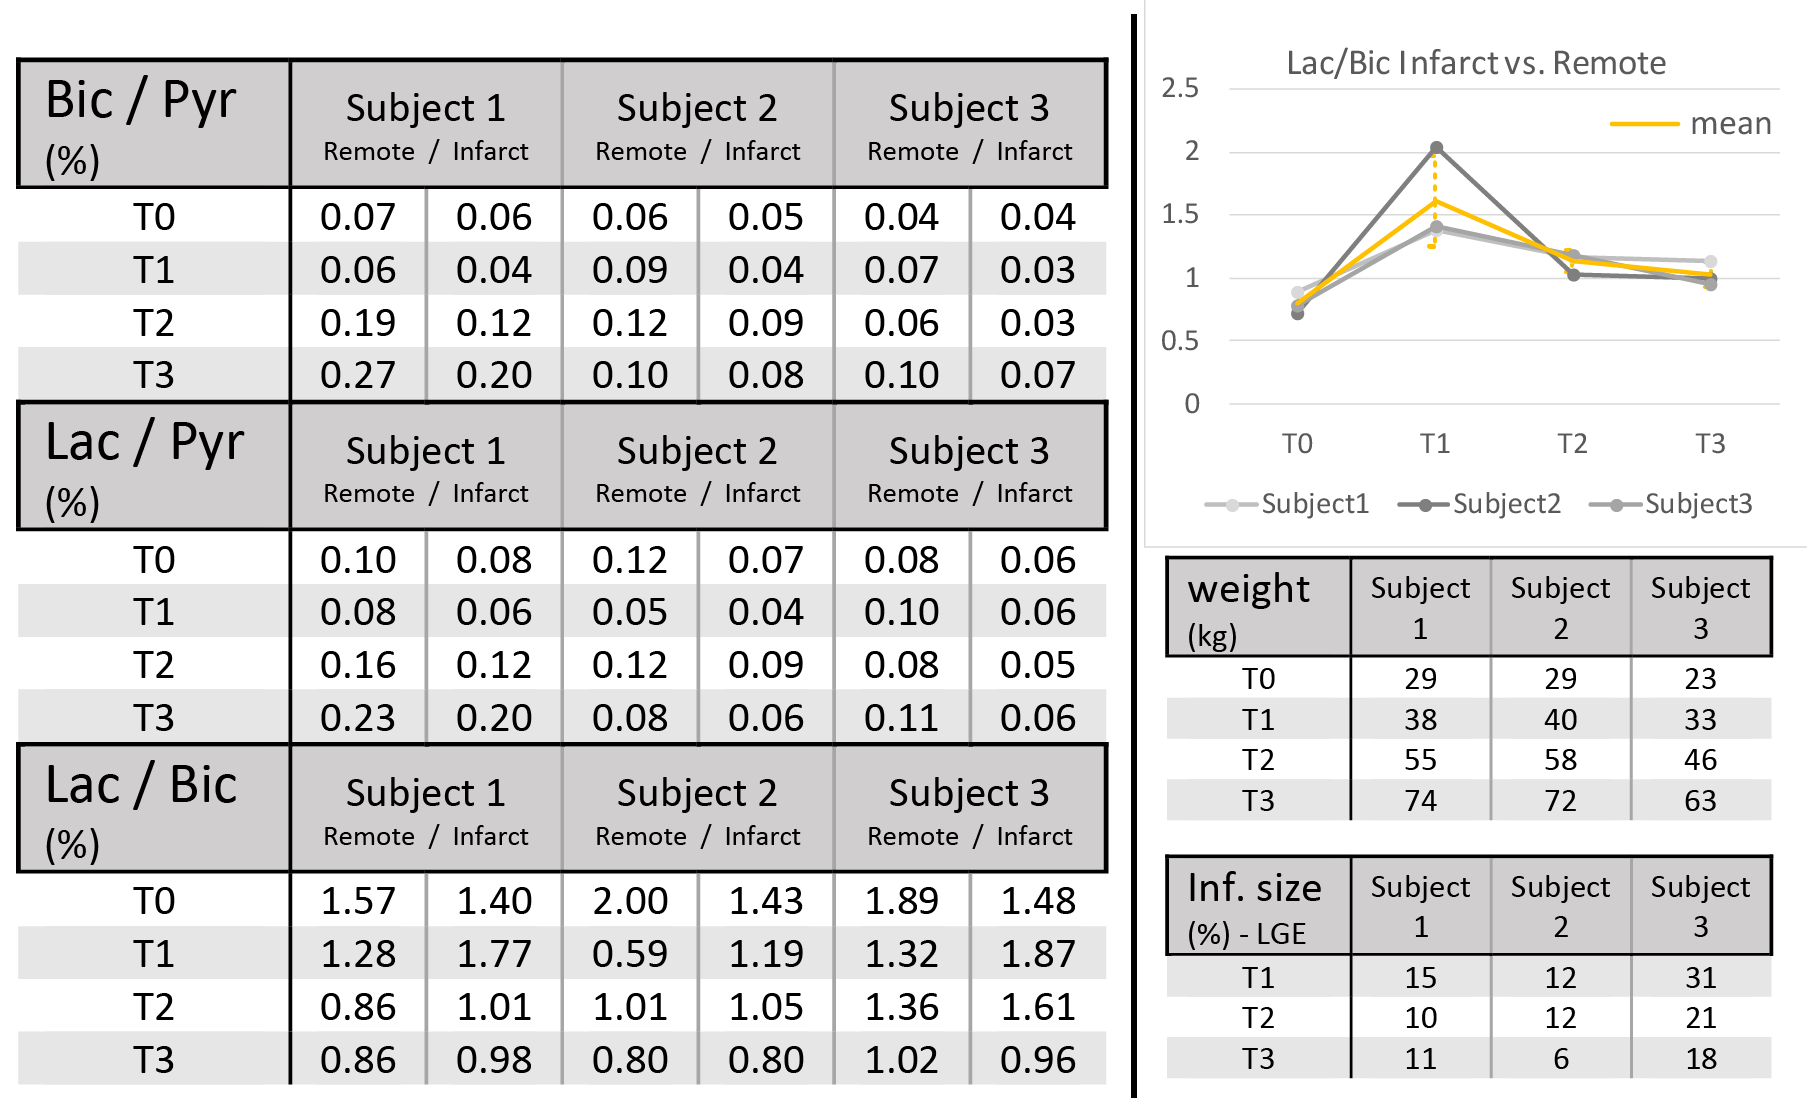
Preliminary results of the longitudinal study are presented in Fig-5. At day #6 post-infarction, the lactate-to-bicarbonate ratio in the infarcted area is elevated in all subjects and normalizes at later time points. A general trend towards higher bicarbonate-to-pyruvate with higher body mass (Fig-5) is meanwhile observed.
Discussion
The high spatial and temporal fidelity of the acquired hyperpolarized metabolic maps is considered promising with respect to advanced analysis such as kinetic modelling of cardiac metabolism, augmentation with other proton based techniques and towards robust protocols in upcoming human trials.
While the initial data presented herein as part of an ongoing study does not allow final conclusions, the preliminary findings show that following the fate of the infarcted myocardium longitudinally with hyperpolarized [1-13C]-pyruvate holds potential to reveal metabolic adaptation processes that do not present in models of acute infarction.
Acknowledgements
This work was supported by the Molecular Imaging Network Zurich (MINZ) and a grant of the Swiss National Science Foundation.References
1. Rider OJ, Tyler DJ. Clinical implications of cardiac hyperpolarized magnetic resonance imaging. J Cardiovasc Magn Reson. 2013;15:93. doi:10.1186/1532-429X-15-93.
2. Lau AZ, Miller JJ, Robson MD, Tyler DJ. Simultaneous assessment of cardiac metabolism and perfusion using copolarized [1- 13C]pyruvate and 13C-urea. Magn Reson Med. 2017;77:151–8. doi:10.1002/mrm.26106.
3. O h-Ici D, Wespi P, Busch J, Wissmann L, Krajewski M, Weiss K, et al. Hyperpolarized Metabolic MR Imaging of Acute Myocardial Changes and Recovery after Ischemia-Reperfusion in a Small-Animal Model. Radiology. 2016;278:742–51. doi:10.1148/radiol.2015151332.
4. Golman K, Petersson JS, Magnusson P, Johansson E, Akeson P, Chai C-M, et al. Cardiac metabolism measured noninvasively by hyperpolarized 13C MRI. Magn Reson Med. 2008;59:1005–13. doi:10.1002/mrm.21460.
5. Cunningham CH, Lau JYC, Chen AP, Geraghty BJ, Perks WJ, Roifman I, et al. Hyperpolarized 13C Metabolic MRI of the Human Heart: Initial Experience. Circ Res. 2016;119:1177–82. doi:10.1161/CIRCRESAHA.116.309769.
6. Epelman S, Liu PP, Mann DL. Role of innate and adaptive immune mechanisms in cardiac injury and repair. Nat Rev Immunol. 2015;15:117–29. doi:10.1038/nri3800.
7. Fernández-Jiménez R, Barreiro-Pérez M, Martin-García A, Sánchez-González J, Agüero J, Galán-Arriola C, et al. Dynamic edematous response of the human heart to myocardial infarction: Implications for assessing myocardial area at risk and salvage. Circulation. 2017;136:1288–300.
8. Schroeder MA, Cochlin LE, Heather LC, Clarke K, Radda GK, Tyler DJ. In vivo assessment of pyruvate dehydrogenase flux in the heart using hyperpolarized carbon-13 magnetic resonance. Proc Natl Acad Sci. 2008;105:12051–6. doi:10.1073/pnas.0805953105.
9. Lauritzen MH, Laustsen C, Butt SA, Magnusson P, Søgaard LV, Ardenkjær-Larsen JH, et al. Enhancing the [13C]bicarbonate signal in cardiac hyperpolarized [1-13C]pyruvate MRS studies by infusion of glucose, insulin and potassium. NMR Biomed. 2013;26:1496–500.
10. Hansen ESS, Tougaard RS, Nørlinger TS, Mikkelsen E, Nielsen PM, Bertelsen LB, et al. Imaging porcine cardiac substrate selection modulations by glucose, insulin and potassium intervention: A hyperpolarized [1-13C]pyruvate study. NMR Biomed. 2017;30:1–7.
11. Reeder SB, Wen Z, Yu H, Pineda AR, Gold GE, Markl M, et al. Multicoil Dixon chemical species separation with an iterative least-squares estimation method. Magn Reson Med. 2004;51:35–45. doi:10.1002/mrm.10675.
12. Busch J, Vishnevskiy V, Fuetterer M, Santelli C, von Deuster C, Peereboom SM, et al. Extended Signal Modelling and Regularization for Multi-Echo Hyperpolarized Metabolic Image Reconstruction. In: Proc. Intl. Soc. Mag. Reson. Med. 26. 2018. p. 3568.
13. Sigfridsson A, Weiss K, Wissmann L, Busch J, Krajewski M, Batel M, et al. Hybrid multiband excitation multiecho acquisition for hyperpolarized 13C spectroscopic imaging. Magn Reson Med. 2015;73:1713–7.
14. Hill DK, Orton MR, Mariotti E, Boult JKR, Panek R, Jafar M, et al. Model Free Approach to Kinetic Analysis of Real-Time Hyperpolarized 13C Magnetic Resonance Spectroscopy Data. PLoS One. 2013;8:e71996. doi:10.1371/journal.pone.0071996.
Figures