0717
Probing the metabolic response to acute renal injury in mice using multiple hyperpolarized 13C substrates.1Department of Pharmacology and Toxicology, University of Lausanne, Lausanne, Switzerland, 2Centre d'imagerie biomédicale (CIBM), Ecole polytechnique fédérale de Lausanne (EPFL), Lausanne, Switzerland, 3Department of Chemistry and Biotechnology, Graduate School of Engineering, The University of Tokyo, Tokyo, Japan, 4Laboratory for Functional and Metabolic Imaging (LIFMET), Ecole polytechnique fédérale de Lausanne (EPFL), Lausanne, Switzerland
Synopsis
Arginase-2 is upregulated following renal injury. This study used hyperpolarized pyruvate, arginine, citrulline and γ-glutamylglycine to probe changes in renal metabolism following ischemia-reperfusion in mice deficient in renal arginase-2. The kidney is a major site of arginine synthesis, and conversion of hyperpolarized citrulline to arginine can be detected, as can a signal consistent with argininosuccinate. While metabolic differences in mice lacking arginase-2 compared to controls are not readily apparent by this method, ischemia has a clear effect on several metabolite signals. Of the pyruvate metabolites, conversion to aspartate is significantly diminished, as is arginine and argininosuccinate production from citrulline.
Introduction
The straight proximal tubules of the kidney are in a low-oxygen environment and are susceptible to hypoxic injury. Arginase-2 (ARG2) expression in the S3 tubular section is elevated in response to various insults, and its absence can result in more severe acute injury and functional impairment.1 The motivation of this study was to understand better the metabolic effects of ARG2 post-injury.
Hyperpolarized [1-13C]pyruvate has been used to probe renal metabolic changes in several disease models.2-6 More recently, γ-glutamyl[1-13C]glycine, a substrate of γ-glutamyltransferase, has been proposed as a probe of renal function,7 and hyperpolarized [6-13C]arginine8 has been used to probe hepatic arginase activity.9 Here we present the preliminary results of experiments with these probes and renal ischemic-reperfusion injury in mice with a tubule-specific knockout of Arg2. Additionally, we introduce hyperpolarized [6-13C]citrulline as a probe of renal arginine synthesis.
Methods
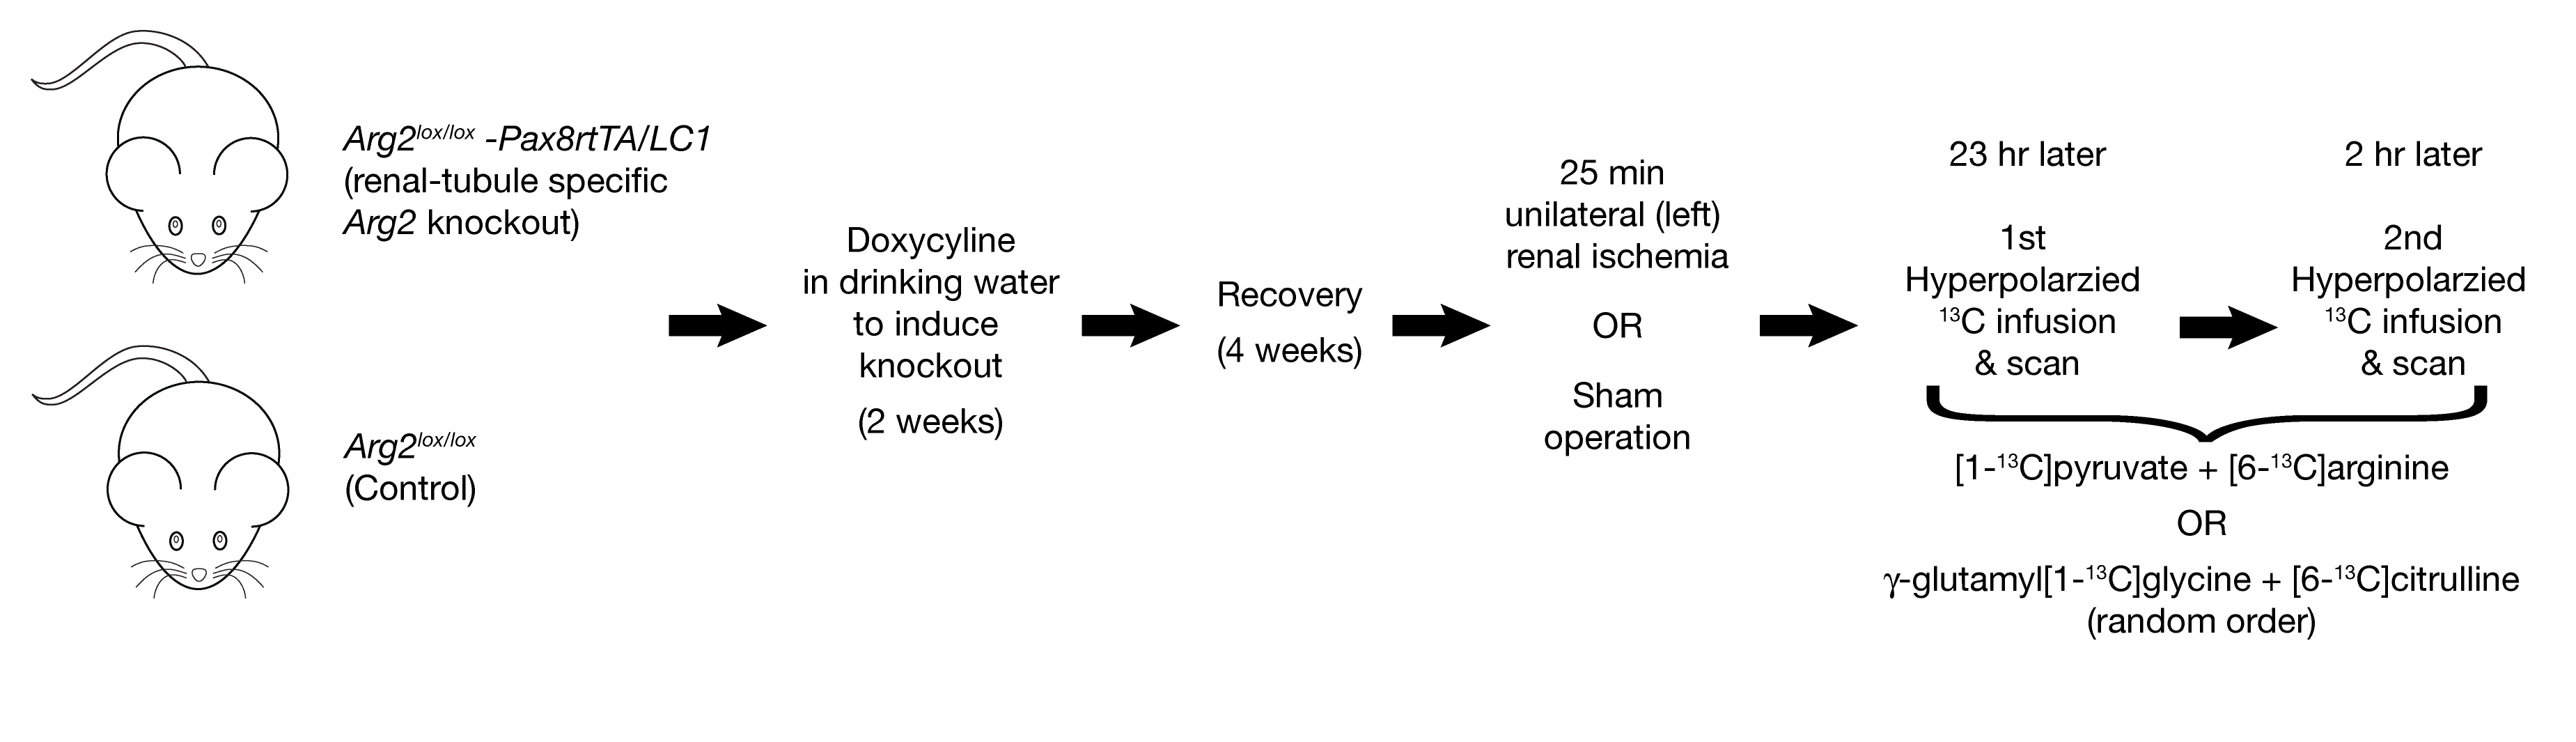
Transgenic mice: Arg2lox/lox-Pax8rtTA/LC1 mice (renal-tubule specific Arg2 knockout) and control Arg2lox/lox mice were treated at 8 weeks of age with doxycycline for two weeks to knock out the target gene.
Four weeks after treatment, the mice were anesthetized and the left kidney exposed. The renal hilum was clamped for 25 min (ischemia-reperfusion groups) or not clamped (sham groups). The kidney was then put back, and the muscle and incision stitched up.
The next day, mice were anesthetized with isoflurane and a femoral vein catheter was installed, followed by scanning 23-25 hours post-ischemia in a 9.4T horizontal scanner (Magnex/Varian) using a 1H/13C surface coil positioned over the left kidney.
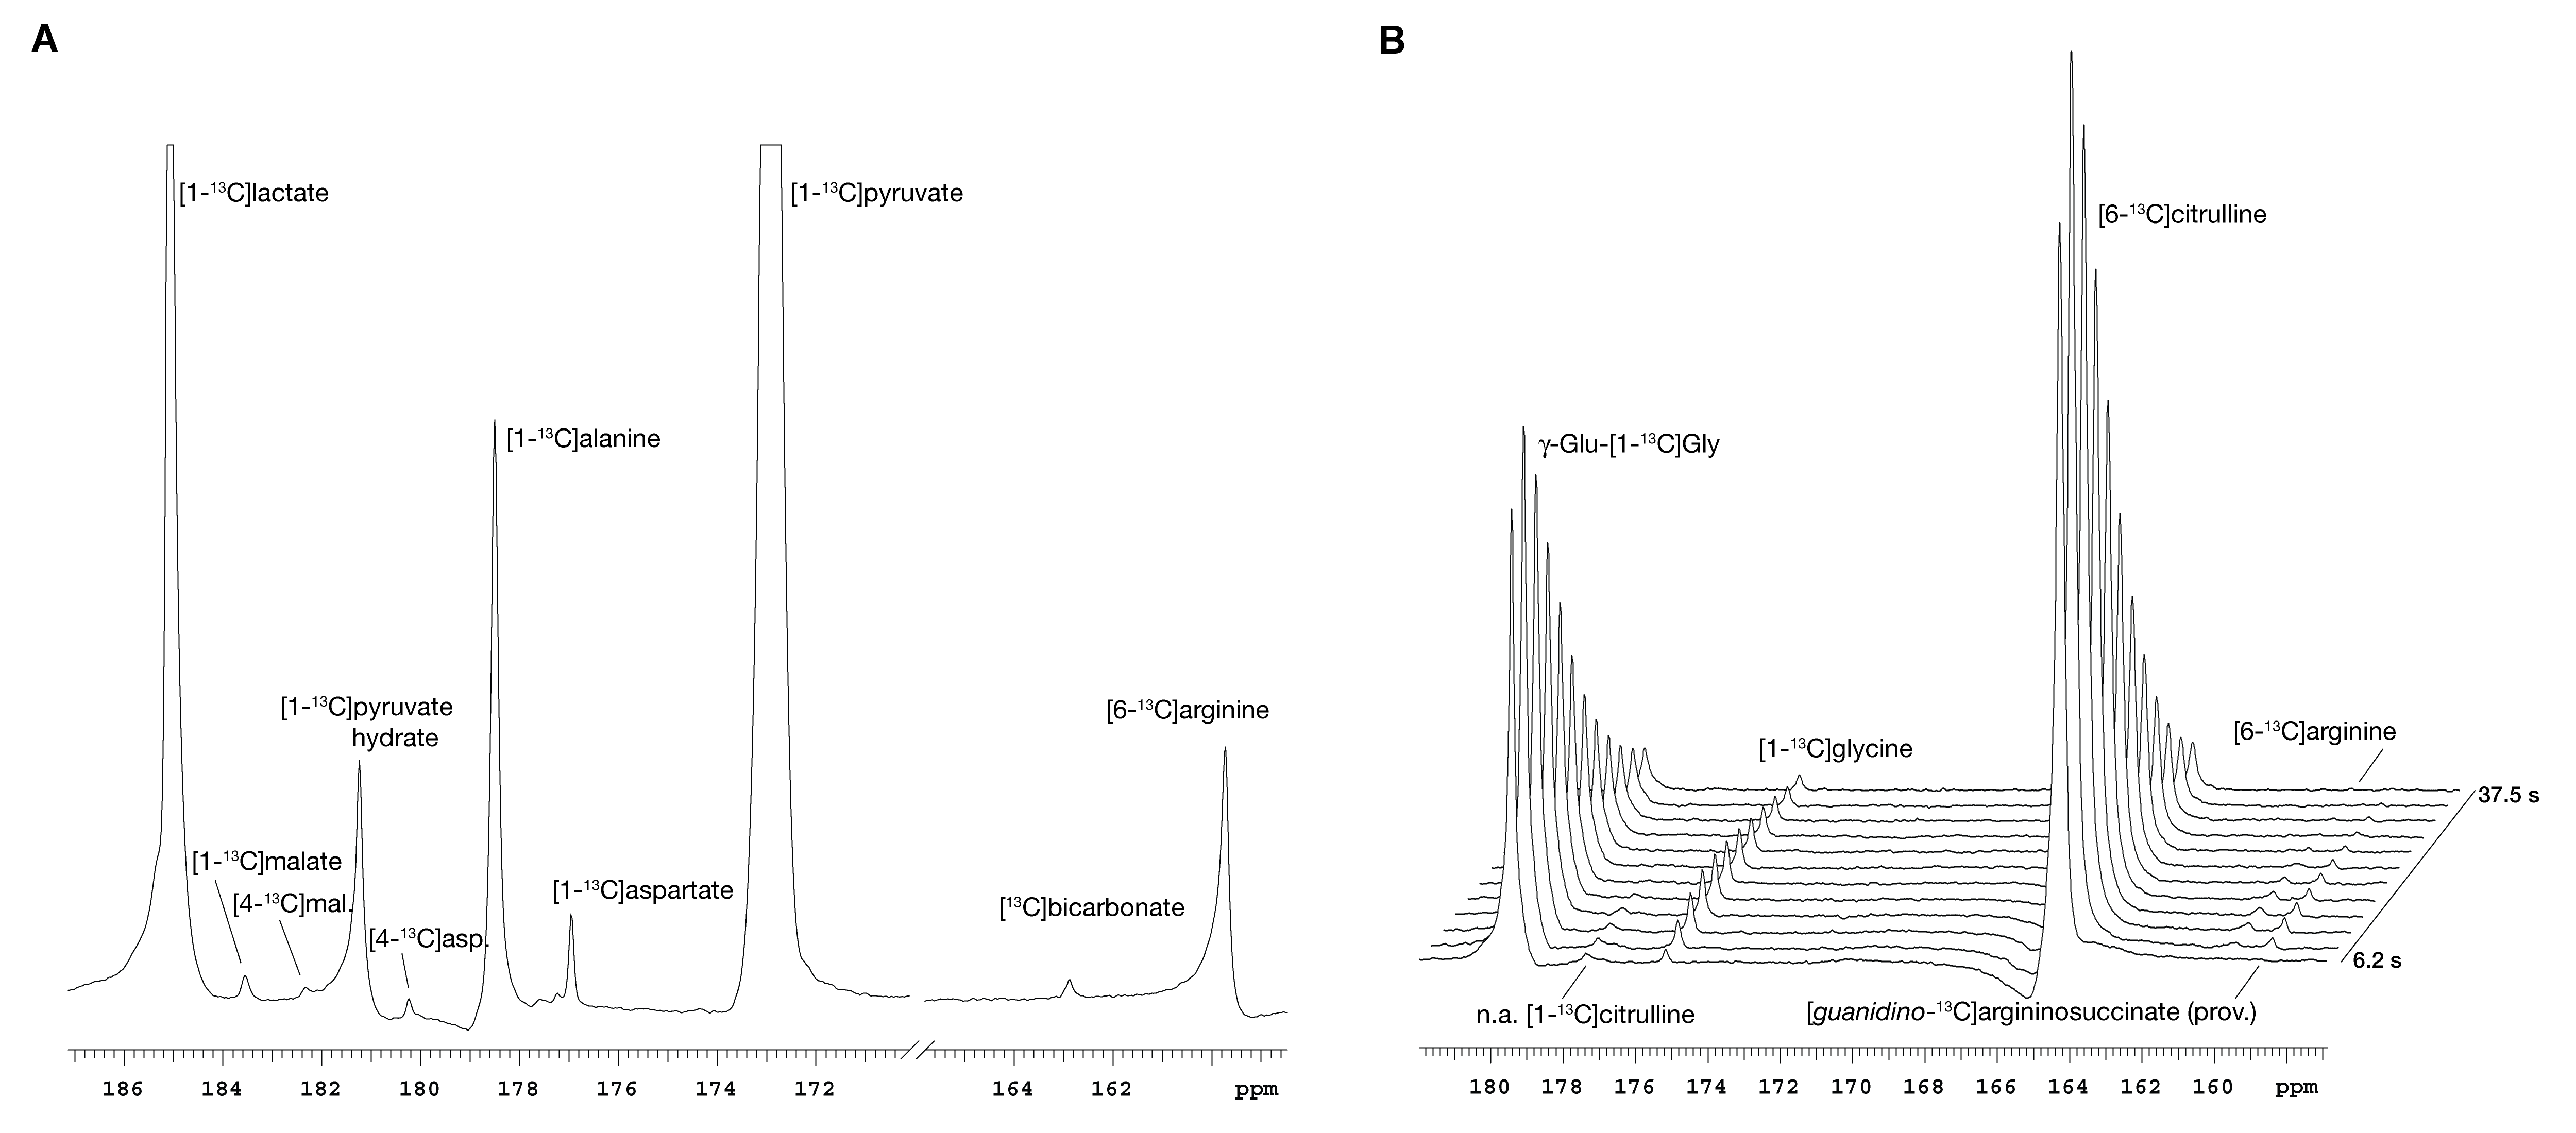
Hyperpolarized media formulation and preparation and data acquisition: [1-13C]pyruvic acid, [6-13C]arginine, γ-glutamyl[1-13C]glycine (GG) and [6-13C]citrulline were formulated individually with OX63 radical and co-polarized pairwise (Pyr+Arg & GG+Cit) in a custom-built 7T, 1.0K dissolution-DNP polarizer. Polarization order was randomized. After rapid dissolution and transfer, 330 µl of the solution was infused and a series of 40 respiration-gated (TR ~3s) pulse-acquire (BIR4-30º excitation) 13C NMR spectra were collected.
Data analysis: Spectral time courses and summed spectra were quantitated using Bayes (Washington University, St. Louis). Statistical significance was assessed in GraphPad Prism (v. 5.04) by ANOVA and Welch's t test. Error bars indicate standard deviation. Scanning and data workup were performed blinded without knowledge of the type of operation or the genotype.
Results
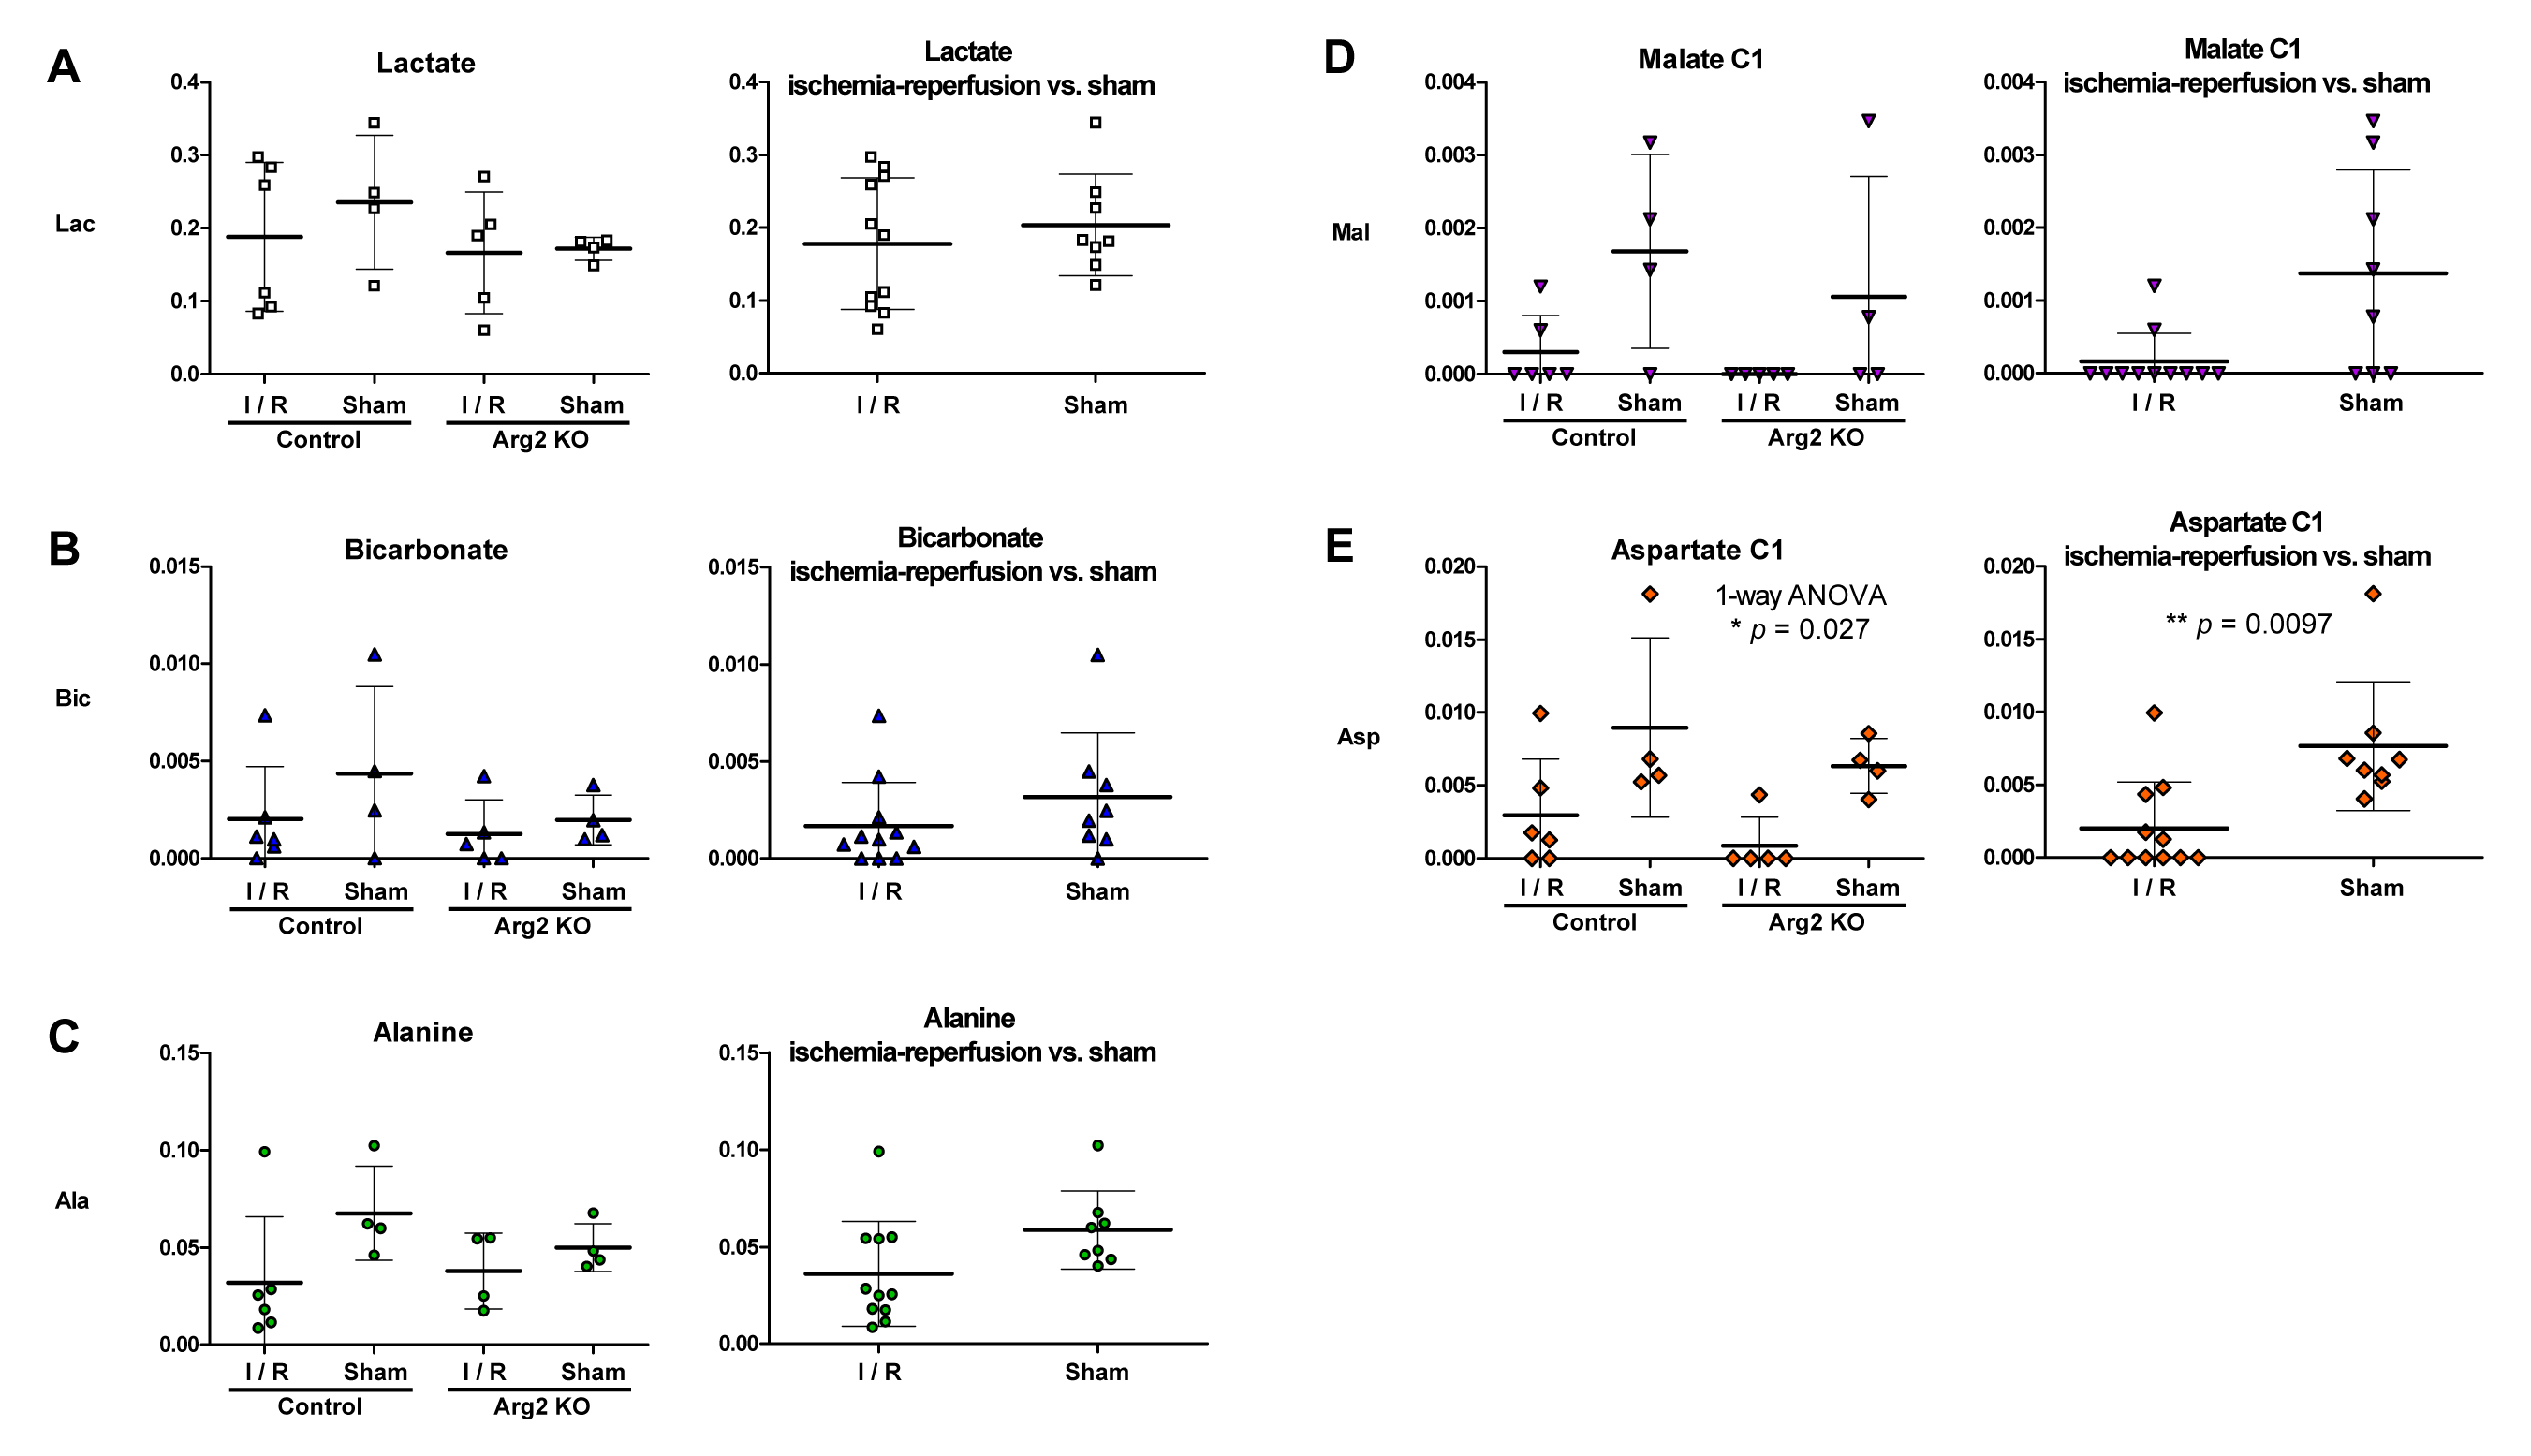
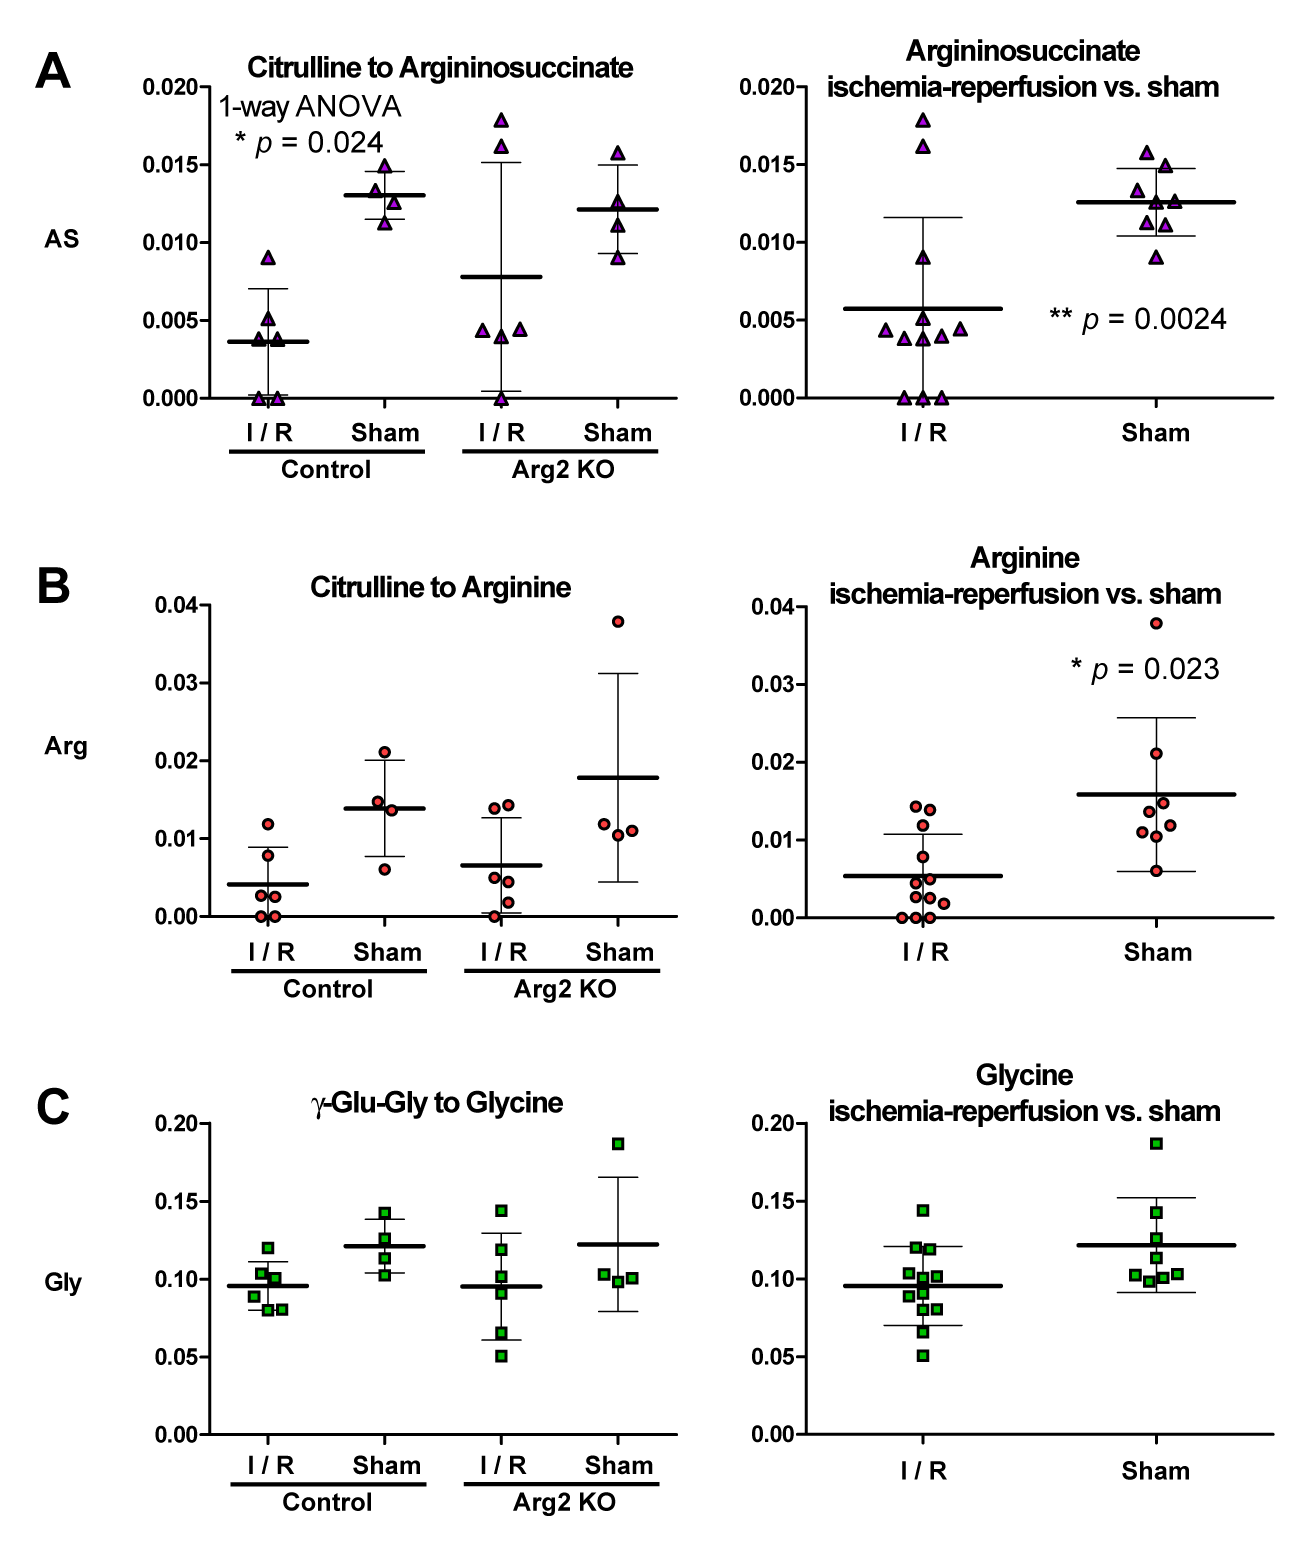
The protocol (Figure 1) was successfully completed in 18 mice and partially in 3. In addition to lactate, alanine and bicarbonate, the pyruvate metabolites malate (C1: 183.56ppm, C4: 182.34ppm) and aspartate (C1: 176.95ppm, C4: 180.24ppm) were also observed in some experiments (Figure 2A). Two metabolites of citrulline (164.24ppm), at 159.67ppm and 158.66ppm, were respectively assigned to arginine and, provisionally, argininosuccinate10 (Figure 2B). GG-to-glycine conversion by renal GGT was seen in every experiment. No conversion of arginine to urea by arginase was detected.
No significant differences were found between the groups for the lactate, bicarbonate and alanine or glycine signals, although the latter two tended to be lower following ischemia (Figure 3C, p = 0.053 alanine; Figure 4C, p = 0.065 glycine).
Similarly, the metabolites downstream of pyruvate carboxylase were on average lower following ischemia; however, the difference was significant for the aspartate C1 signal (p = 0.0097, p = 0.052 for malate C1) (Figure 3E).
Citrulline-to-arginine conversion in the ischemic groups averaged 34% of the sham-operated level (p = 0.023) (Figure 4B) and 45% for argininosuccinate (p = 0.0024) (Figure 4A).
Discussion
The renal metabolite signals varied substantially within the groups, particularly those subject to ischemia-reperfusion, limiting the sensitivity to detect small metabolic changes. Overall, clearer metabolic differences were apparent between the ischemic and sham-operated groups, while the subtler effects due of renal Arg2 deletion were not readily discerned. Unlike previous studies in mice with renal ischemia-reperfusion injury,5 no significantly lower bicarbonate/lactate and higher lactate/pyruvate ratios were observed in the current study, potentially due to the shorter ischemic and recovery periods. The lower hyperpolarized aspartate production post-ischemia suggests reduced flux through pyruvate carboxylase or lower glutamate levels, highlighting its potential as a metabolic marker.
The lack of detectable metabolism of hyperpolarized arginine underscores the challenges in using this technique to directly study arginase activity in the kidney, but the clearly lower conversion of citrulline to arginine post-ischemia indicates possible applications to measure renal arginine production.
Conclusions
A co-polarization based approach enables the parallel profiling of renal function and multiple metabolic pathways in the mouse kidney in vivo. The conversion of pyruvate to aspartate has potential as a marker of renal anapleurosis, while hyperpolarized citrulline is a promising substrate to measure renal arginine synthesis.Acknowledgements
This work was supported by a grant from the Swiss National Science Foundation (31003A_169493) to DF.References
1. Ansermet C, Centeno G, Rotman S, Barras J-L, Dattner N, Firsov D. Arginase-2 protects the kidney against ischemia-reperfusion injury. FASEB J. 2018;32(1_supplement):849.3-849.3.
2. Clatworthy MR, Kettunen MI, Hu D-E, et al. Magnetic resonance imaging with hyperpolarized [1,4-(13)C2]fumarate allows detection of early renal acute tubular necrosis. Proceedings of the National Academy of Sciences. 2012;109(33):13374-13379.
3. Laustsen C, Nielsen PM, Nørlinger TS, et al. Antioxidant treatment attenuates lactate production in diabetic nephropathy. Am J Physiol Renal Physiol. 2017;312(1):F192-F199.
4. Nielsen PM, Laustsen C, Bertelsen LB, et al. In situ lactate dehydrogenase activity - a novel renal cortical imaging biomarker of tubular injury? Am J Physiol Renal Physiol. September 2016:ajprenal.00561.2015.
5. Baligand C, Qin H, True-Yasaki A, et al. Hyperpolarized 13C magnetic resonance evaluation of renal ischemia reperfusion injury in a murine model. NMR Biomed. 2017;30(10):e3765.
6. Morze von C, Chang G-Y, Larson PEZ, et al. Detection of localized changes in the metabolism of hyperpolarized gluconeogenic precursors 13C-lactate and 13C-pyruvate in kidney and liver. Magn Reson Med. 2017;77(4):1429-1437.
7. Nishihara T, Yoshihara HAI, Nonaka H, et al. Direct Monitoring of γ‐Glutamyl Transpeptidase Activity In Vivo Using a Hyperpolarized 13C‐Labeled Molecular Probe. Angew Chem Int Ed. 2016;55(36):10626-10629.
8. Najac C, Chaumeil MM, Kohanbash G, et al. Detection of inflammatory cell function using (13)C magnetic resonance spectroscopy of hyperpolarized [6-(13)C]-arginine. Sci Rep. 2016;6:31397.
9. Yoshihara HAI, Firsov D, Cudalbu C, Gruetter R. Probing perturbed hepatic metabolism in bile-duct-ligated rats with hyperpolarized 13C pyruvate and arginine. Proc Intl Soc Mag Reson Med: Vol 26. 2018:0108.
10. Krawczyk H, Gryff-Keller A, Gradowska W, Duran M, Pronicka E. 13C NMR spectroscopy: a convenient tool for detection of argininosuccinic aciduria. J Pharmaceut Biomed. 2001;26(3):401-408.
Figures