0714
Analysis of feature importance in deep neural networks in psychiatric disorders using magnetic resonance imaging1QMENTA Inc, Barcelona, Spain, 2Bellvitge Biomedical Research Institute-IDIBELL, Barcelona, Spain, 3CIBERSAM, Madrid, Spain, 4School of Psychological Sciences and Monash Institute of Cognitive and Clinical Neurosciences, Melbourne, Australia, 5Department of Mental Health, Corporació Sanitaria Parc Taulí, Sabadell, Spain, 6CIBEROBN, Madrid, Spain
Synopsis
Current methods to
Purpose
Brain disorders have been traditionally diagnosed by their behavioral and cognitive manifestations rather than by objective biomarkers of alteration in brain structure and function1,2. This leads to considerable delays in establishing a first diagnosis and limits effective treatment selection or monitoring across treatment. Neural networks offer a method to automatically extract important features of data with a high level of abstraction3. In this work, two fully connected neural networks were trained to classify between healthy controls and patients suffering from six different mental illnesses. From the weights of these trained models, we identified regions of the brain that were most relevant for the classification task, and thus could contribute to potential imaging markers for more accurate diagnosis of psychiatric diseases.Methods
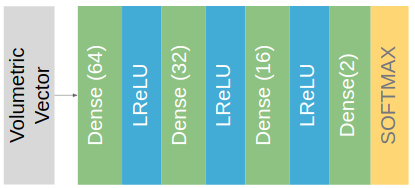
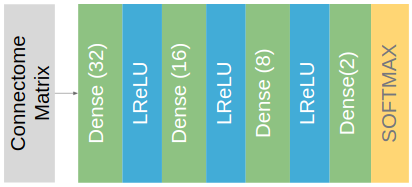
Data from patients suffering from different psychiatric disorders are used in this study (obesity, anorexia, binge eating disorder, major depression disorder, mild cognitive impairment, and obsessive compulsive disorder). T1 images and rs-fMRI were collected from different centers, using 3T Philips and 3T Siemens MRI scanner. We used a total of 143 healthy subjects and 137 patients from which, 196 were selected for training, 42 for validation and 42 for testing. We considered a cross-validation scenario of 10 different partitions.T1w images were processed with ANTs, computing the volume of 88 cortical and subcortical regions of the brain4. Moreover, we obtained a functional connectivity matrix from the preprocessed rs-fMRIs.In both types of data, a fully connected network of three layers with dropout and L1 and L2 regularization was used to train the model. The configuration for volumetric information was (Fig. 1): 64, 32 and 16 neurons for each layer, 50% dropout, and 1e −6 and 1e −4 for the regularization values respectively. While in the case of the connectivity matrix (Fig. 2), due to memory constraints the number of neurons was 32, 16 and 8 for each layer, a 60% of dropout and 1e-3 and 1e-1 as regularization values. Using the Fisher score, the neurons in each layer are ranked and the top 2, 5, 10 or 15 neurons are selected, subsequently, the top 2, 5, 10 and 15 neural network connection weights are traced through the network to identify the input features most influencing the neurons with the highest impact on the output decision. The full details of the method are detailed in [5].Results and discussion
Accuracy and F1-score for classification performance are given in Fig.3.
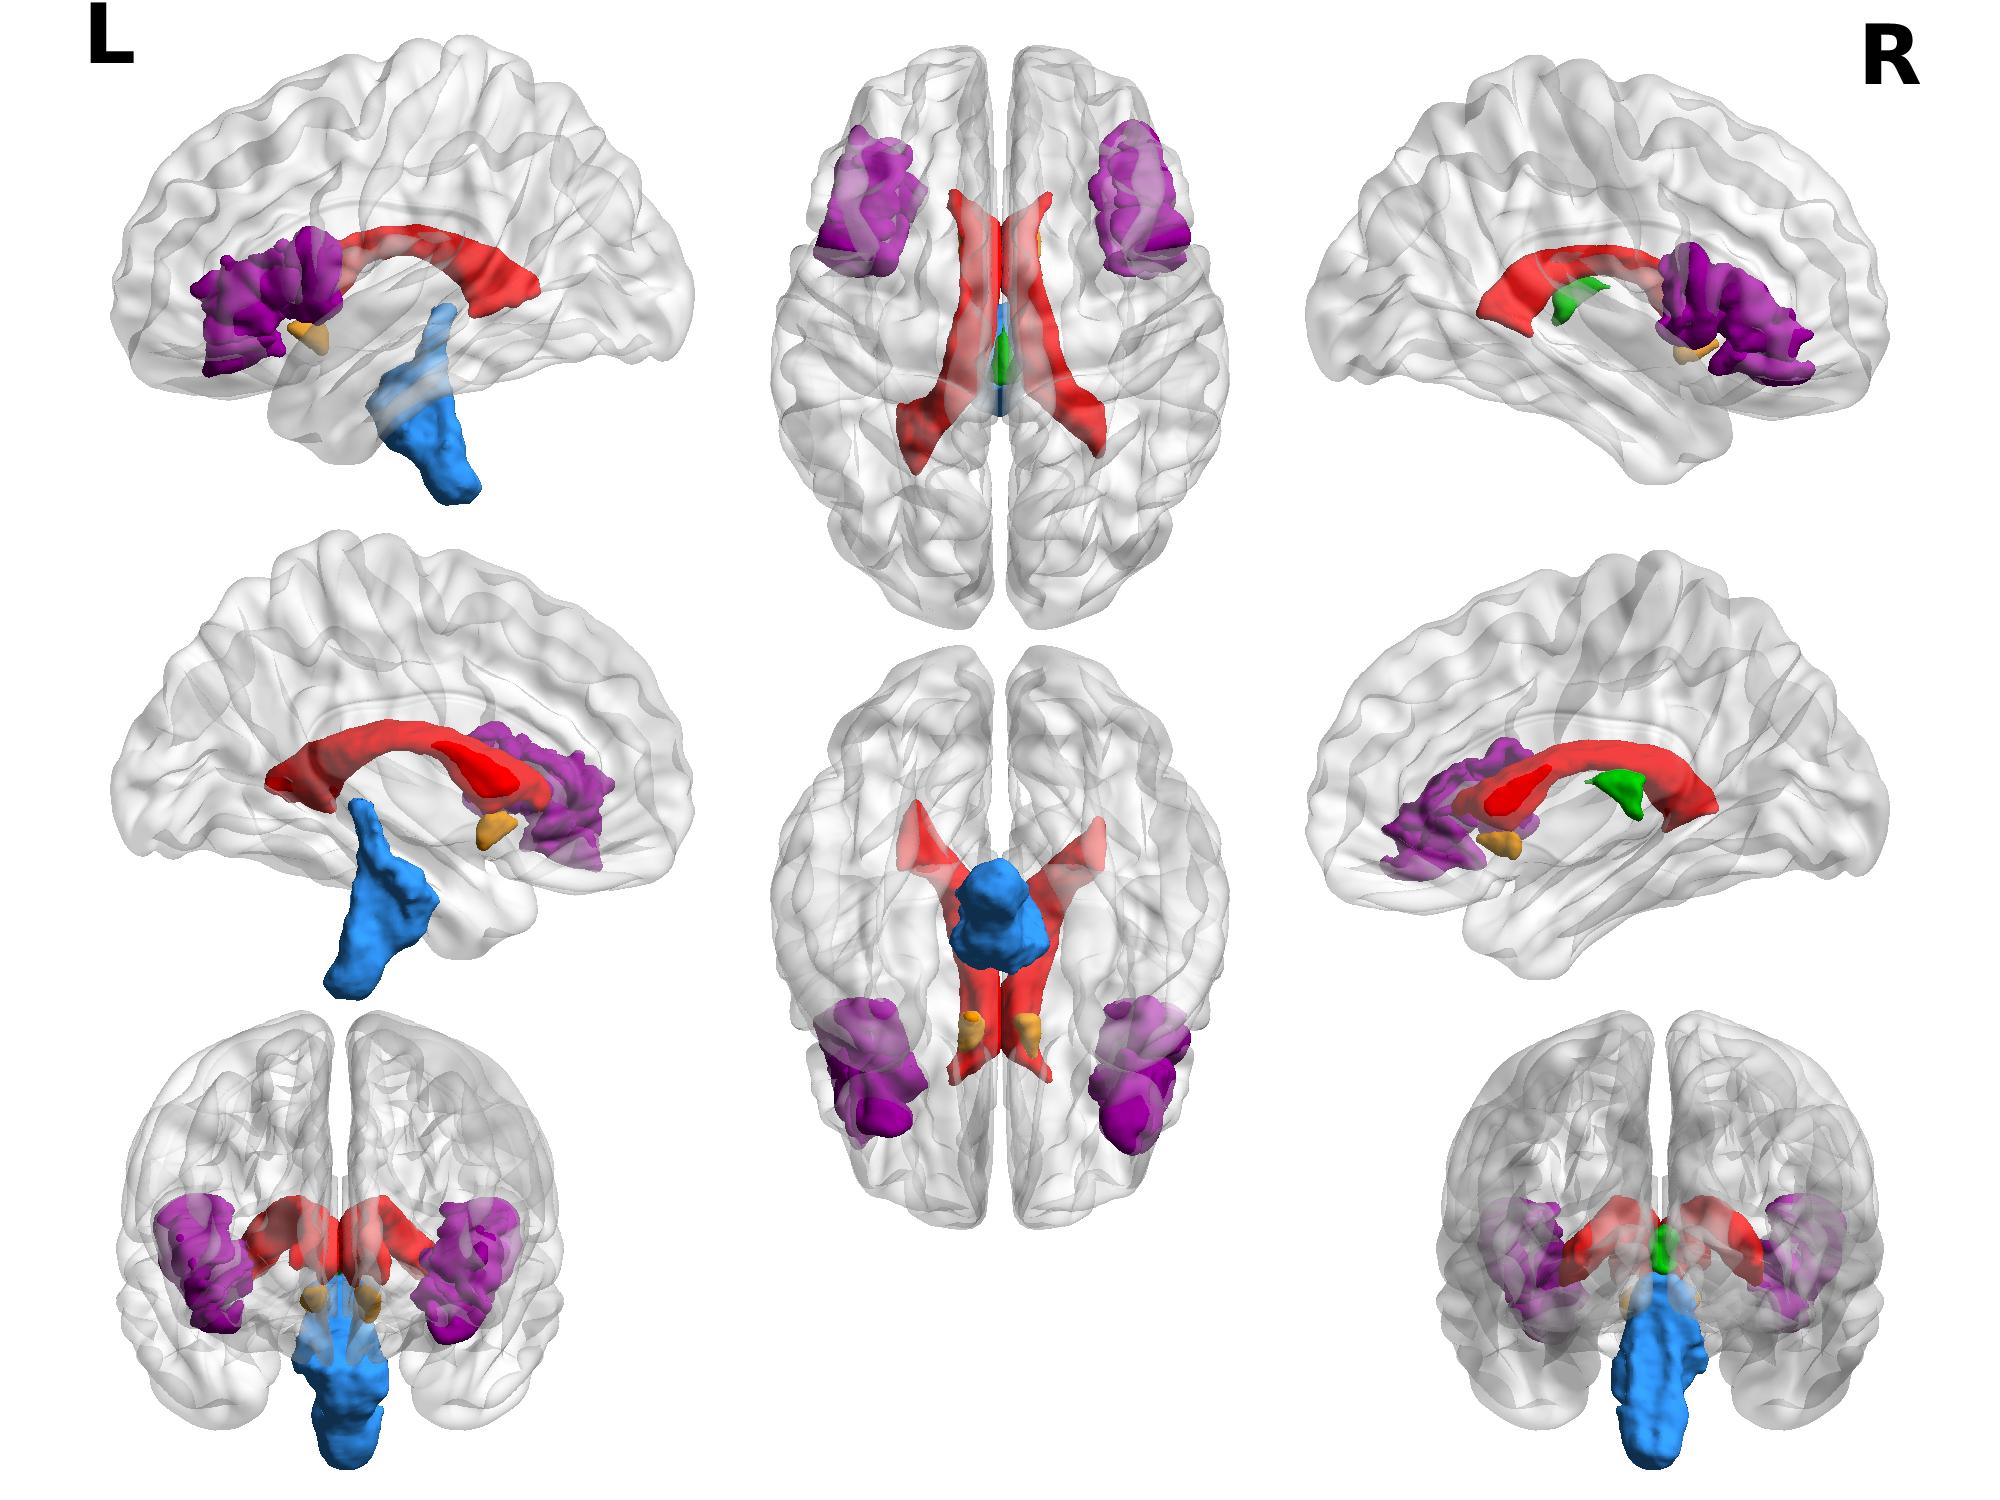
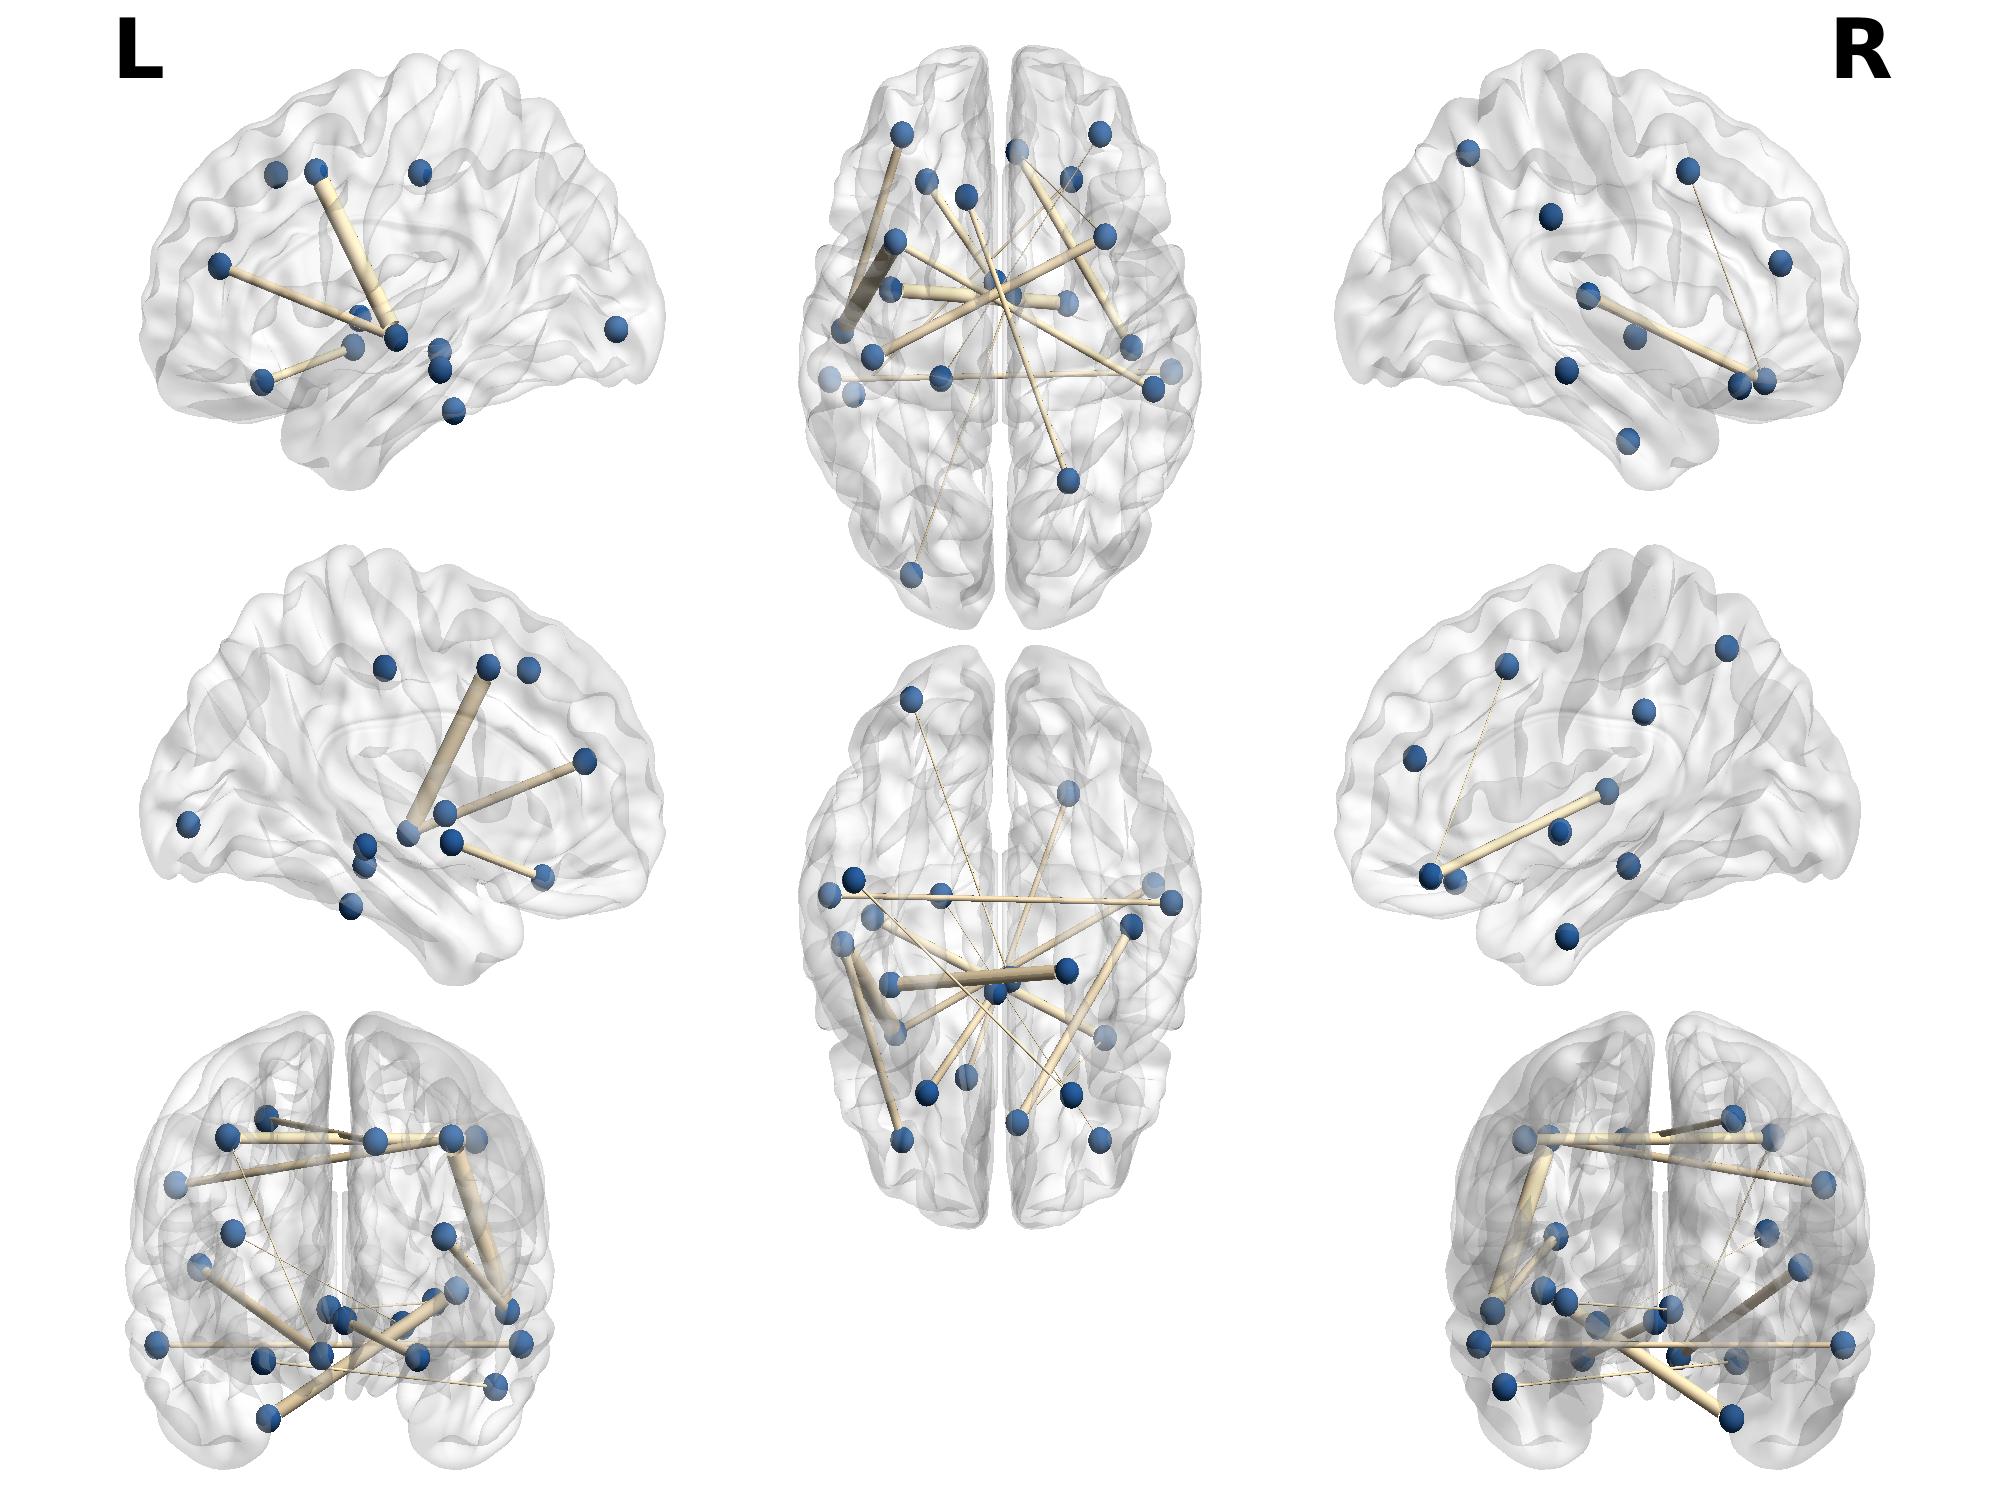
From the volumetric data, the top 5 most discriminative regions for the classification task were (Fig. 4): the Lateral Ventricles (LV), the Cerebrospinal Fluid (CSF), the Accumbens Area (AA), the Brain Stem (BS), and the Inferior Frontal Gyrus (IFG). We propose that alterations of the size of the lateral ventricles may be caused by alterations in the volume of the surrounding structures, namely regions of the basal ganglia (BG), a key factor in numerous mental disorders6. Regions of the BG, however, do not appear among the most discriminative features. We hypothesize this may be due to the diversity of our dataset with patients with different disorders, each affecting different BG structures, but all affecting the ventricles. Furthermore, the AA volume has been linked with apathy7, the BS volume with major depressive disorder8 and the IFG with human behavior and interpersonal interaction9. For fMRI data, the 5 most influential connections were (Fig. 5): Caudal/Rostral Middle Frontal gyrus, Superior Frontal gyrus, Medial/Lateral Orbitofrontal cortex, Superior Parietal lobe, Postcentral gyrus, Supramarginal, Superior/Middle/Inferior/Transverse Temporal gyrus, Hippocampus, Enthorinhal, Lateral Occipital, Insula, Accumbens area and Ventral/Globus Pallidum. These areas have been related to reward, attention, memory and processing of different senses and emotional control.When training our neural model, we are not introducing any prior information, whereas in the majority of classification studies10,11 regions have been manually selected with prior information, potentially introducing bias. Hence the neural network approach may find patterns in the data that are not interpretable by human eye and may identify brain regions possibly missed in the alternative approaches.
Conclusion
We have shown that DL allows the identification of brain regions important to classification of psychiatric disorders, by interpreting weight parameters of the trained model, without applying bias from prior information. In this work, several brain regions related to psychiatric disorders were identified as the most discriminative to the trained models, and subjects were classified with an accuracy of 64%. Future work will utilise larger datasets separated into specific conditions and will include structural connectivity information derived from diffusion weighted MRI.Acknowledgements
No acknowledgement found.References
- Balodis, I. M., Kober, H., Worhunsky, P. D., White, M. A., Stevens, M. C., Pearlson, G. D., Sinha, R., Grilo, C. M., and Potenza, M. N. (2013). Monetary reward processing in obese individuals with and without binge eating disorder. Biological psychiatry, 73(9):877–886.
- Baxter, L. R. (1992). Neuroimaging studies of obsessive compulsive disorder. Psychiatric Clinics of North America.
- Vieira, S., Pinaya, W. H., and Mechelli, A. (2017). Using deep learning to investigate the neuroimaging correlates of psychiatric and neurological disorders: Methods and applications. Neuroscience & Biobehavioral Reviews, 74:58–75.
- Avants, B.B., Tustison, N.J., Wu, J. et al. (2011) Neuroinform 9: 381.
- Kim, J., Calhoun, V. D., Shim, E., and Lee, J.-H. (2016). Deep neural network with weight sparsity control and pre-training extracts hierarchical features and enhances classification performance: Evidence from whole-brain resting-state functional connectivity patterns of schizophrenia. Neuroimage, 124:127–146.
- Ring, H. A., and J. Serra-Mestres. "Neuropsychiatry of the basal ganglia." Journal of Neurology, Neurosurgery & Psychiatry 72.1 (2002): 12-21.
- Carriere, Nicolas, et al. "Apathy in Parkinson's disease is associated with nucleus accumbens atrophy: a magnetic resonance imaging shape analysis." Movement disorders 29.7 (2014): 897-903.
- Han, K.-M., Kim, D., Sim, Y., Kang, J., Kim, A., Won, E., Tae, W.-S., and Ham, B.-J. (2017). Alterations in the brainstem volume of patients with major depressive disorder and their relationship with antidepressant treatment. Journal of affective disorders, 208:68–75.
- Hampshire, Adam, et al. "The role of the right inferior frontal gyrus: inhibition and attentional control." Neuroimage 50.3 (2010): 1313-1319.
- Nie, Xiuling, et al. "Subregional structural alterations in hippocampus and nucleus accumbens correlate with the clinical impairment in patients with Alzheimer’s disease clinical spectrum: parallel combining volume and vertex-based approach." Frontiers in neurology 8 (2017): 399.
- Pannekoek, J. Nienke, et al. "Resting-state functional connectivity abnormalities in limbic and salience networks in social anxiety disorder without comorbidity." European neuropsychopharmacology 23.3 (2013): 186-195.
- Xia, M., Wang, J., and He, Y. (2013). Brainnet viewer: a network visualization tool for human brain connectomics. PloS one, 8(7):e68910.
Figures