0704
Fatty kidney assessed by renal spectroscopy: a reproducibility study and clinical randomised controlled trial in type 2 diabetes1Radiology, Leiden University Medical Center, Leiden, Netherlands, 2Endocrinology, Leiden University Medical Center, Leiden, Netherlands, 3Radiology, Amsterdam Medical Center, Amsterdam, Netherlands, 4Nephrology, Leiden University Medical Center, Leiden, Netherlands
Synopsis
Renal steatosis is a potential biomarker for obesity-related renal disease and this has been suggested as underlying biological pathway of renoprotective effects of Liraglutide in type 2 diabetes (T2DM). Proton magnetic resonance spectroscopy (¹H-MRS) has the ability to non-invasively quantify triglycerides. We examined the reproducibility of ¹H-MRS in healthy volunteers, and explored the application in a clinical trial evaluating the differences in renal triglyceride content after 9-month treatment with liraglutide. We demonstrated that ¹H-MRS is a reproducible technique and comparison with healthy volunteers suggests increased renal triglycerides in T2DM. Renoprotective effects of liraglutide might be based on reduced renal triglycerides.
Introduction
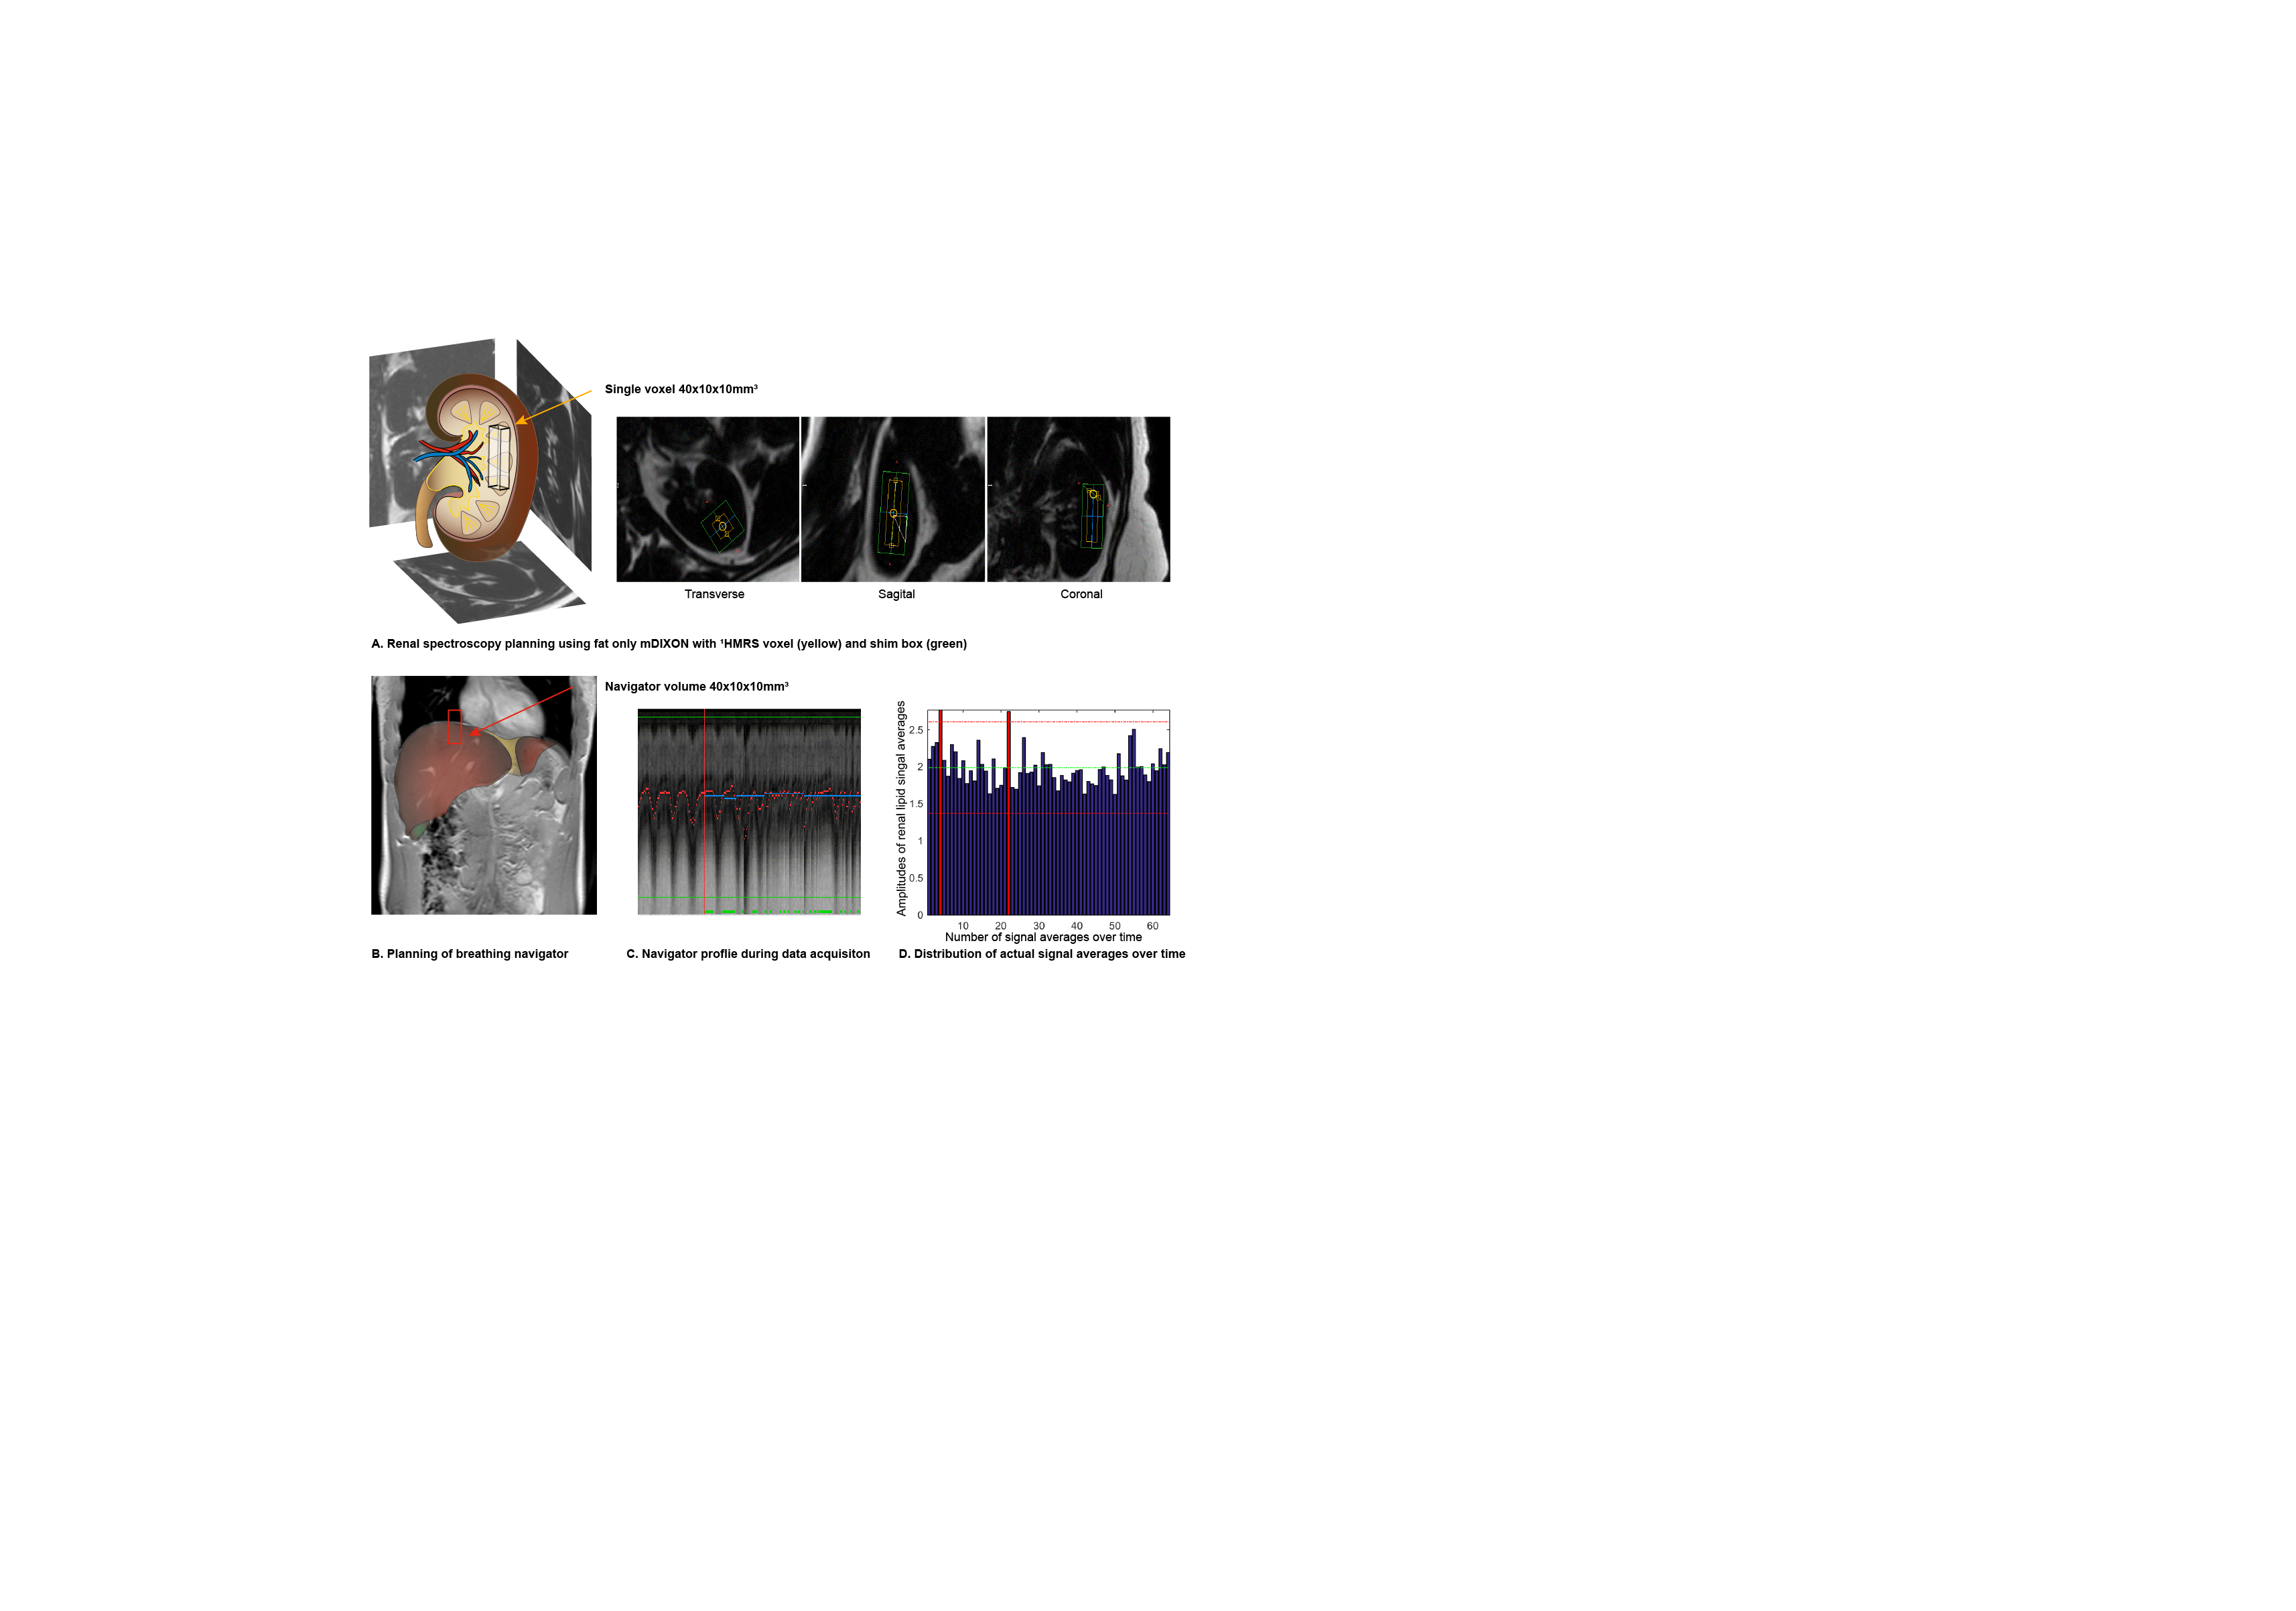
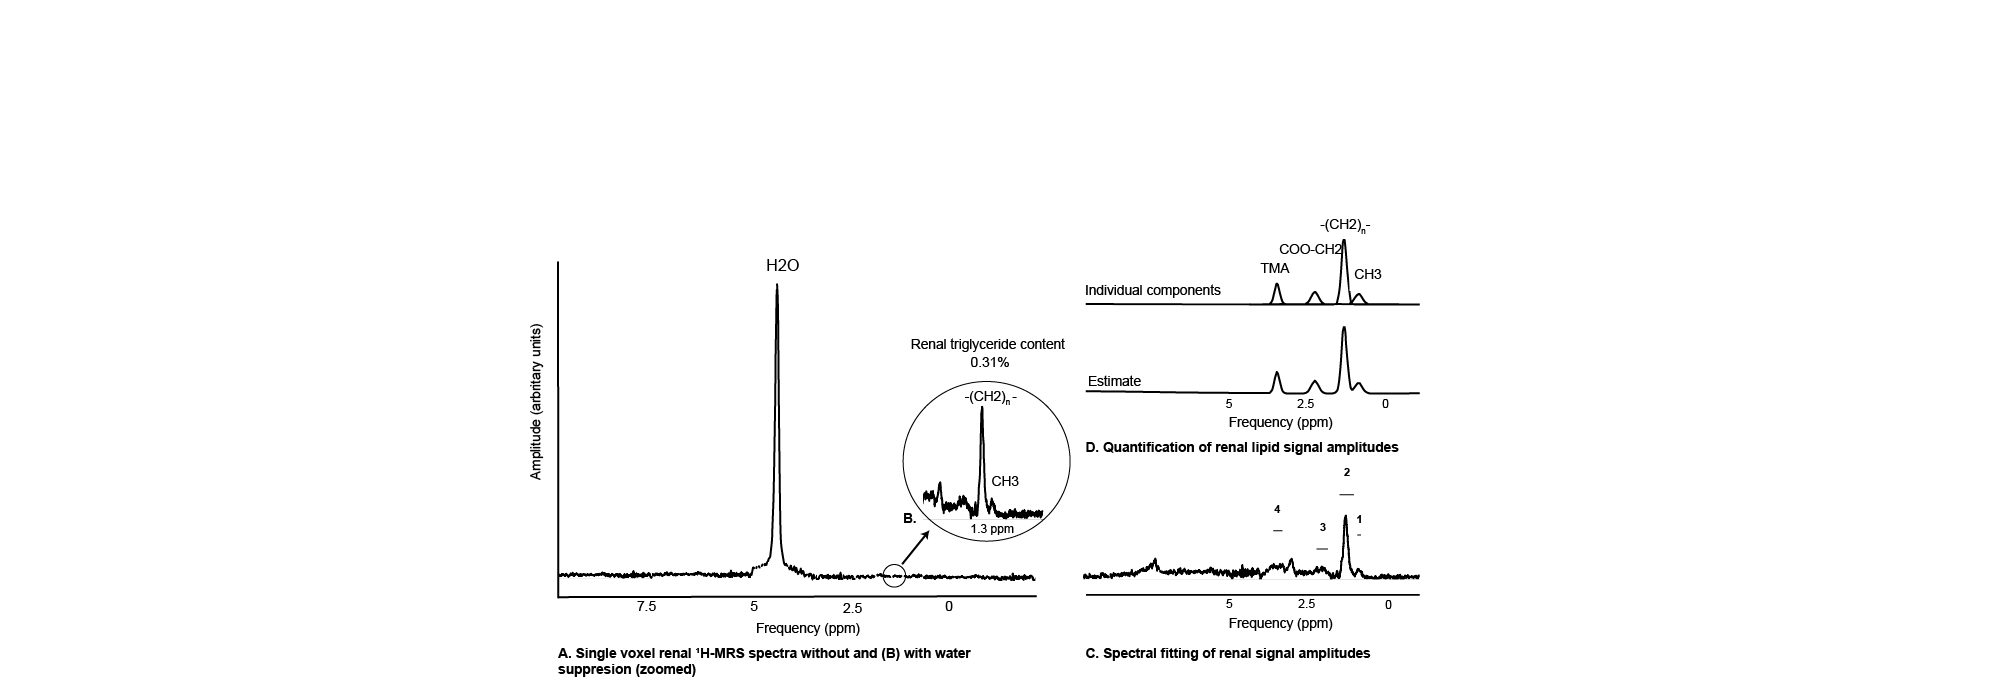
Renal steatosis (fatty kidney) is a potential biomarker for obesity-related renal disease (1), and proton magnetic resonance spectroscopy (¹H-MRS) has the ability to non-invasively quantify triglycerides based on tissue specific metabolite spectra (2). Renal triglyceride content (RTGC) measured using ¹H-MRS has previously been described at 1.5T (3) and was recently validated against gold-standard enzymatic assay in ex-vivo porcine kidneys (similar sized to human kidneys) (4). Previous preclinical studies have suggested that reduction of renal ectopic lipid accumulation might be the underlying biological pathway of the renoprotective effects associated with the novel antihyperglycemic agents such as Liraglutide in type 2 diabetes (T2DM) (5,6). We examined whether ¹H-MRS is a reproducible technique and we explored whether differences in renal triglyceride content were present after 9-month treatment with liraglutide versus metformin in T2DM patients.
Methods
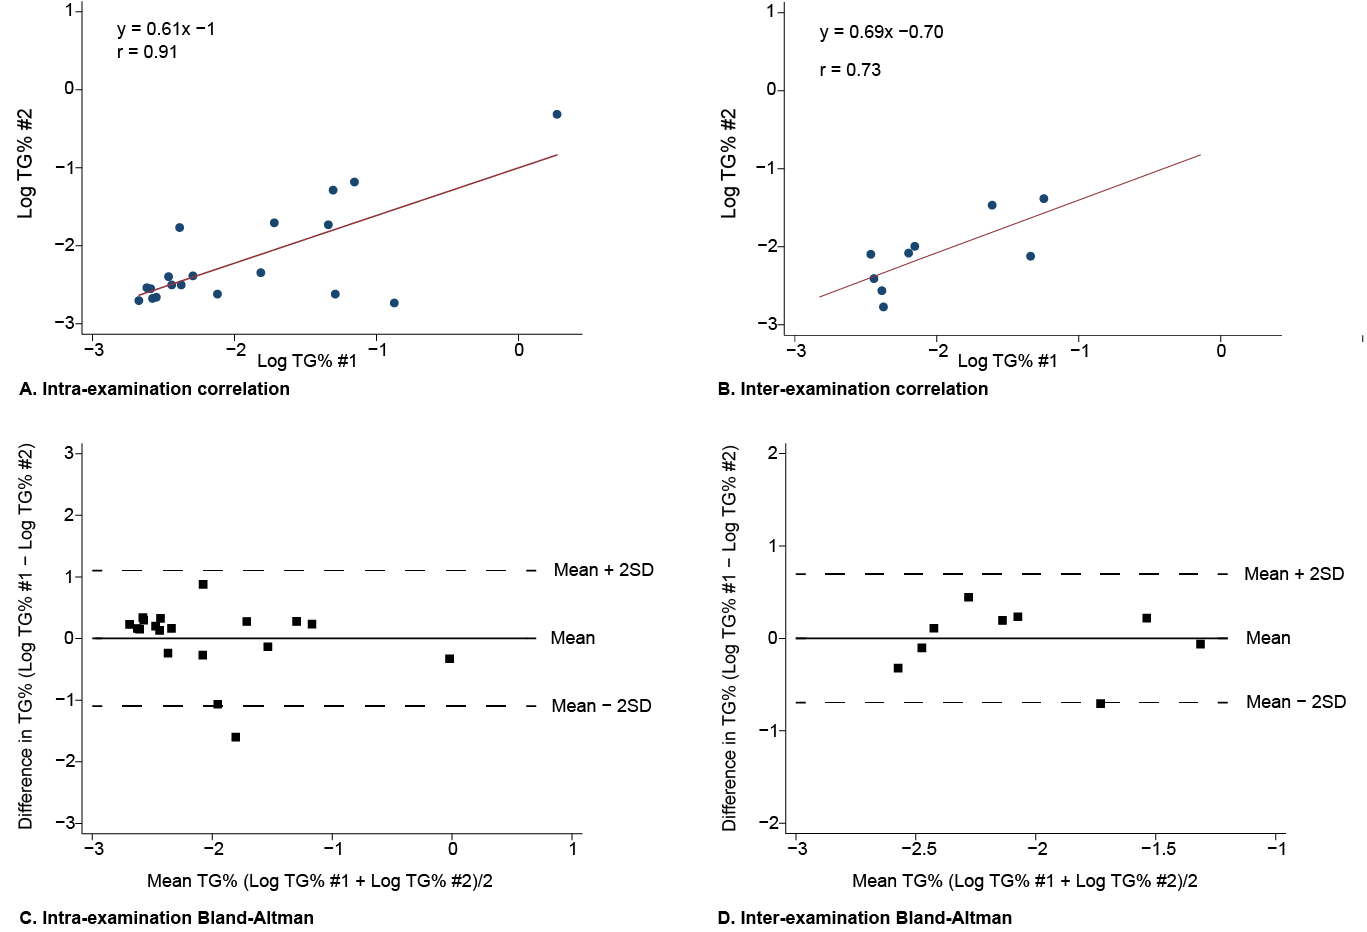
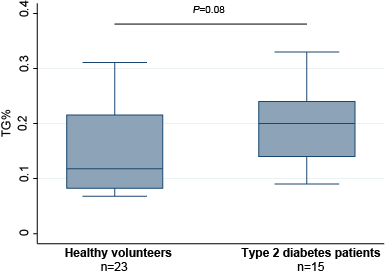
Part one: consisted of evaluation of intra- and inter-examination reproducibility of renal TG in twenty-three healthy volunteers (mean age 30.1 ± 13.4 years, mean BMI 22.8 ± 5.2 kg/m², 43% men). Intra-examination differences were obtained by repeating the ¹H-MRS measurement directly after the first ¹H-MRS without repositioning of the subject or changing surface coil and measurement volumes. Inter-examination variability was studied by repeating the scan protocol after removal and replacement of the subject in the magnet, and subsequent repositioning of body coil and measurement volumes. Reproducibility was determined using Pearson’s correlation and Bland-Altman-analyses. Differences in TG% between healthy volunteers and T2DM patients were assessed using the Mann-Whitney U test.
Part two: participants of the Magna Victoria study, a 9-month single center randomised clinical trial in type 2 diabetes mellitus patients (NCT01761318, NCT02660047) were included in the present study. Fifty patients T2DM were either randomised to liraglutide or metformine (as comparison to standard glucoregulation). Forty patients (mean age 59.5 ± 6.3 years, mean BMI 32.0 ± 3.6 kg/m², 58% men) successfully underwent 3T ¹H-MRS at baseline and after 9 months follow-up. Primary outcome was baseline change in renal triglyceride content.
Results
After logarithmic (log) transformation both intra-examination (r = 0.91, n = 19) and inter-examination (r = 0.73, n = 9) measurements of renal TG content were highly correlated with first renal TG measurements. Intra-examination and inter-examination limits of agreement of renal log TG% were respectively [-1.36%, +0.84%] and [-0.77%, +0.62%]. Overall median renal TG content was 0.12% [0.08, 0.22; 25th percentile, 75th percentile] in healthy volunteers and 0.20% [0.13, 0.22] in T2DM patients (P=0.08).
Overall median RTGC at baseline was 0.20% [0.08, 0.32] in T2DM patients randomised to liraglutide and 0.26% [0.08, 0.44] in the patients randomised to metformin. At 9-month follow up 29 T2DM patients had follow-up RTGC measurements available (7 participants no follow-up ¹H-MRS was performed and 4 measurements were excluded) with a median RTGC of 0.18% [0.08, 0.28]. The liraglutide group showed borderline significant mean differences in RTGC after 9-month glucoregulation (-0.04% [-0.10, 0.02]; P=0.050), while the metformin group showed non-significant mean differences (0.01% [-0.10,0.12]; P=0.33).
Conclusion
We demonstrated that 3T renal proton spectroscopy is a reproducible technique that could be used for evaluating the biomarker potential of renal triglyceride in obesity-related renal disease. Comparison of the healthy volunteers with T2DM patients suggests that renal might be increased in DM2. Our findings suggest that the renoprotective effects attributed to liraglutide might be based on reduced ectopic lipid accumulation in the kidney. Future studies are needed to assess whether renal proton spectroscopy could be of added value in clinical settings to evaluate patients at risk of obesity related renal disease, and whether ¹H-MRS could be cost-effectively used for treatment monitoring.Acknowledgements
No acknowledgement found.References
1. de Vries AP, Ruggenenti P, Ruan XZ, et al. Fatty kidney: emerging role of ectopic lipid in obesity-related renal disease. Lancet Diabetes Endocrinol. 2014;2(5):417-26.
2. Thomas EL, Hamilton G, Patel N, et al. Hepatic triglyceride content and its relation to body adiposity: a magnetic resonance imaging and proton magnetic resonance spectroscopy study. Gut. 2005;54(1):122-7.
3. Hammer S, de Vries AP, de Heer P, et al. Metabolic imaging of human kidney triglyceride content: reproducibility of proton magnetic resonance spectroscopy. PLoS One. 2013;8(4):e62209.
4. Jonker JT, de Heer P, Engelse MA, et al. Metabolic imaging of fatty kidney in diabesity: validation and dietary intervention. Nephrol Dial Transplant. 2017;33(2):224-230.
5. Wang C, Li L, Liu S, et al. GLP-1 receptor agonist ameliorates obesity-induced chronic kidney injury via restoring renal metabolism homeostasis. PLoS One 2018; 13: e0193473.
6. Mann JFE, Ørsted DD, Brown-Frandsen K, et al. Liraglutide and Renal Outcomes in Type 2 Diabetes. N Engl J Med 2017; 377: 839–48.
Figures