0700
MRI radiomics features for characterization of RCC subtypes1Translational and Molecular Imaging Institute, Icahn School of Medicine at Mount Sinai, New York, NY, United States, 2Department of Radiology, Universidad de los Andes, Santiago, Chile, 3Department of Radiology, Icahn School of Medicine at Mount Sinai, New York, NY, United States, 4Department of Urology, Icahn School of Medicine at Mount Sinai, New York, NY, United States
Synopsis
The goal of this study was to evaluate the use of quantitative radiomics features from contrast-enhanced MRI in differentiating common subtypes of solid renal cell carcinomas (RCCs). We found that several radiomics features were associated with common subtypes of RCC. Thus, radiomics features may help in the diagnosis of histologic subtypes of RCC.
Introduction
Renal cell carcinoma (RCC) is the most common renal malignancy. Clear cell RCC (ccRCC) and papillary RCC (pRCC) being the most common accounting for 75% and 15% of cases respectively1. Treatment and outcome are affected by RCC histopathologic subtype, tumor grade, and TNM stage. Recent advances in radiomics have led to an interest in using CT and MRI as a noninvasive predictors of histopathologic features, overall survival, and treatment response 2,3. Imaging may be used to help differentiate subtypes of RCC 4, and also as a biomarker that would help in prognosis, treatment selection, and for predicting response to therapy 5. Herein we sought to evaluate the role of MRI based radiomics for the assessment of RCC subtypes.Methods
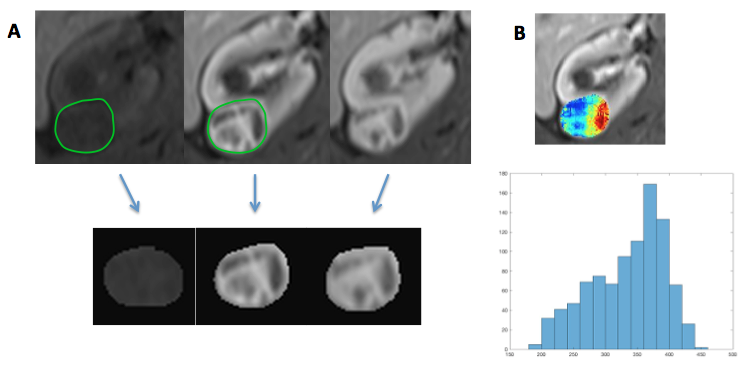
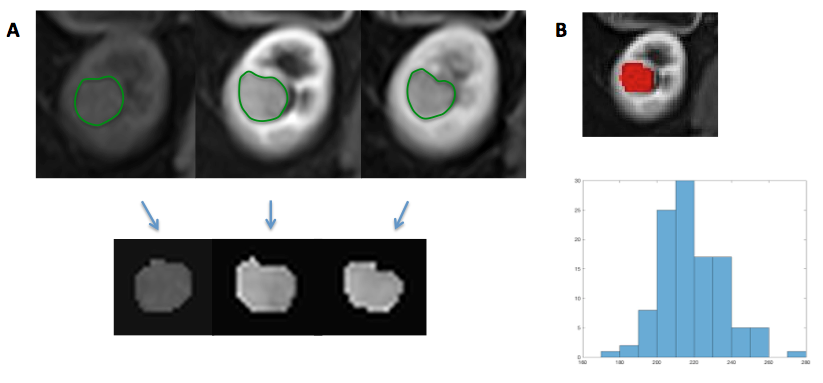
This IRB-approved retrospective single center study included patients with RCC that underwent MRI before total/partial nephrectomy between 06/2015-06/2018. One index lesion was analyzed per patient. Initially, regions of interest (ROIs) were manually drawn by a single observer on T1 pre-contrast, arterial phase (AP) and nephrographic phase (NP) post-contrast (Figures 2-3). Radiomics analysis quantified lesion characteristics in the ROIs using signal intensity histogram (mean, median, standard deviation, kurtosis, skewness) and Haralick texture features using MATLAB. Mann-Whitney U test was used to assess differences in radiomics features within subtypes of RCC and ROC analysis was employed to assess the diagnostic performance in differentiating ccRCC from other subtypes. In addition, the potential value of combinations of features for ccRCC diagnosis was assessed using logistic regression with stepwise selection of features that showed an area under the curve (AUC) > 0.8 in the ROC analysis.Results
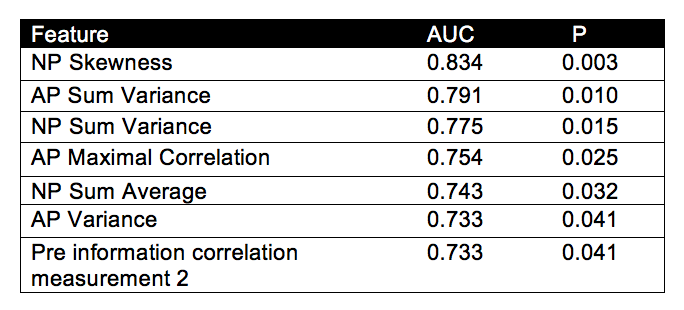
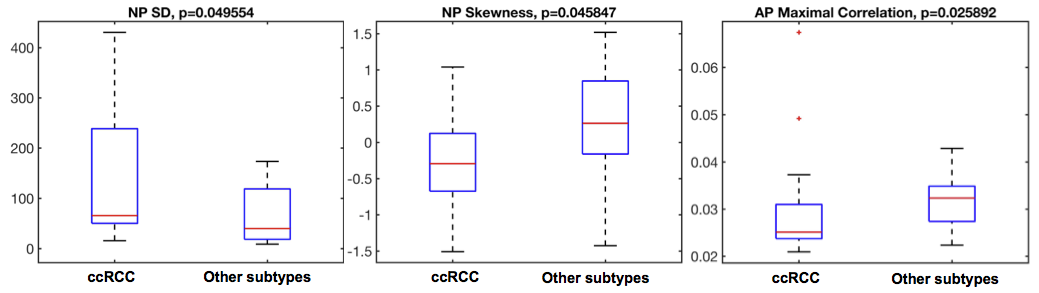
We initially report results in 37 solid RCCs out of 120 patients with renal neoplasms. Mean age was 55.3 years and 73% were males. Mean lesion size was 3.5 ± 2.5 cm (range 1.2 – 12.2 cm). There were 18 ccRCCs, 12 pRCCs and 8 other subtypes. We observed differences between ccRCC vs. other RCC subtypes using two histogram parameters (skewness and SD) at NP (p=0.045 and p=0.049, respectively; Figure 1), as well as in one texture feature (AP maximal correlation) (p=0.025; Figure 1). These same features were also found to be discriminant predictors in differentiating ccRCC from all other subtypes with an AUC of 0.696 for skewness (p=0.048), 0.699 for SD (p=0.044), and 0.722 for maximal correlation (p=0.025). Logistic regression with stepwise feature selection showed an AUC of 0.892 (p<0.001) when combining SD (pre-contrast and NP) and texture (sum variance) at NP for diagnosing ccRCC. When analyzing ccRCC vs. pRCC, we found differences in NP skewness (p=0.003) and 6 texture features (p<0.04; Table 1). NP skewness was the most significant independent predictor feature in differentiating ccRCC and pRCC with an AUC of 0.834 (p=0.003)Discussion and Conclusions
Our initial results show differences in histogram and texture features within RCC subtypes in pre-contrast, AP and NP. These results will be verified in a larger number of cases and by including other sequences such as DWI. In conclusion, MRI radiomics features may help in characterizing RCC subtypes.Acknowledgements
No acknowledgement found.References
1. Hirsch, M.S., Signoretti, S. & Dal Cin, P. Adult Renal Cell Carcinoma: A Review of Established Entities from Morphology to Molecular Genetics. Surg Pathol Clin 8, 587-621 (2015).
2. Lubner, M.G., Stabo, N., Abel, E.J., Del Rio, A.M. & Pickhardt, P.J. CT Textural Analysis of Large Primary Renal Cell Carcinomas: Pretreatment Tumor Heterogeneity Correlates With Histologic Findings and Clinical Outcomes. AJR Am J Roentgenol 207, 96-105 (2016).
3. Zhao, W., et al. Preoperative prediction of microvascular invasion of hepatocellular carcinoma with IVIM diffusion-weighted MR imaging and Gd-EOB-DTPA-enhanced MR imaging. PLoS One 13, e0197488 (2018).
4. Hoang, U.N., et al. Assessment of multiphasic contrast-enhanced MR textures in differentiating small renal mass subtypes. Abdom Radiol (NY) (2018).
5. Karlo, C.A., et al. Radiogenomics of clear cell renal cell carcinoma: associations between CT imaging features and mutations. Radiology 270, 464-471 (2014).
Figures