0699
Early Assessment of the Response of Esophageal Squamous Cell Carcinoma to Chemoradiotherapy by Intravoxel Incoherent Motion MRI1Department of Radiology, Drum Tower Hospital, School of Medicine, Nanjing University, Nanjing, China, 2Philips Healthcare, Shanghai, Shanghai, China
Synopsis
Twenty-three patients with esophageal squamous cell carcinoma (ESCC) underwent intravoxel incoherent motion (IVIM) MRI at four timepoints: pre, mid, end, and post-CRT to assess the value of IVIM parameters in the early assessment of treatment response to CRT. The parameters and their change percentages were compared between complete response (CR) and partial response (PR). ADC, f, %ADC, and %D at mid-CRT in CR group were significantly higher than those in the PR group. D combined with f and ADC had highest area under curve in identifying CR from PR. IVIM parameters proved useful in assessing response to definitive concurrent CRT.
INTRODUCTION
Since definitive concurrent chemoradiotherapy (CRT) is standard therapy for inoperable esophageal squamous cell carcinoma (ESCC), early evaluation of treatment response is crucial for patients and would be useful in assessing response, especially in patients with severe side effects.METHODS
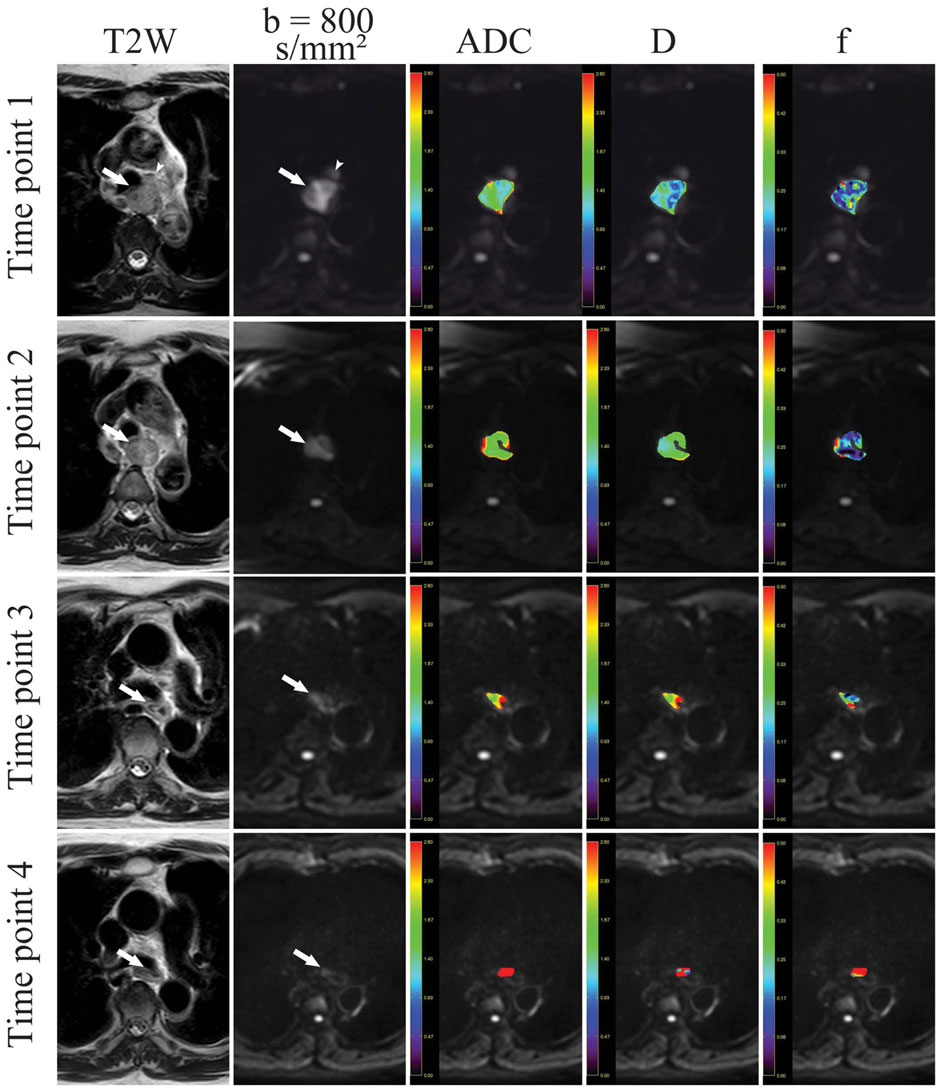
Twenty-three inoperable ESCC patients underwent intravoxel incoherent motion (IVIM) MRI. IVIM 3T MRI of nine b values (0, 25, 50, 75, 100, 150, 200, 500 and 800 s/mm2) was performed at four time points: pre-CRT (within 5 days before CRT), mid-CRT (2–3 weeks after the start of CRT), end-CRT (within 5 days after the end of CRT), and post-CRT (1 month after the end of CRT). IVIM-based parameters and ADC were analyzed independently by two radiologists and treatment response was assessed by the Response Evaluation Criteria in Solid Tumors (RECIST). Analyses of variance for repeated measurements were conducted to observe dynamic changes of IVIM-based parameters (D, f, and D*) and ADC during CRT. The parameters and their change percentages (Δ%) were compared between complete response (CR) and partial response (PR) by Mann–Whitney U-test. Diagnostic performance of parameters in predicting response was tested with receiver-operating characteristic curve analysis.RESULTS
ADC, D, and f increased significantly during CRT (P<0.001, <0.001, and 0.001, respectively). ADC, f, Δ%ADC, and Δ%D at mid-CRT in CR group were significantly higher than those in the PR group (P50.002, 0.013, 0.005, and 0.011, respectively). D combined with f and ADC had highest area under curve (0.917) in identifying CR from PR. However, tumor length as well as its change percentage did not change significantly between the CR group and PR group at an early time, which lagged behind the change of diffusion-related parameters of ESCC during CRT.However, tumor length as well as its change percentage did not change significantly between the CR group and PR group at an early time, which lagged behind the change of diffusion-related parameters of ESCC during CRT.
DISCUSSION
The ADC and D values of ESCC increased significantly during treatment, probably due to tumor necrosis, decreased tumor cell density, and enlarged intercellular space caused by definitive concurrent CRT. Moreover, according to the results of ROC curve analysis, D combined with f and ADC was superior in identifying treatment response at early times during definitive concurrent CRT. The f values of ESCC increased significantly during CRT. It was speculated that inflammatory cells infiltration, tumor cell destruction, and local region fraction of intracellular and extracellular spaces increased a lesion during CRT and these changes might contribute to a relative enlargement in microvascular perfusion, which resulted in an increase in the f values. Nevertheless, the coexisting local fibrosis and vascular injury might counteract a portion of this increase in microvascular perfusion.No significant difference of D* values could be detected during CRT, probably due to its intrinsic susceptibility to noise, which limited its application in clinical practice.
CONCLUSION
IVIM parameters proved useful in assessing response to definitive concurrent CRT for inoperable ESCC and combined with ADC at an early stage of treatment was a good predictor of response.Acknowledgements
No acknowledgement found.References
1.Hamai Y, Hihara J, Emi M, et al. Treatment outcomes and prognostic factors for thoracic esophageal cancer with clinical evidence of adjacent organ invasion. Anticancer Res 2013;33:3495–3502.
2. Imanishi S, Shuto K, Aoyagi T, et al. Diffusion- weighted magnetic resonance imaging for predicting and detecting the early response to chemoradiotherapy of advanced esophageal squamous cell carcinoma. Dig Surg 2013;30:240–248.
3.Wang L, Liu L, Han C, et al. The diffusion-weighted magnetic resonance imaging (DWI) predicts the early response of esophageal squamous cell carcinoma to concurrent chemoradiotherapy. Radiother Oncol 2016;121:246–251.
4.Iima M, Le Bihan D. Clinical intravoxel incoherent motion and diffusion MR imaging: past, present, and future. Radiology 2016;278:13–32.
5. Li Z, Zhu L, Hua S, et al. Evaluating early response of cervical cancer under concurrent chemo-radiotherapy by intravoxel incoherent motion MR imaging. BMC Cancer 2016;16:1–8
Figures