0693
Improved Body Quantitative Susceptibility Mapping by Using a Variable-Layer Single-Min-Cut Graph-Cut Algorithm for Field-Mapping1Department of Diagnostic and Interventional Radiology, Technical University of Munich, Munich, Germany, 2Philips Research, Hamburg, Germany, 3Munich School of Bioengineering, Technical University of Munich, Munich, Germany
Synopsis
Body QSM relies on accurate magnetic field-mapping that accounts for the presence of fat and is robust to large background fields. This work proposes the application of a single-min-cut graph-cut-based pipeline aiming at accurate, non-smoothed and unwrapped field-mapping without the need for further computationally expensive or problematic voxel-wise fitting or unwrapping techniques. The used body QSM pipeline achieves higher accuracy in field-map and susceptibility values, which is demonstrated in a numerical phantom and in in-vivo spine datasets.
Introduction
QSM is an established method to study brain physiology1, pathology2 and function3. Recently QSM also gained popularity in applications outside the brain, e.g. for measuring cartilage4, organ microstructure5 and bone density6,7. For body applications, the QSM processing needs to address the presence of fat with its chemical shift effect. The first QSM step, the magnetic field-mapping, therefore connects QSM to the sub-domain of MR water–fat imaging, which also can be reformulated as a field-map estimation problem7.
Field-mapping in the body can be challenging for mainly two reasons: i) large background fields possibly due to concave geometry of the anatomy or air inclusions in the FOV, and ii) signal voids in regions of low SNR due to MR invisible or short-T2 tissues, e.g. bone.
The purpose of this work is to propose the application of a field-mapping algorithm for body QSM that addresses the presence of fat, deals with large background fields close to signal voids (induced by the presence of bone and air) and automatically yields un-wrapped field-maps.
The ability of this graph-cut based algorithm to overcome limitations of current state-of-the-art methods is demonstrated in the spine.
Methods
Field-Mapping
The field-mapping algorithm uses a single min-cut
graph-cut approach with variable layer graph construction.
The single-min-cut graph-cut approach
was compared to a state-of-the-art iterative graphcut9. The field-mapping accounted for the presence
of fat, modeled with a 10-peak spectrum specific to
bone marrow10 and a shared $$$R_2^*$$$ -decay for water
and fat. The results of both methods were refined by
initializing a voxel-wise IDEAL11 algorithm with
the obtained field-maps.
Since QSM identifies relative values only, the mean value of all field-maps was set to zero to increase the
comparability.
Numerical Phantom
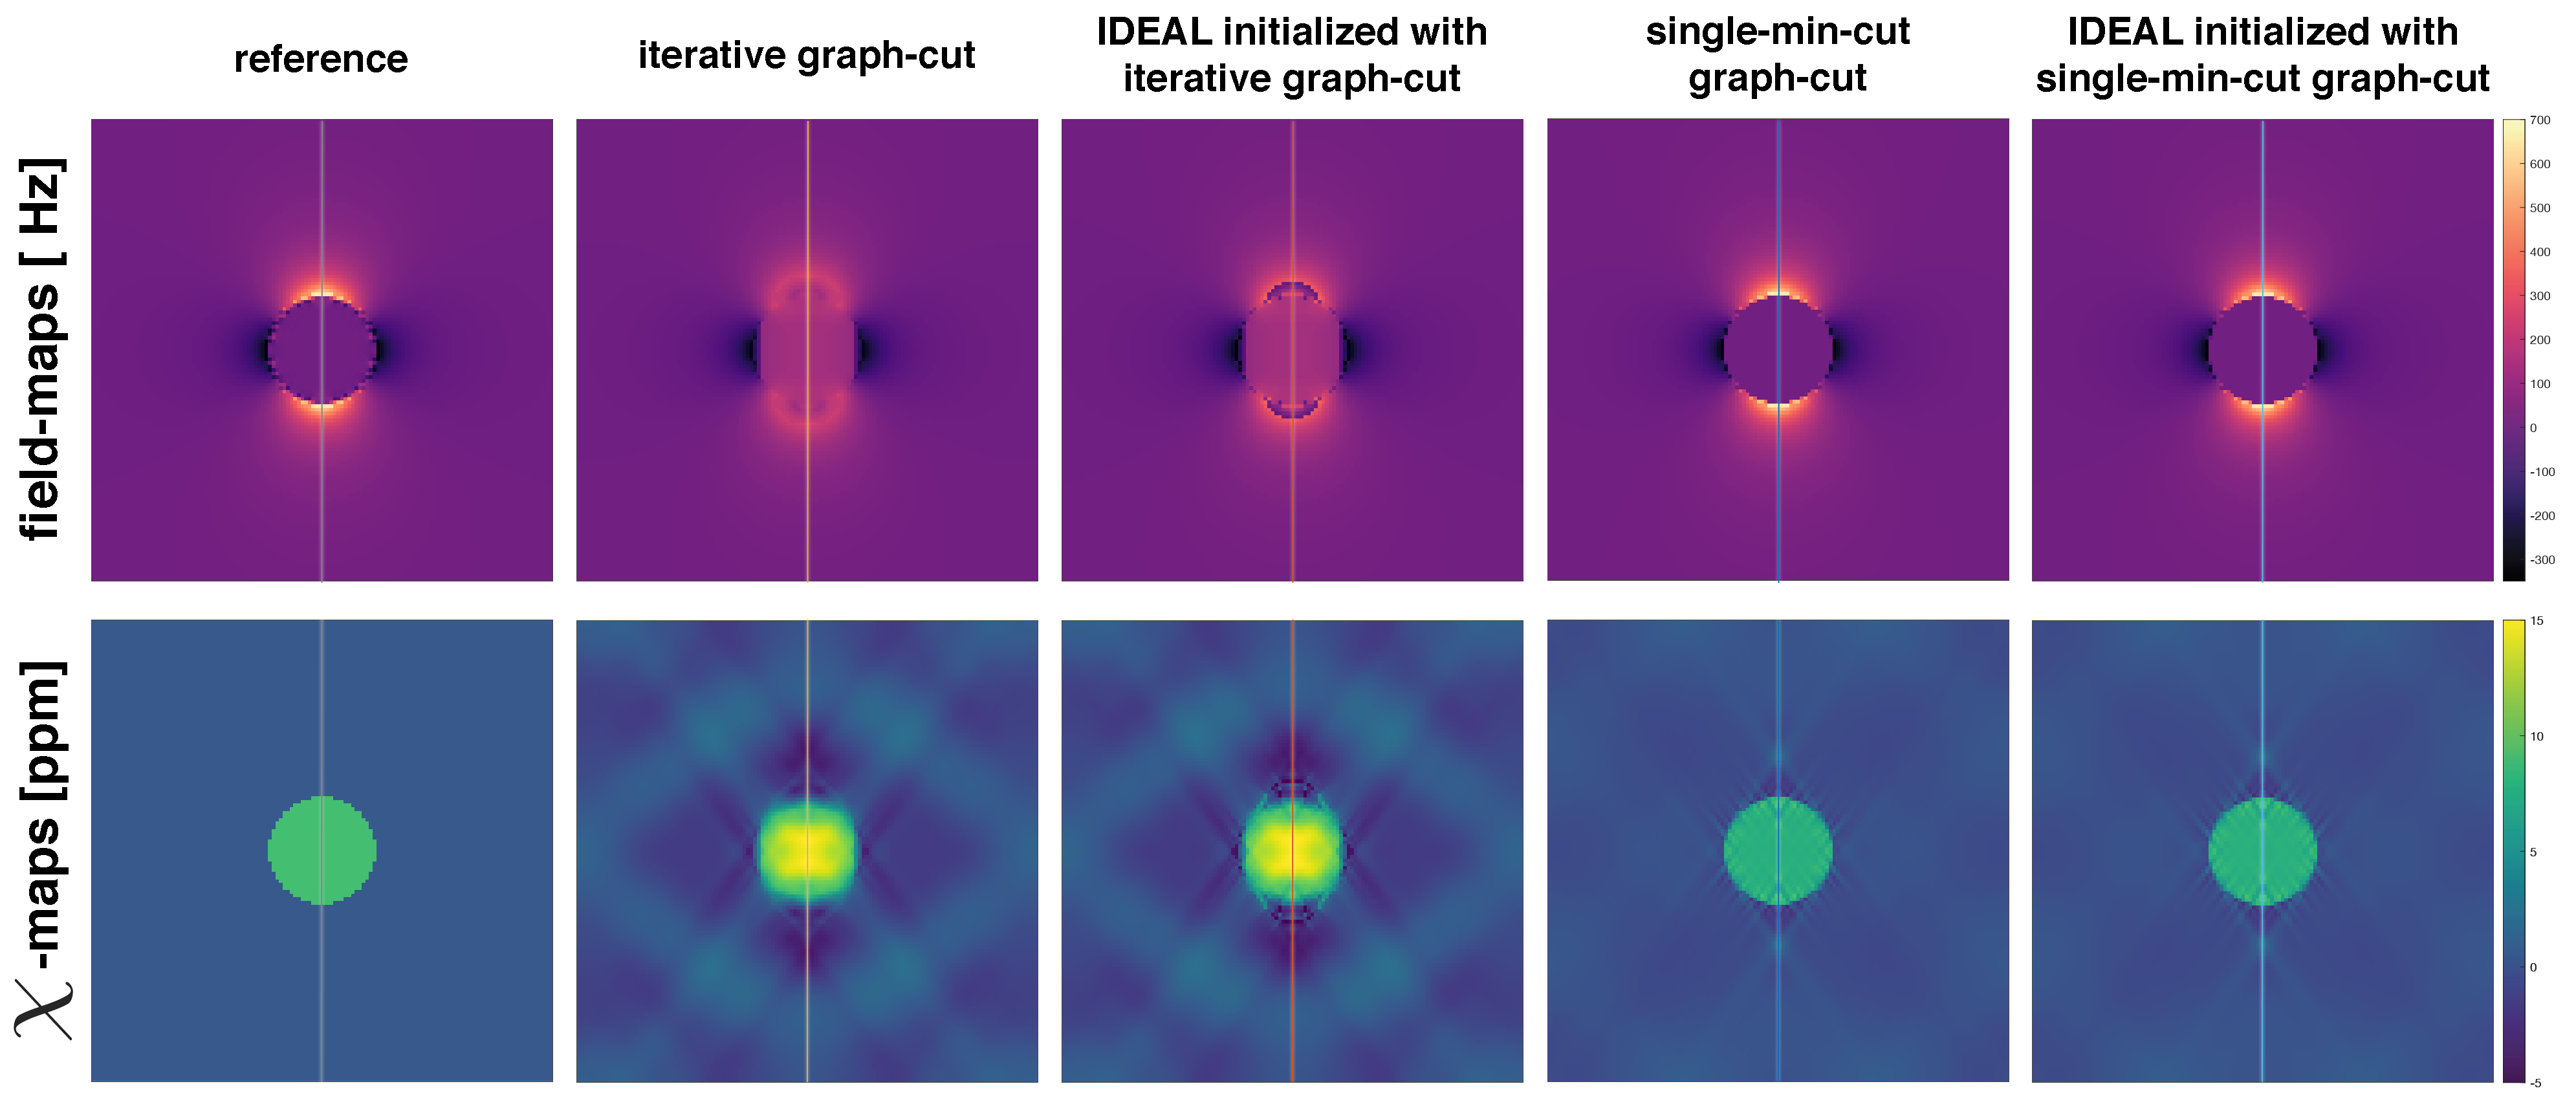
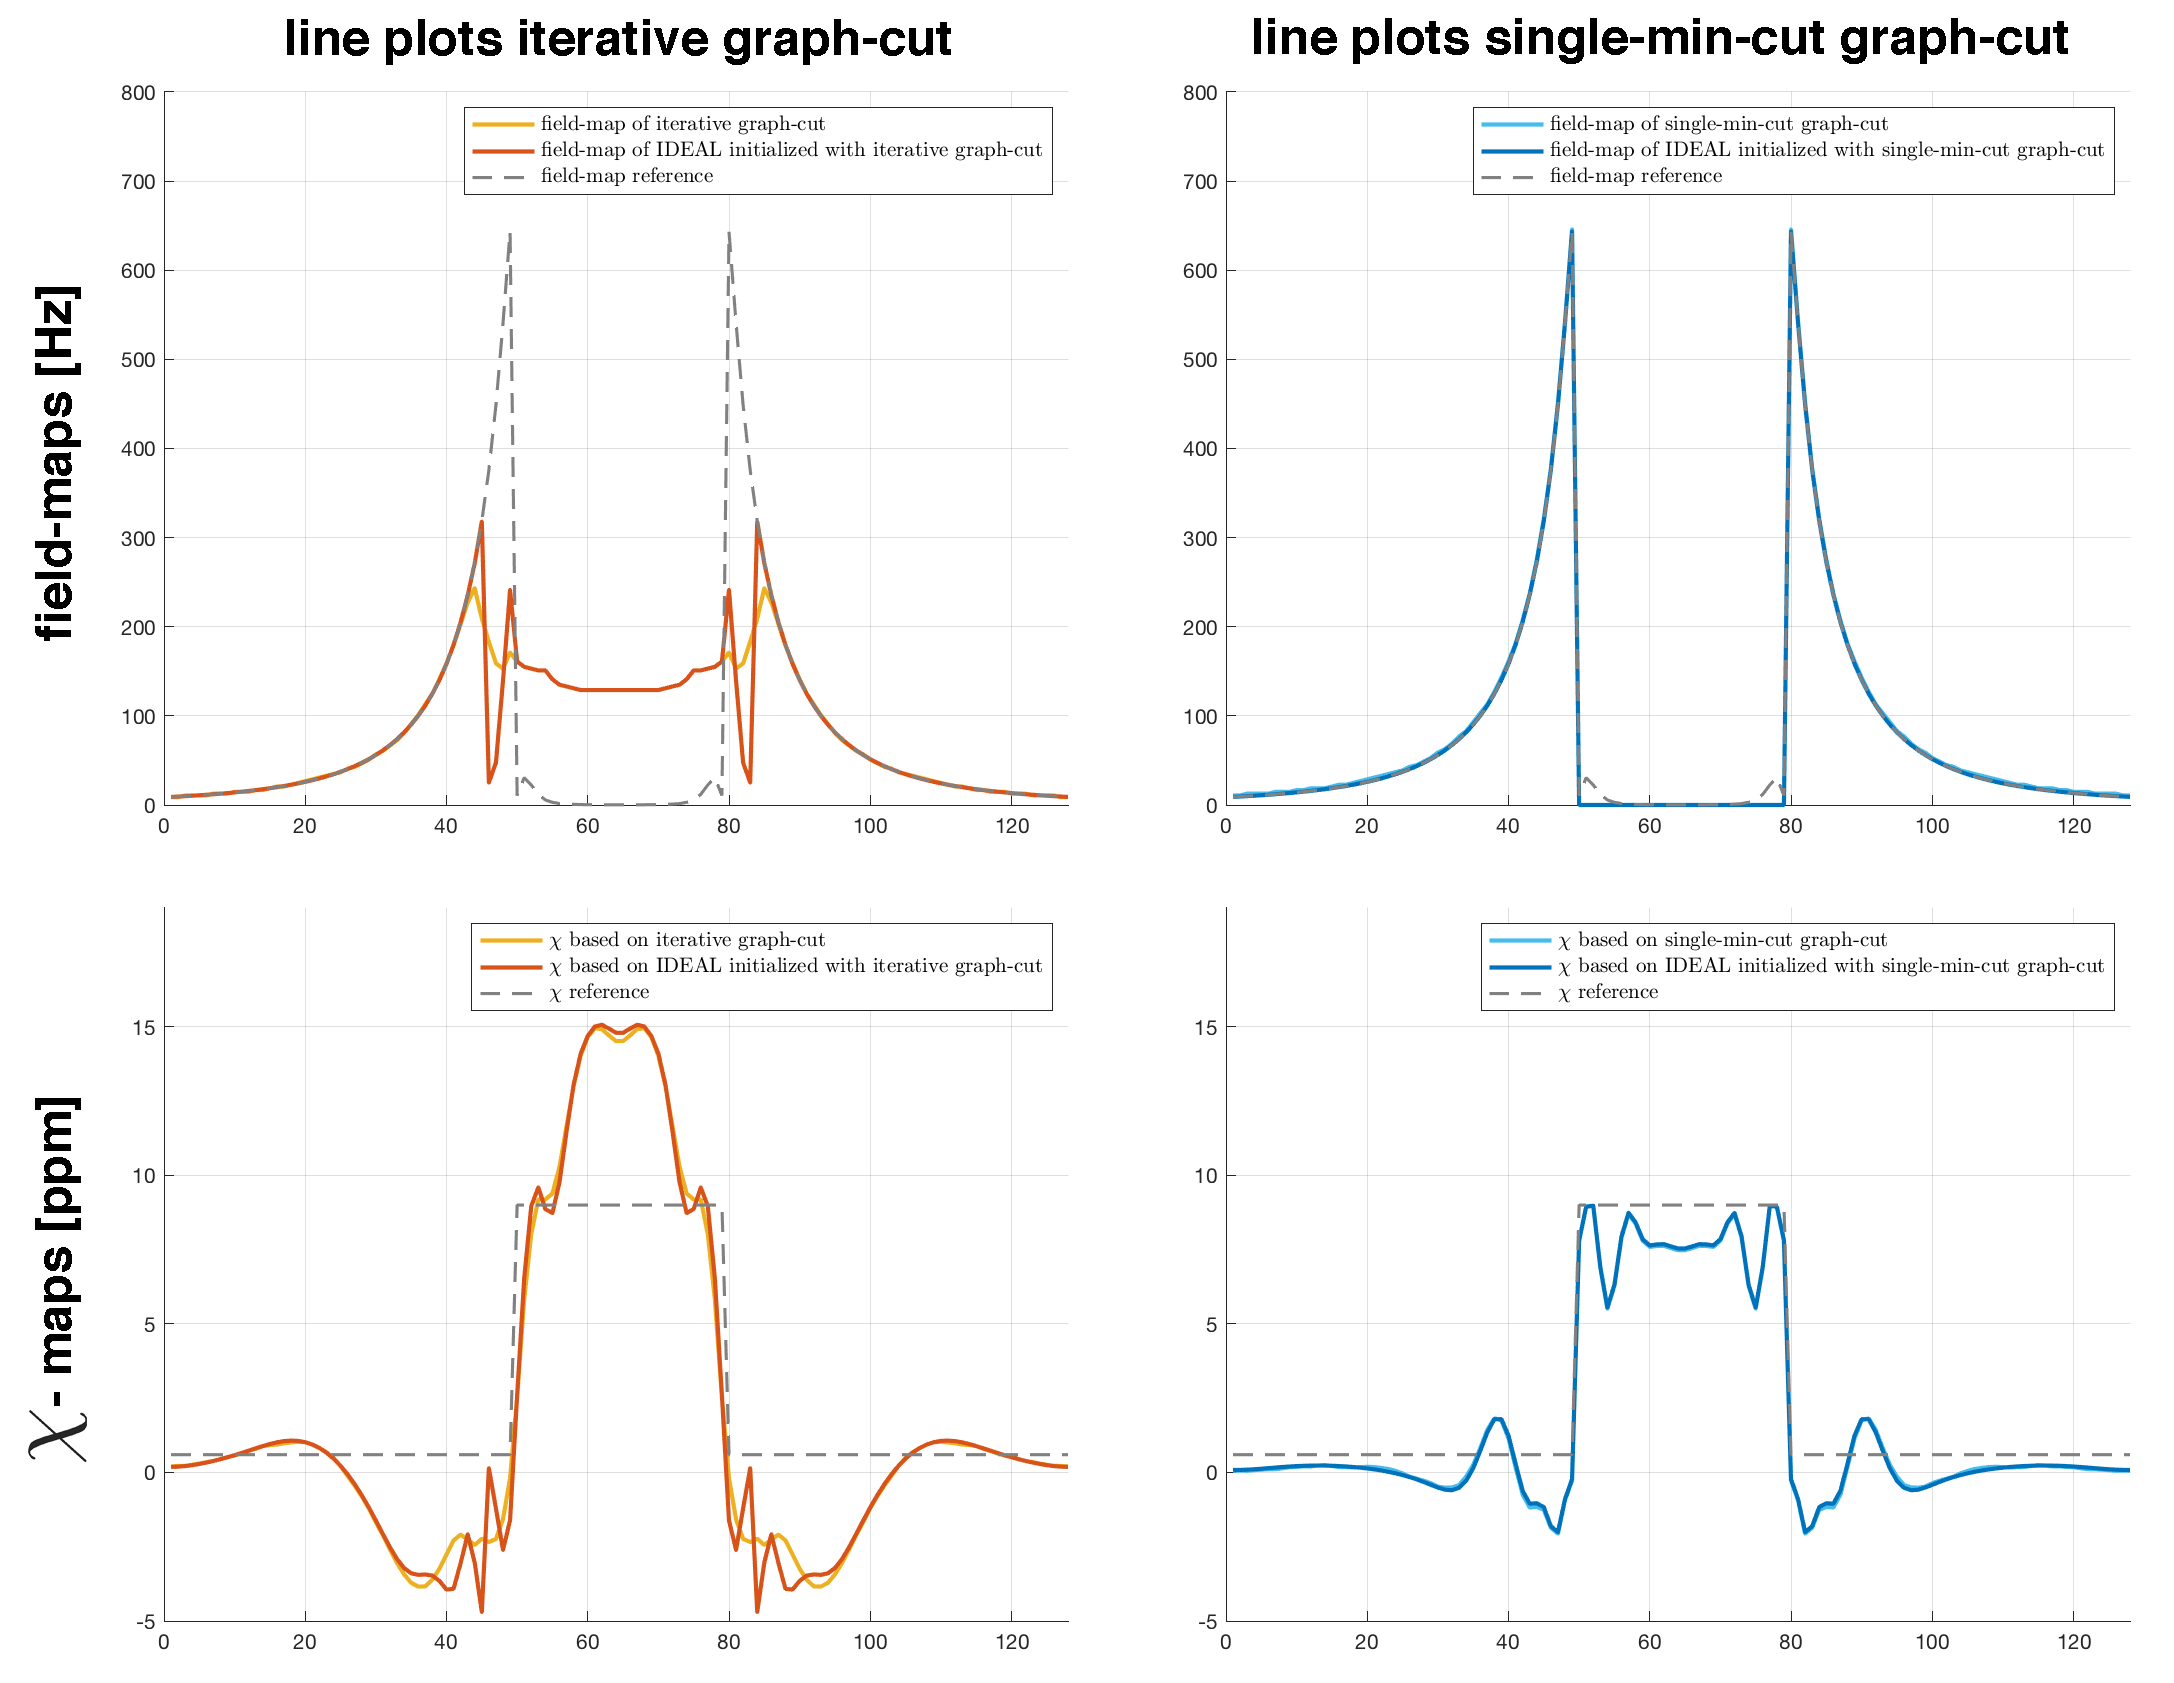
A numerical phantom with an air bubble in the center and surrounded by a fat fraction of 30 % was set up. The interface from air to tissue was abrupt to create strong field-map variations close to regions without signal. Regions of air and single fat fraction were assigned their literature magnetic susceptibility values and a corresponding field-map was forward simulated. For the dipole inversion a $$$\ell_2$$$-regularized closed form solution was used12.
In-vivo Measurements
QSM with joint background field removal and dipole inversion is applied to pathological 3T datasets of the spine similar to [8].
Results
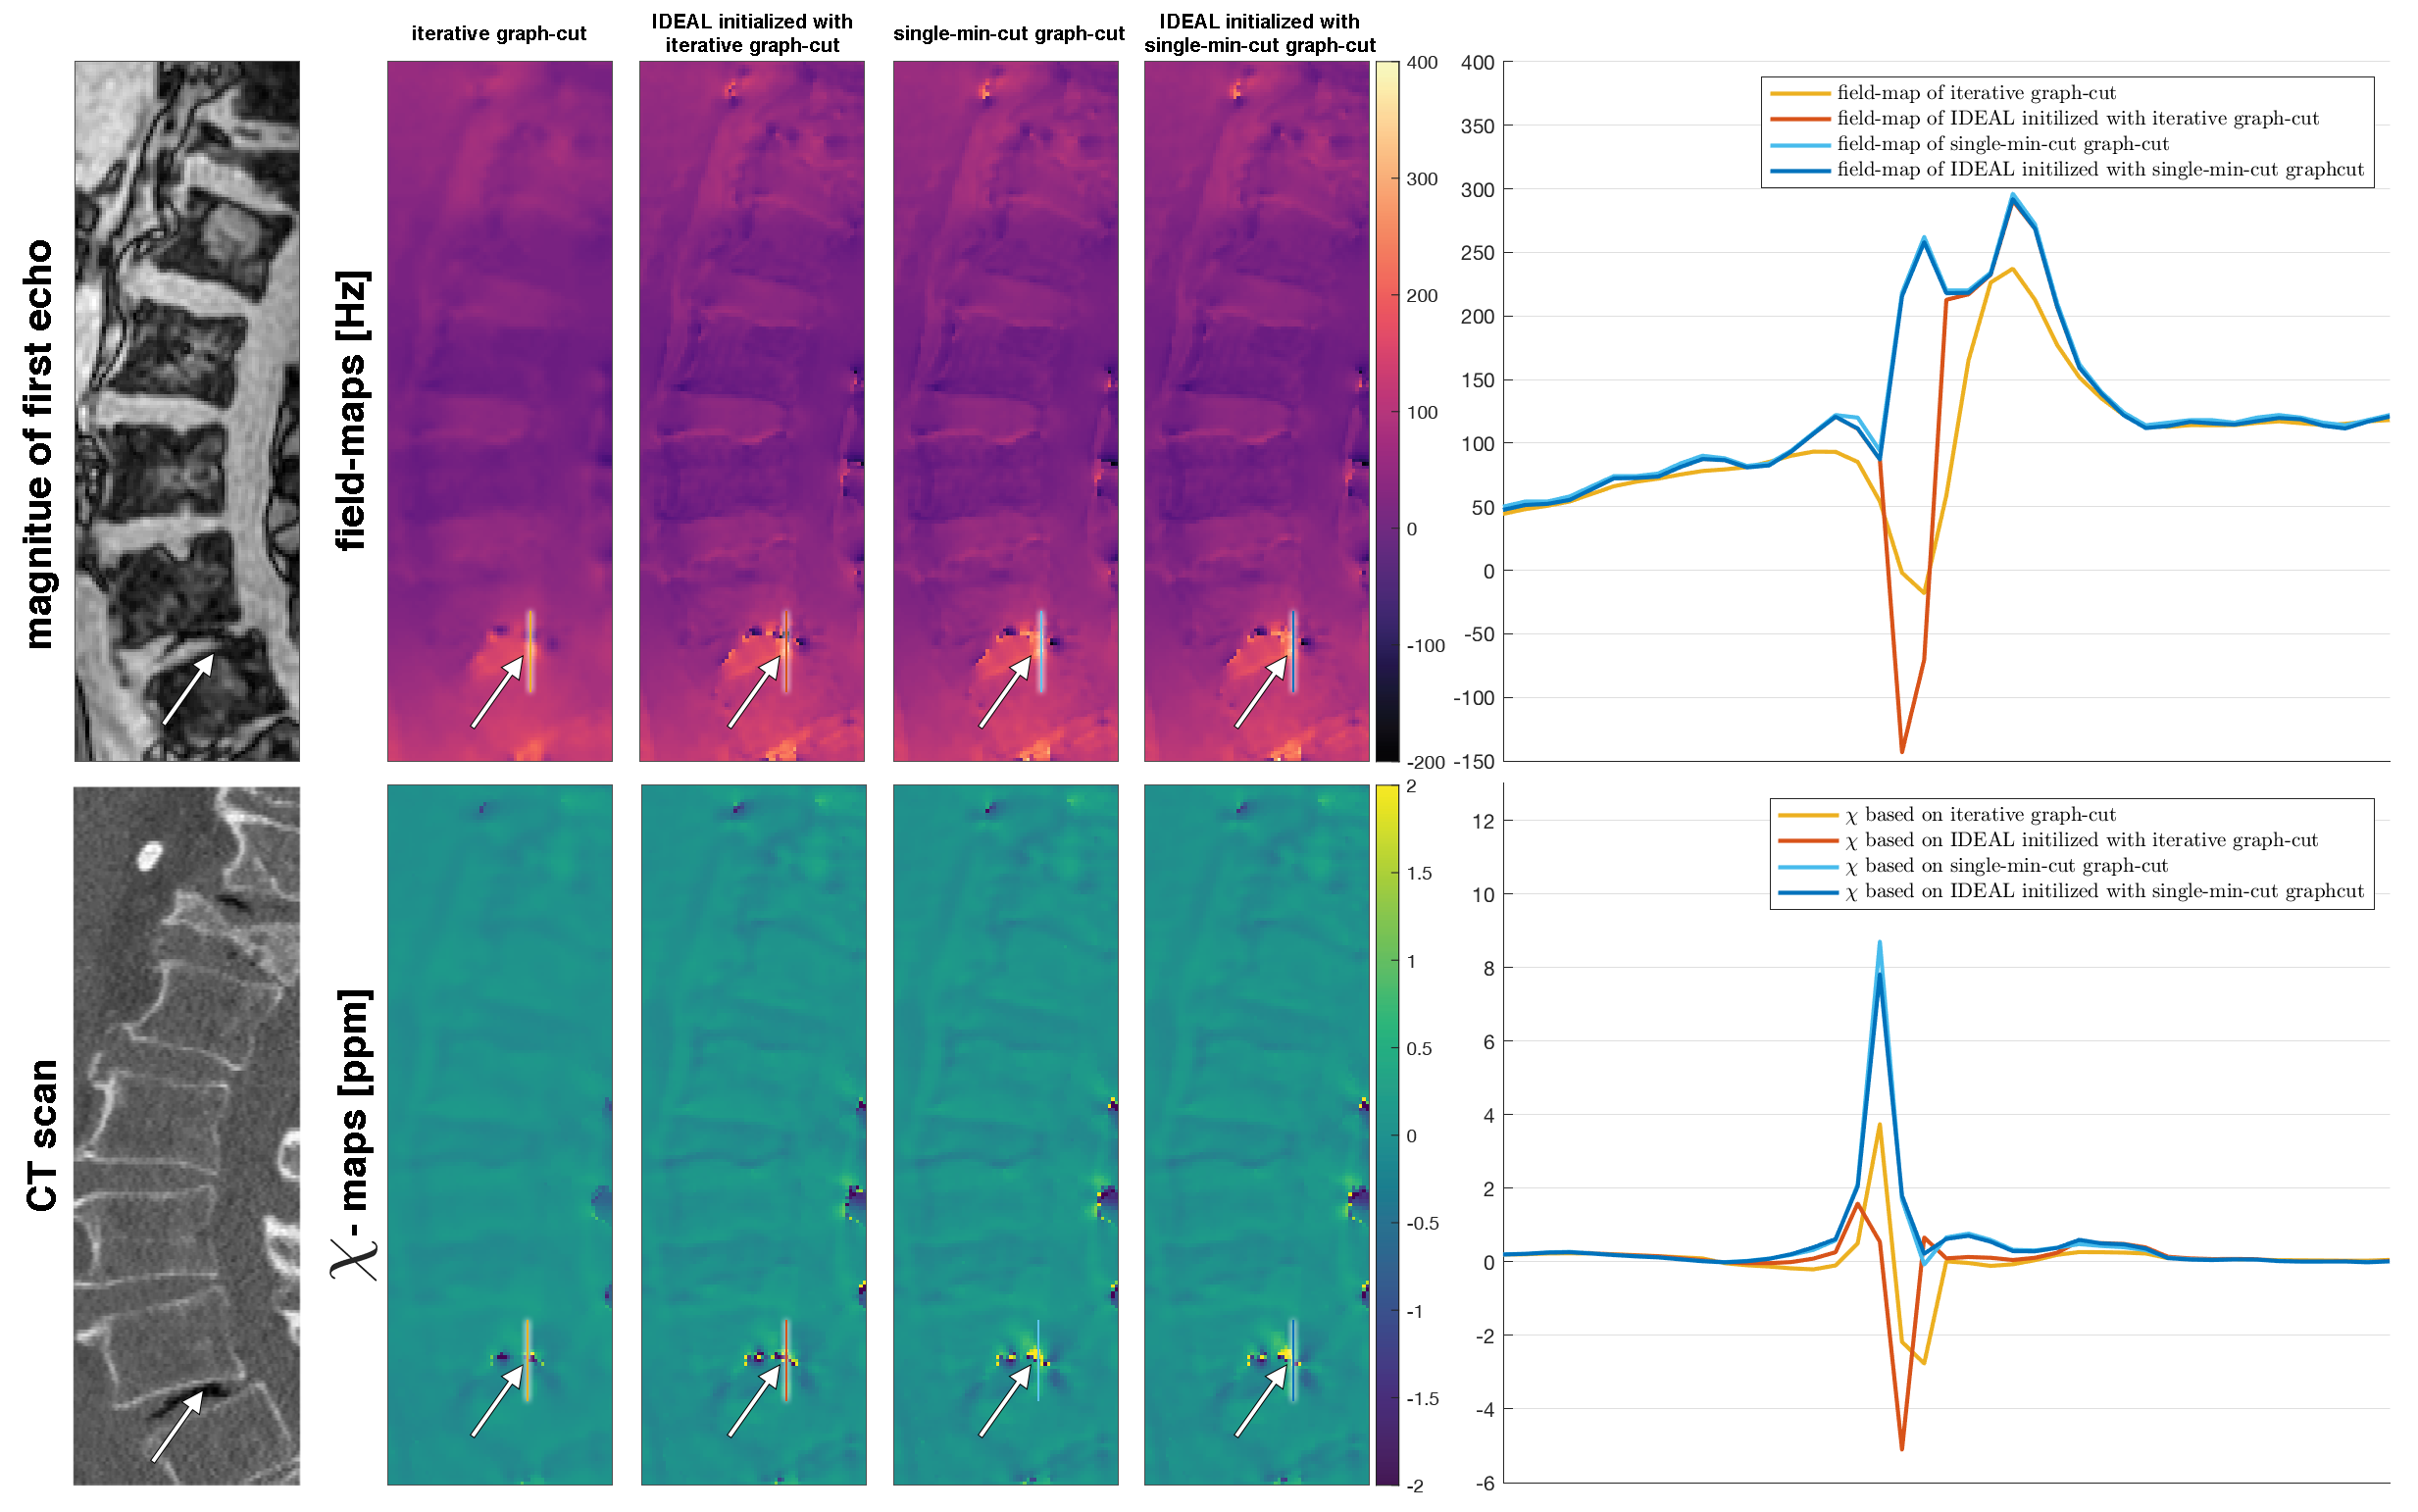
The single-min-cut graph-cut can resolve strong field-map variations close to an air-inclusion and the obtained field-maps are inherently phase-unwrapped. QSM based on this method can significantly improve results compared to the iterative graph-cut, as shown in Figure 1 and 2.
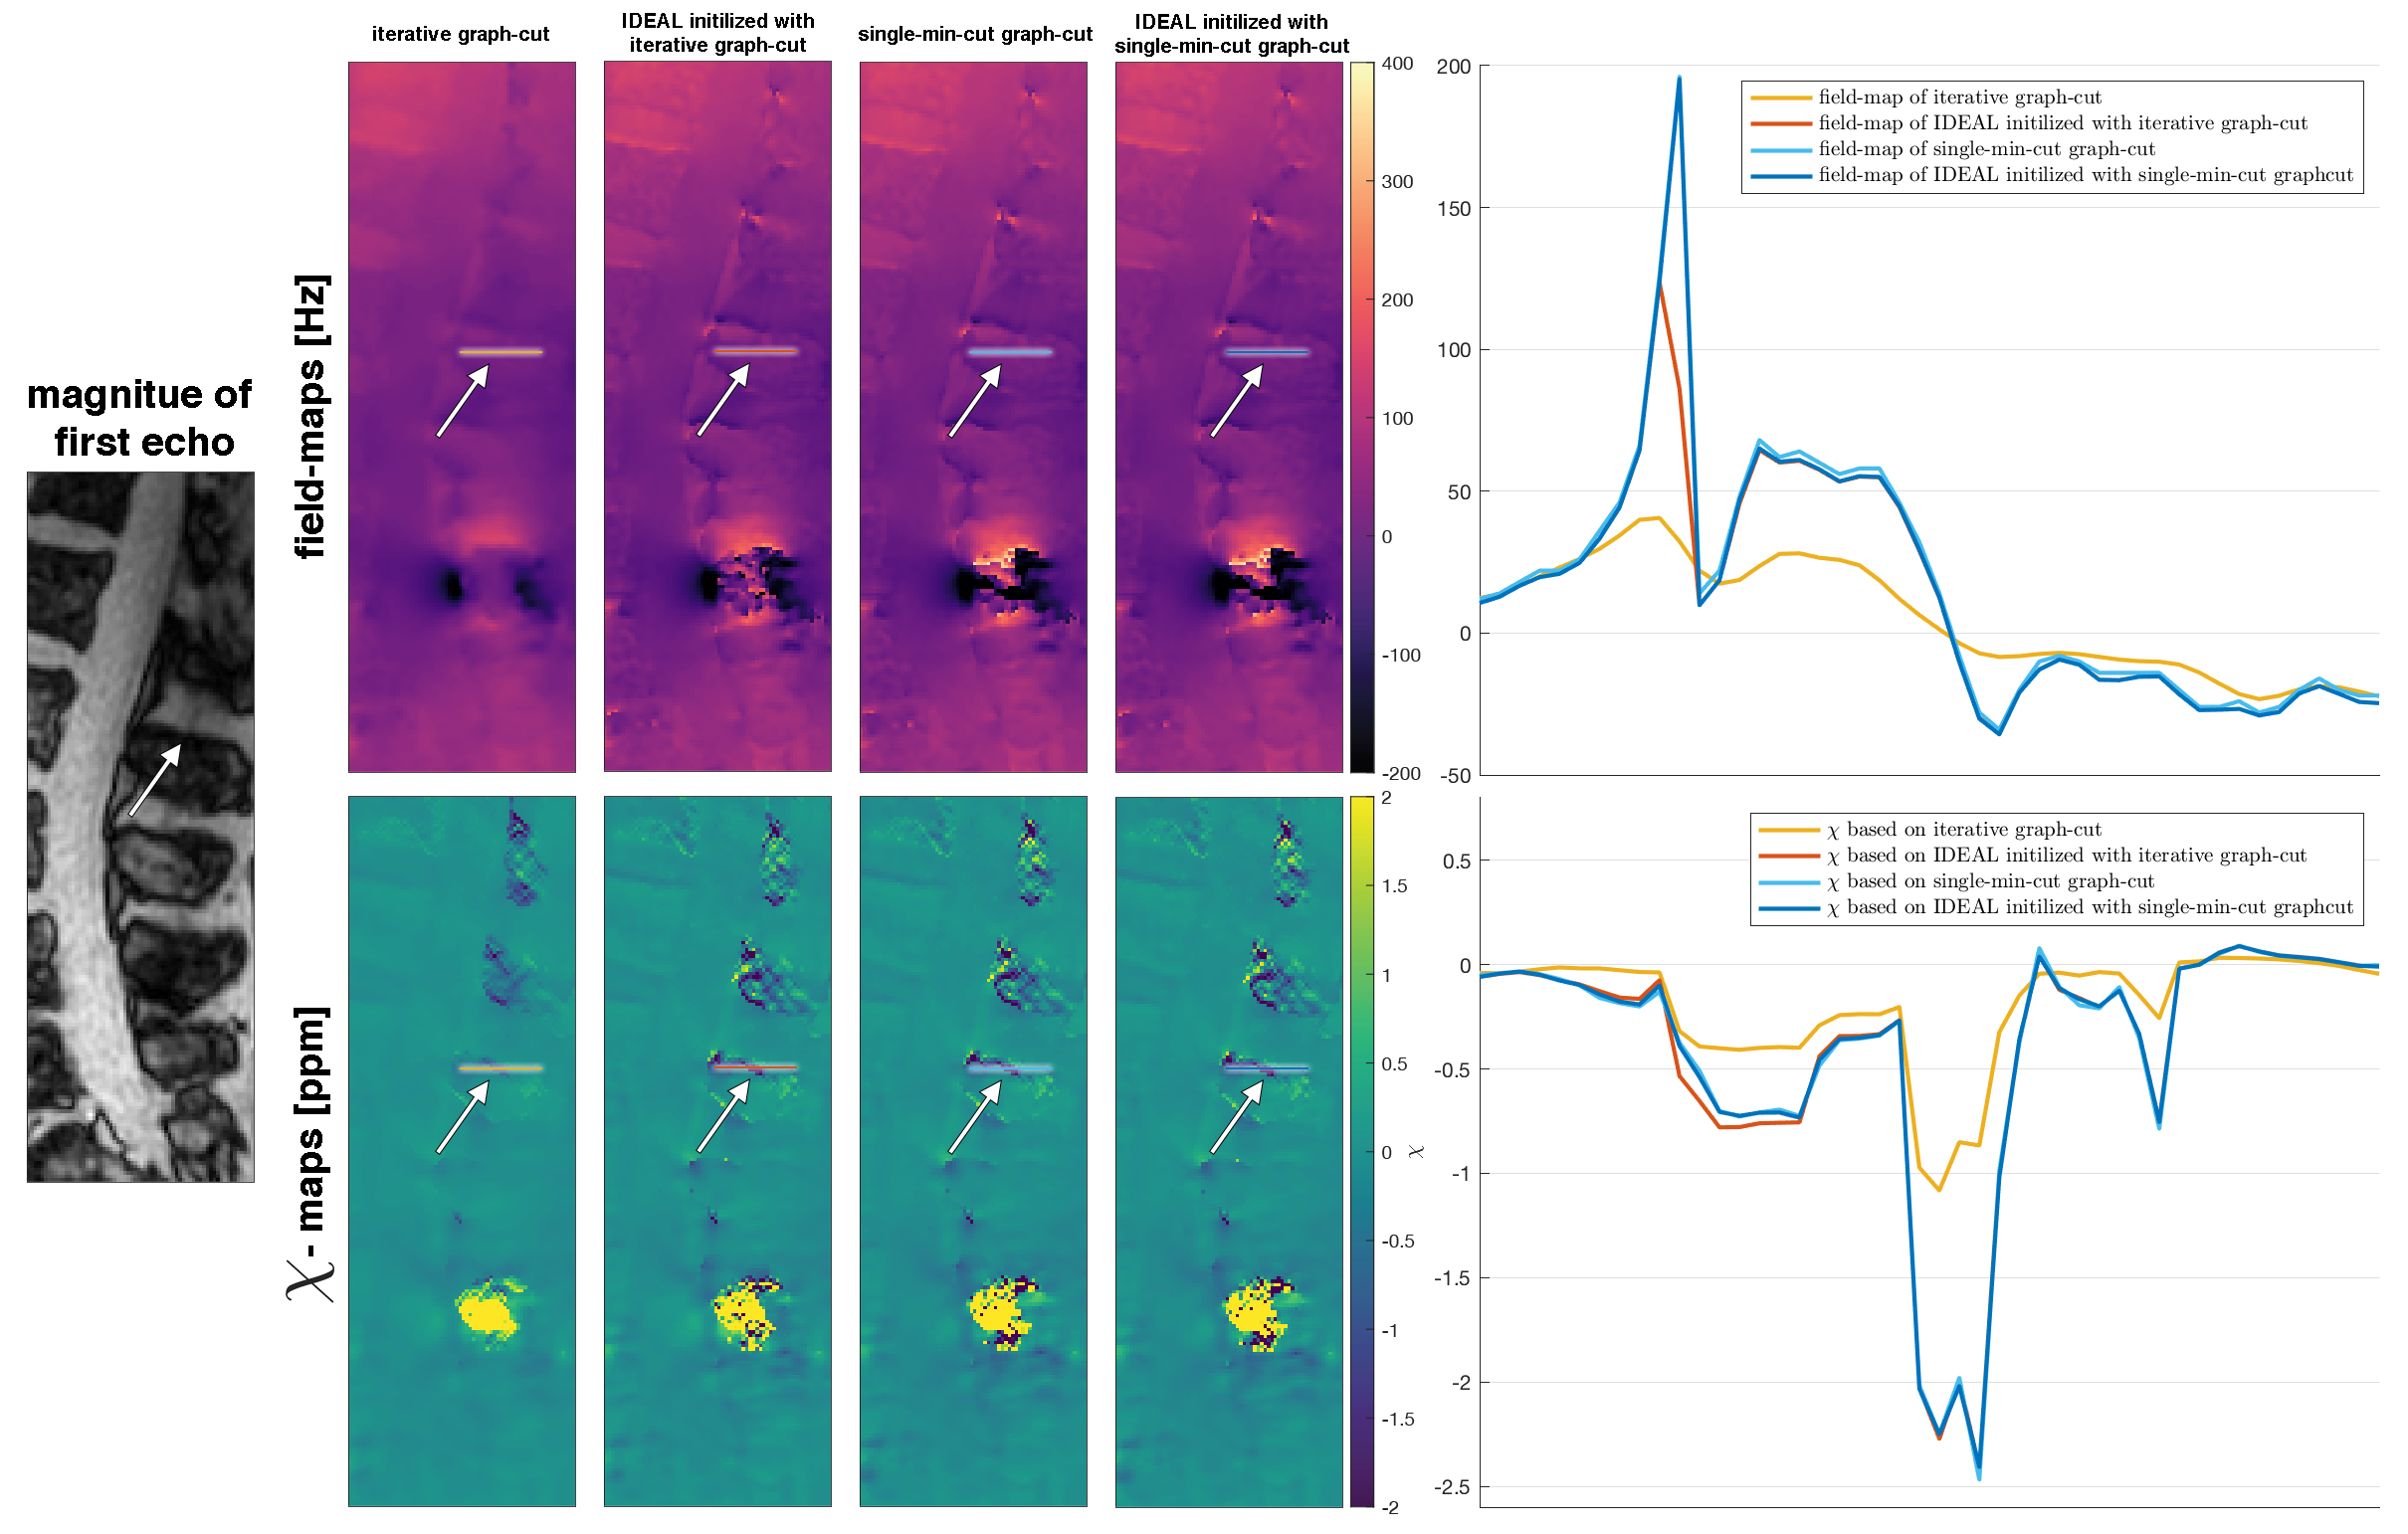
QSM based on the field-map of the single-min-cut graph-cut directly yields the correct $$$\chi$$$ values of trabecular bone in the spine, as shown in Figure 3, while the field-map of the iterative graph-cut needs a refinement step with the voxel-wise method.
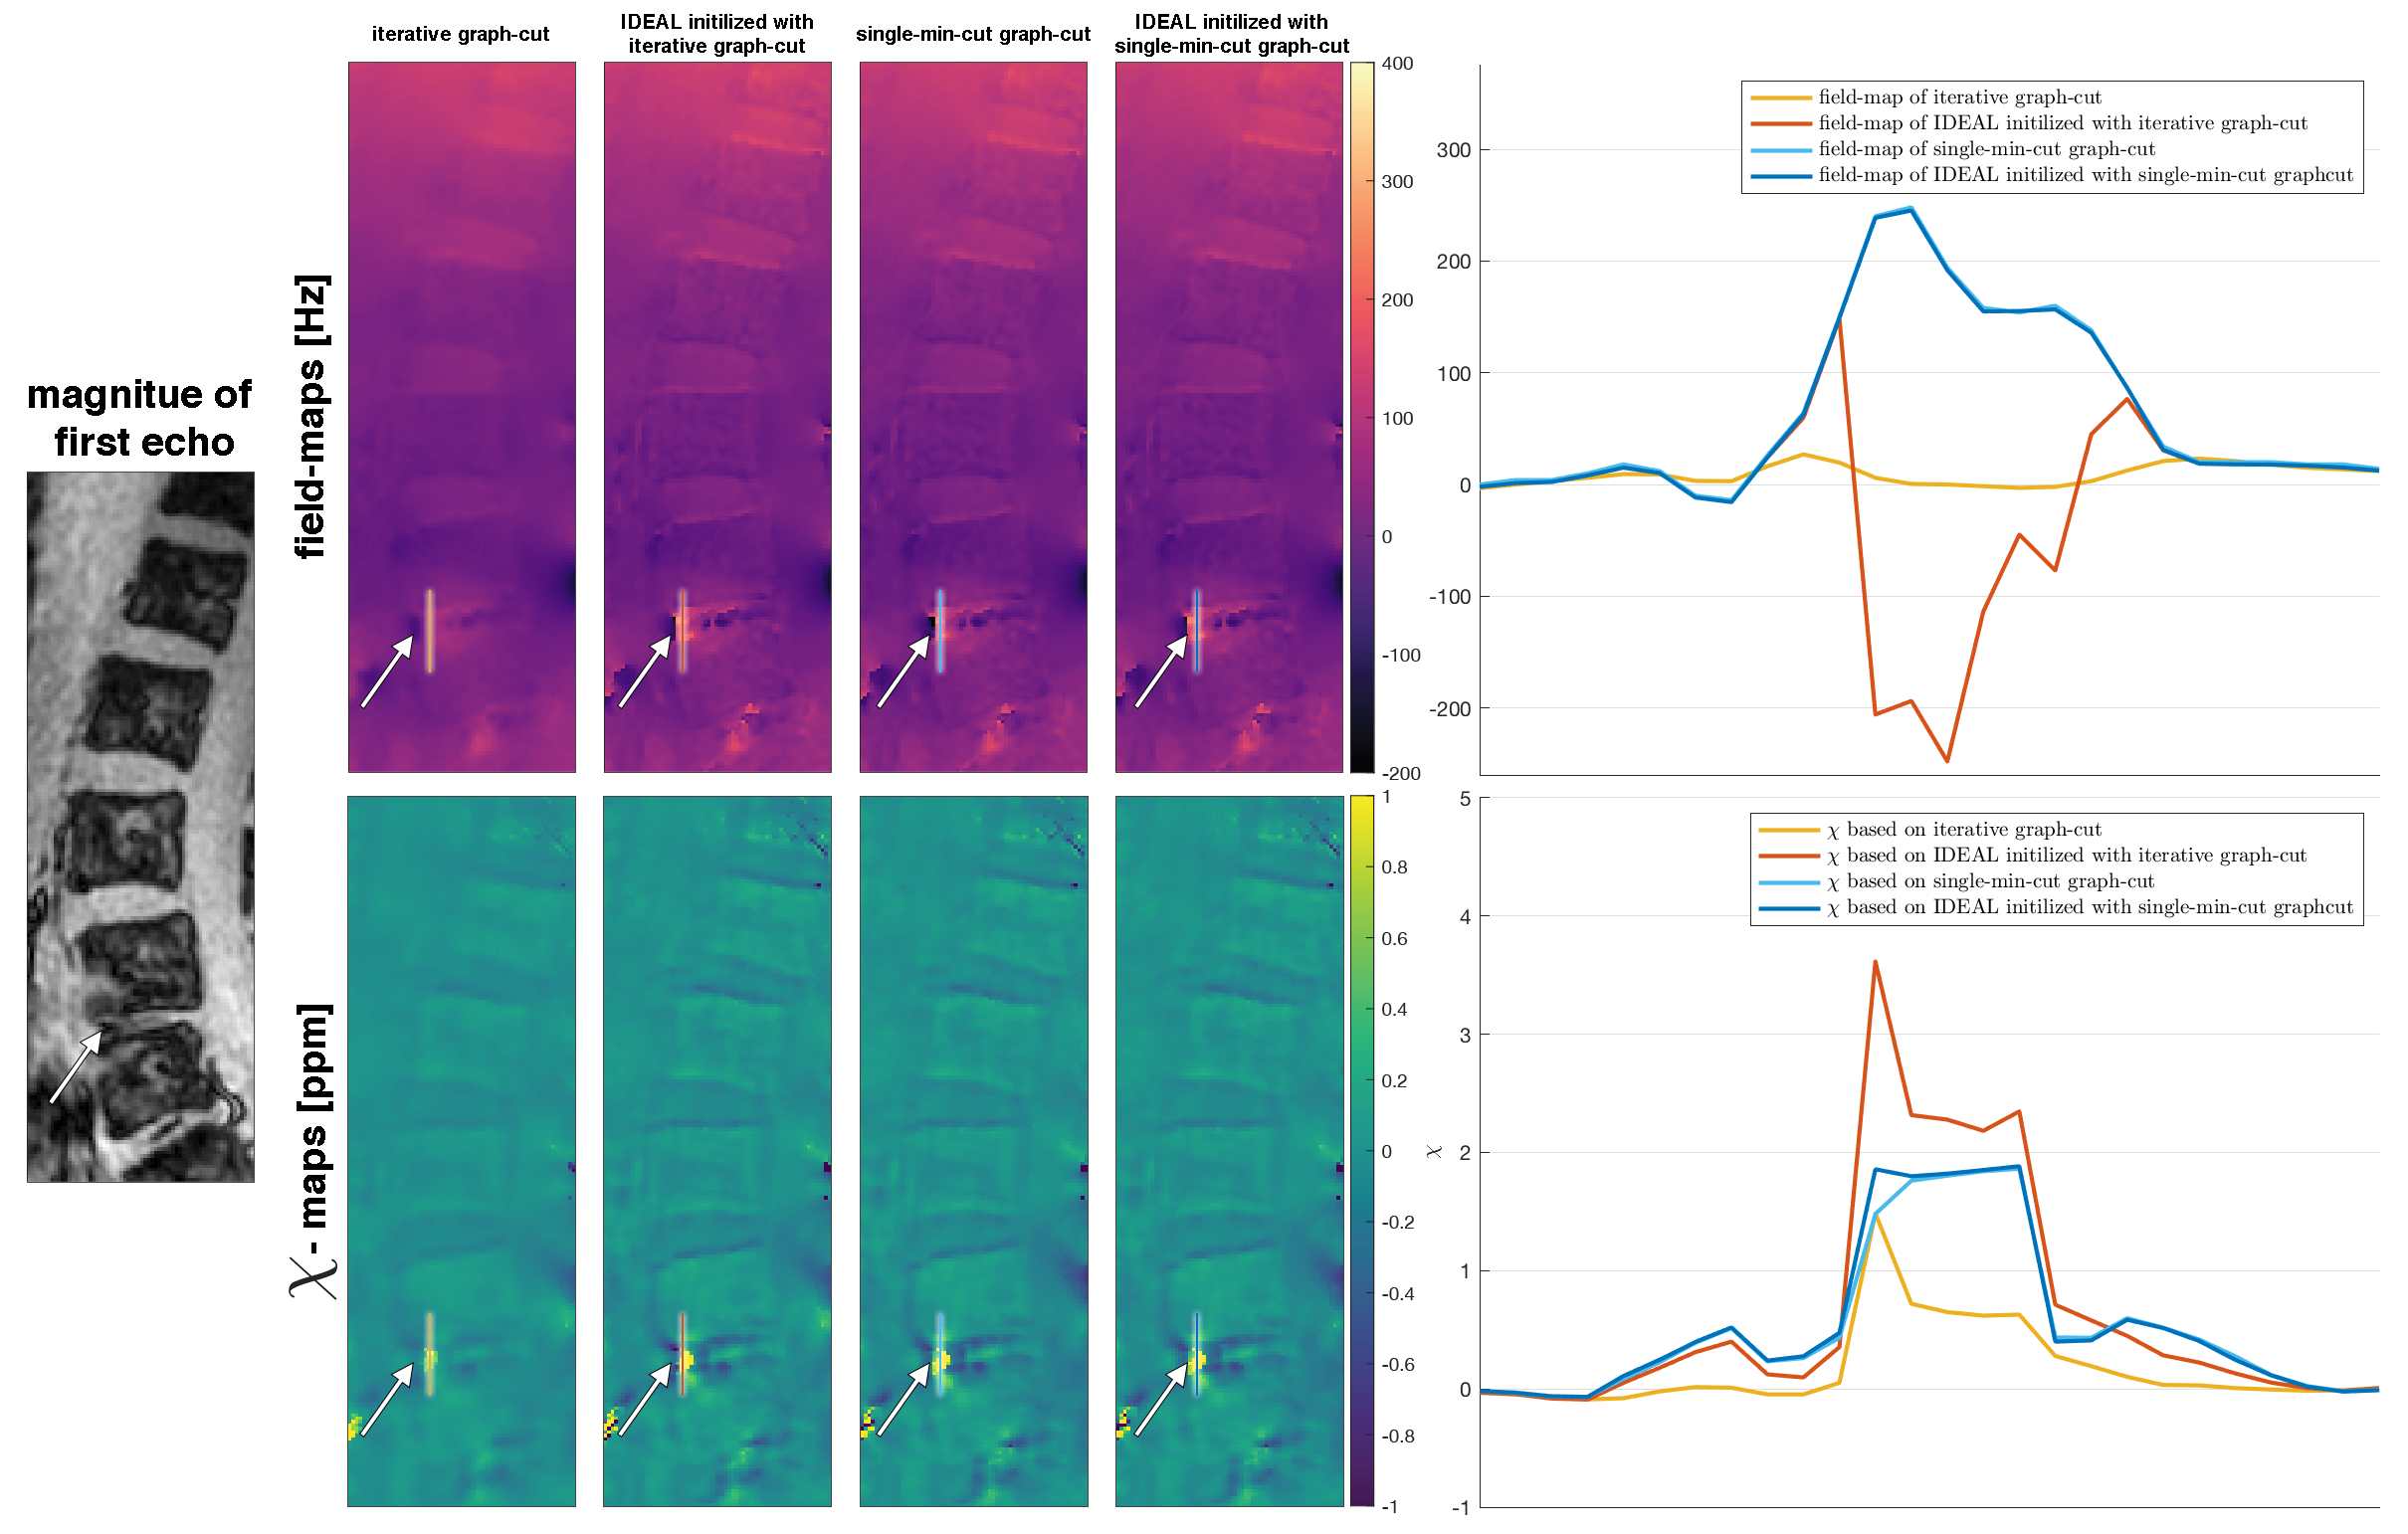
A Water–fat swap in the refined field-map of the iterative graph-cut propagates into their corresponding $$$\chi$$$ values in QSM, shown in Figure 4. The not refined field-map yields erroneous $$$\chi$$$ values. The field-maps of the single-min-cut graph-cut are congruent and consistently result in the same $$$\chi$$$ values.
QSM based on the field-map of the single-min-cut graph-cut yields the literature paramagnetic susceptibility value of air shown in Figure 5. This is not possible with the iterative graph-cut, neither after refinement.
Conclusion
The accuracy of the field-map is shown to have a strong effect on QSM results particularly in regions next to signal voids because of the presence of bone or air. The employed single-min-cut graph-cut algorithm significantly increases the accuracy of field-maps and therefore susceptibility values, particularly in regions close to bone and air. The employed pipeline yields non-smoothed and unwrapped field-maps in body QSM without the need to perform the two separate steps of voxel-wise IDEAL and unwrapping.Acknowledgements
The present work was supported by the European Research Council (grant agreement No 677661 – ProFatMRI). This work reflects only the authors view and the EU is not responsible for any use that may be made of the information it contains. The authors would also like to acknowledge research support from Philips Healthcare.References
- Liu, C., Li, W., Tong, K. A., Yeom, K. W., and Kuzminski, S., Susceptibilityweighted imaging and quantitative susceptibility mapping in the brain, Journal of Magnetic Resonance Imaging, 42(1), 23–41 (2014). http://dx.doi.org/10.1002/jmri.24768
- Eskreis-Winkler, S., Zhang, Y., Zhang, J., Liu, Z., Dimov, A., Gupta, A., and Wang, Y., The clinical utility of qsm: disease diagnosis, medical management, and surgical planning, NMR in Biomedicine, 30(4), 3668 (2016). http://dx.doi.org/10.1002/nbm.3668
- Sun, H., Seres, P., and Wilman, A., Structural and functional quantitative susceptibility mapping from standard fmri studies, NMR in Biomedicine, 30(4), 3619 (2016). http://dx.doi.org/10.1002/nbm.3619
- Wei, H., Decker, K., Zhang, Y., and Liu, C., Magnetic susceptibility anisotropy of collagen fibrils in the articular cartilage, In , Proceedings 25. Annual Meeting International Society for Magnetic Resonance in Medicine (pp. 1210) (2017). Honolulu, Hawaii: http://archive.ismrm.org/2017/1210.html.
- Dibb, R., and Liu, C., Joint eigenvector estimation from mutually anisotropic tensors improves susceptibility tensor imaging of the brain, kidney, and heart, Magnetic Resonance in Medicine, 77(6), 2331–2346 (2016). http://dx.doi.org/10.1002/mrm.26321
- Dimov, A. V., Liu, Z., Spincemaille, P., Prince, M. R., Du, J., and Wang, Y., Bone quantitative susceptibility mapping using a chemical species-specific r2* signal model with ultrashort and conventional echo data, Magnetic Resonance in Medicine, 79(1), 121–128 (2017). http://dx.doi.org/10.1002/mrm.26648
- Diefenbach, M. N., Meineke, J., Ruschke, S., Baum, T., Gersing, A., and Karampinos, D. C., On the sensitivity of quantitative susceptibility mapping for measuring trabecular bone density, Magnetic Resonance in Medicine, nil(nil), (2018). http://dx.doi.org/10.1002/mrm.27531
- Diefenbach, M., et al., Vertebral Column Quantitative Susceptibility Mapping using Joint Background Field Removal and Dipole Inversion, Proceedings 26. Annual Meeting International Society for Magnetic Resonance in Medicine, (2018), http://archive.ismrm.org/2018/0191.html
- Hernando, D., Kellman, P., Haldar, J. P., & Liang, Z., Robust water/fat separation in the presence of large field inhomogeneities using a graph cut algorithm, Magnetic Resonance in Medicine, 63(1), (2009). http://dx.doi.org/10.1002/mrm.22177
- Ren, J., Dimitrov, I., Sherry, A. D., & Malloy, C. R., Composition of adipose tissue and marrow fat in humans by1h nmr at 7 tesla, Journal of Lipid Research, 49(9), 2055–2062 (2008). http://dx.doi.org/10.1194/jlr.d800010-jlr200
- Diefenbach, M., Ruschke, S., Karampino, C., A Generalized Formulation for Parameter Estimation in MR Signals of Multiple Chemical Species, Proceedings 25. Annual Meeting International Society for Magnetic Resonance in Medicine, 5181 (2017). http://dev.ismrm.org/2017/5181.html
- Bilgic, B., Chatnuntawech, I., Fan, A. P., Setsompop, K., Cauley, S. F., Wald, L. L., & Adalsteinsson, E., Fast image reconstruction with l2-regularization, Journal of Magnetic Resonance Imaging, 40(1), 181–191 (2013). http://dx.doi.org/10.1002/jmri.24365
Figures