0691
Brain-component mapping with Inversion-Recovery bSSFP1Magnetic Resonance and X-ray Imaging, Fraunhofer Development Center X-ray Technology (EZRT), Würzburg, Germany, 2Experimental Physics 5, University of Würzburg, Würzburg, Germany, 3Institute of Medical Engineering, University of Applied Sciences Würzburg-Schweinfurt, Schweinfurt, Germany, 4Neuroradiology, University of Heidelberg, Heidelberg, Germany
Synopsis
An inversion recovery (IR) bSSFP measurement allows to calculate quantitative parameter maps assuming mono-exponential signals. However, the measured signals often show multi-exponential behavior due to partial volume effects or tissue microstructure. With IR bSSFP it is possible to extract a spectrum of the apparent relaxation times T1* and hence to identify multiple components in each voxel. By integration over specific T1* ranges, different brain-components like white matter, gray matter or CSF can be mapped. In this work, we demonstrate that even short-living components such as myelin water are detected providing helpful information for diagnostic purposes, e.g. in neurodegenerative diseases.
Introduction
The Inversion-Recovery (IR) bSSFP-Sequence (a.k.a. TrueFISP) enables fast quantitative mapping of relaxation times T1 and T2.1 Furthermore, when there are multiple tissue components within a voxel, the signal can be analyzed with an inverse Laplace transform to generate spectra of the apparent relaxation time T1*.2,3 In that way it is possible to identify the individual tissue components within each voxel. The integration over specific T1* ranges enables the visualization of distinct brain-components. Here, we demonstrate that short-living components such as myelin water can be mapped by this approach.Methods
In vivo experiments were performed on two different volunteers on a 3T MRI system with a 20-channel head coil array. The sequence settings of the Cartesian multi-shot IR TrueFISP measurements were: TR = 4 ms, TE = 2 ms, flip angle = 35°, resolution = 1 x 1 x 4 mm3, number of echoes per shot = 2000, total number of shots = 11, waiting time after shot = 7.5 s, total scan time = 2.5 min per slice.
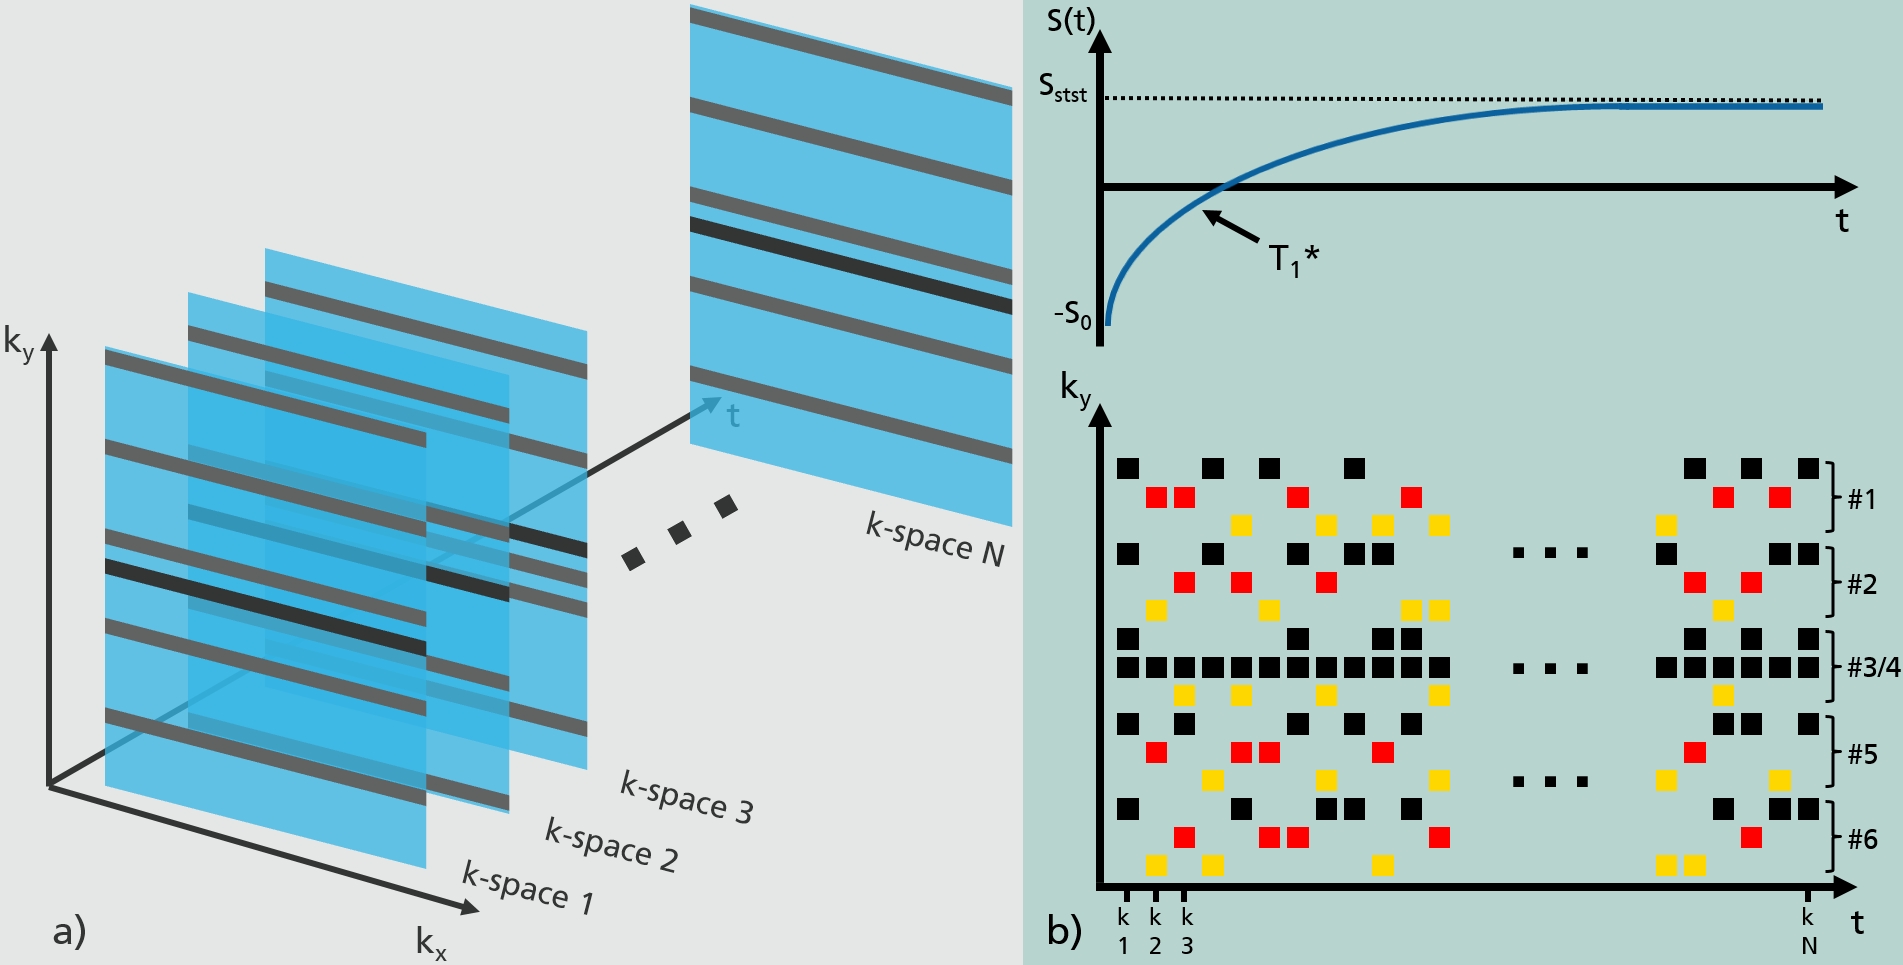
The k-space lines are quasi-randomly distributed. The sampling scheme is shown in Figure 1, where N represents the 2000 echoes of the measurement. In total, 400 images are reconstructed with an iterative PCA based approach.2,4
Assuming a mono-exponential behavior, a 3-parameter-fit can be used to extract T1, T2 and proton density (PD) information. However, typically there exist multiple tissue types within a voxel. In this case the inverse Laplace transformation can be applied to generate voxelwise T1* spectra.2,3 The apparent relaxation time T1* depends on T1, T2 and the flip angle α and is given by 1:
$$ T_1^*=(\frac{1}{T_1}cos^2 \frac{α}{2}+\frac{1}{T_2}sin^2 \frac{α}{2})^{-1} $$
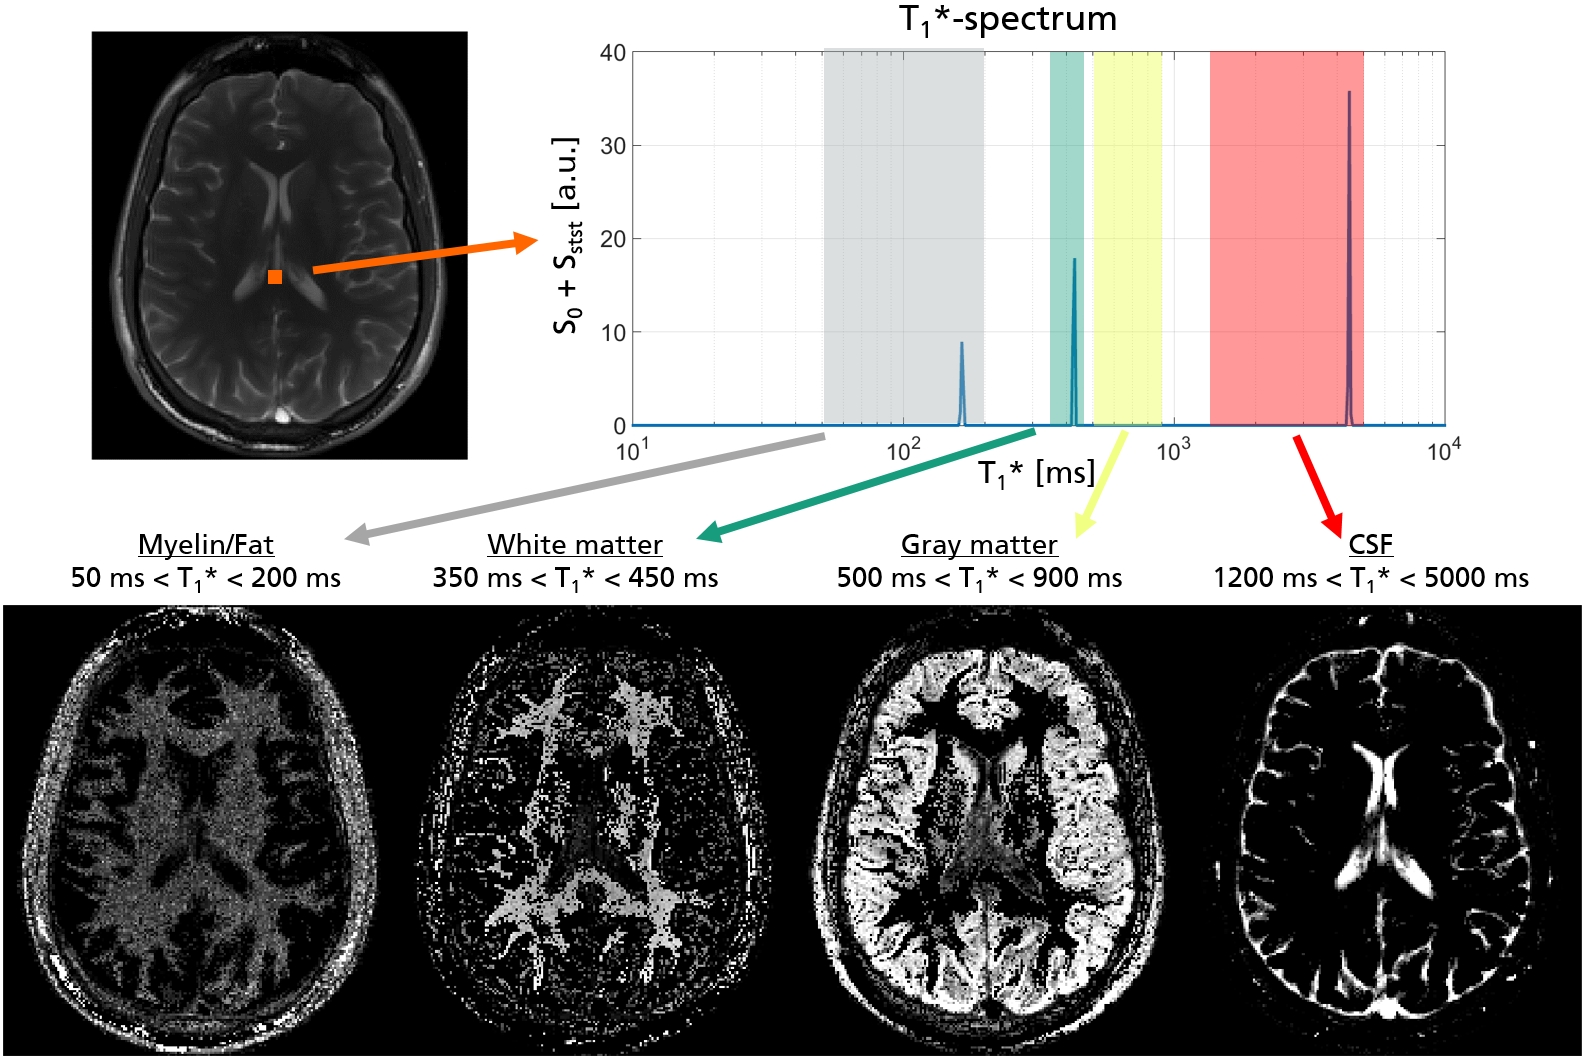
The separation of tissue peaks allows to integrate over specific T1* ranges to obtain tissue component maps.
Results
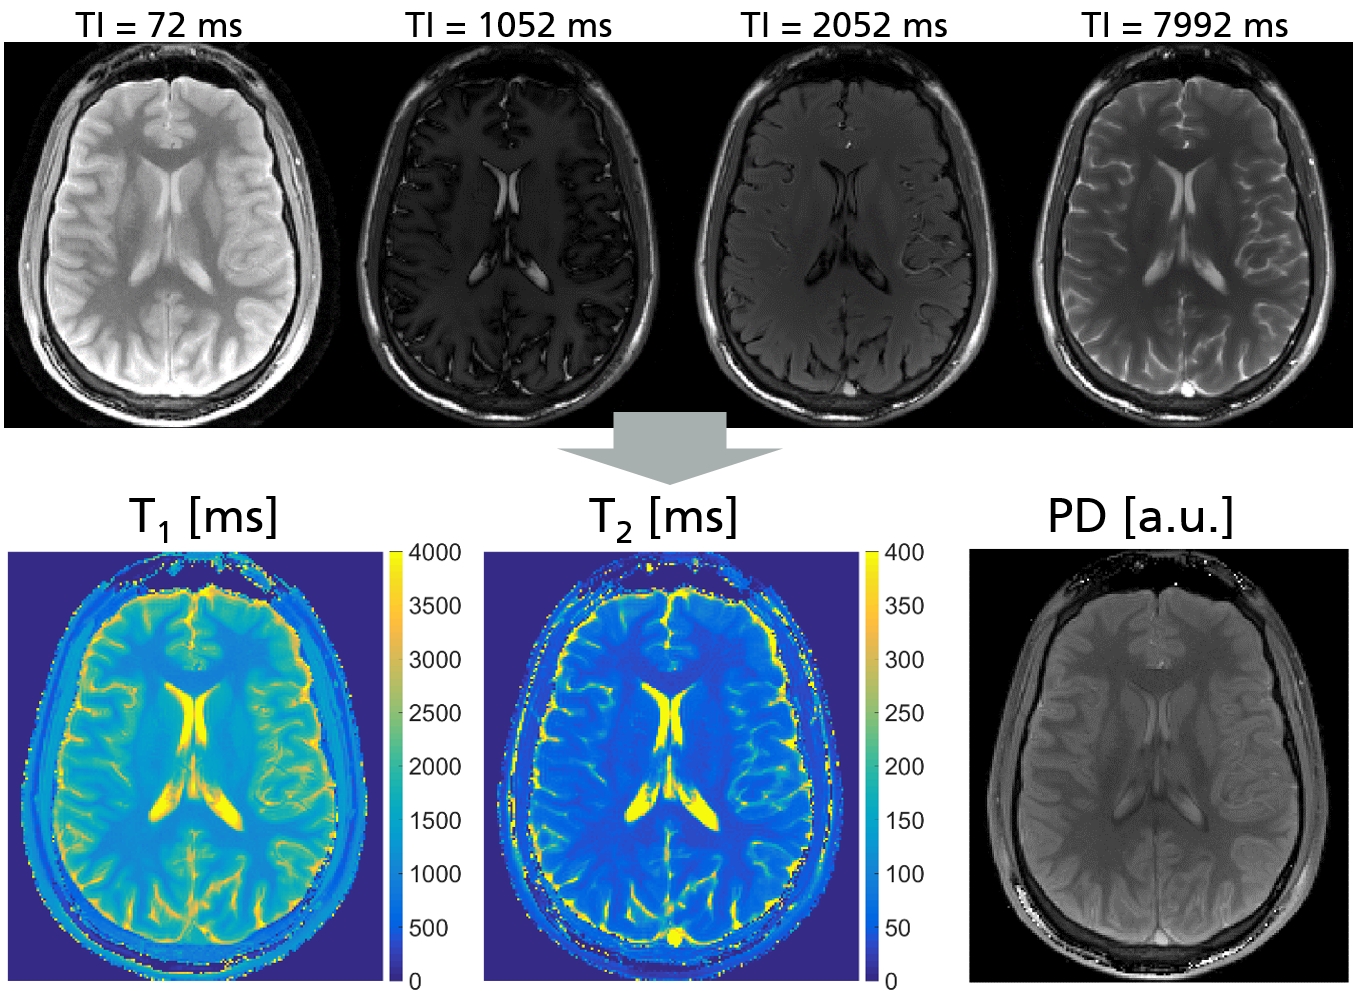
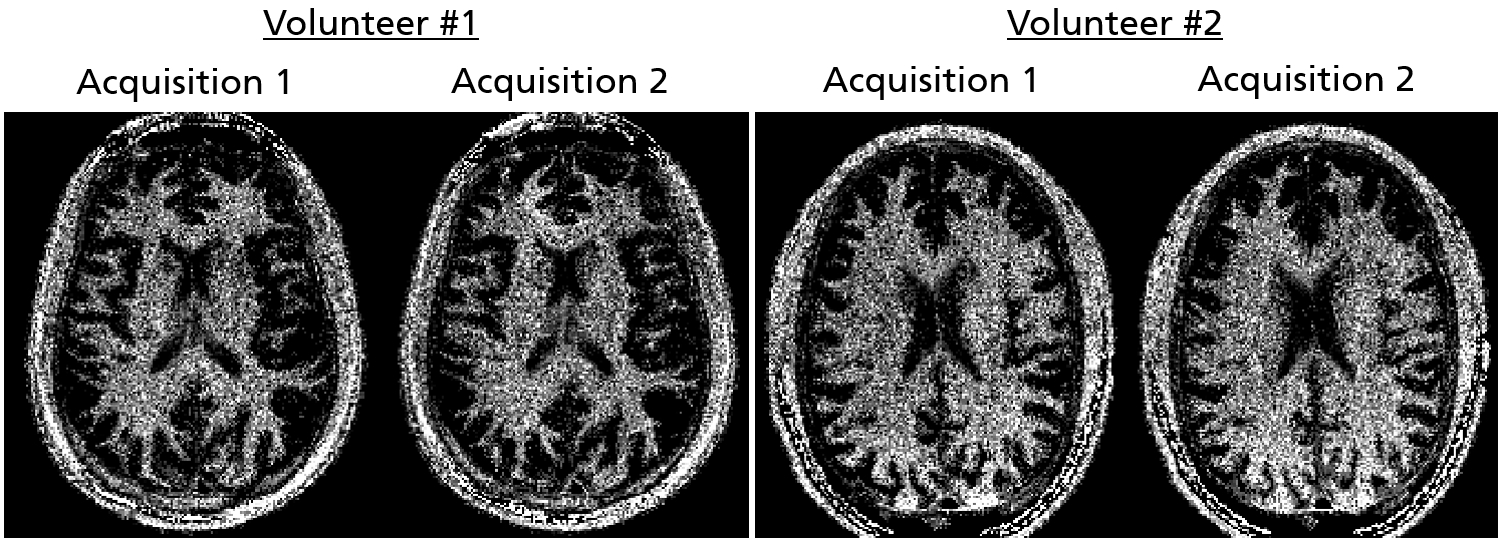
Figure 2 shows 4 exemplary time frames and also the resulting calculated parameter maps for T1, T2 and PD assuming a mono-exponential behavior. In Figure 3, an exemplary voxel is highlighted together with its corresponding T1* spectrum. Specific T1* ranges are marked myelin/fat, white matter, gray matter and CSF. The gray scale values in the generated tissue maps approximate the amount of spins in this voxel. The measured T1* values of myelin with 155±20 ms are in good agreement regarding literature values of myelin (T1 = 400 ms, T2 = 20 ms) and the used flip angle of 35° (see equation in methods section). Figure 4 illustrates the stability of the short component maps from two volunteers.Discussion & Conclusion
The generation of brain-component-maps can be very valuable especially for neurological applications. Short-living components like myelin are considered an essential indicator for various neurodegenerative diseases, like multiple sclerosis, but also hereditary diseases of brain metabolism. To make it suitable for the clinical routine, a further scan time reduction has to be achieved. On the one hand this could be a higher acceleration for 2D sampling or on the other hand an appropriate 3D acquisition scheme. A comparison to other myelin mapping approaches (e.g. VISTA5) is considered for future investigations. Compared to T2 mapping techniques, the proposed technique has the advantage, that T1* is much longer than T2 while the echo spacing is relatively short (e.g. TR = 4 ms).
In conclusion, IR TrueFISP is not only able to provide quantitative parameter maps but can also visualize individual brain components including myelin even in the presence of multiple tissue types within a voxel.
Acknowledgements
The authors thank the German Research Foundation (DFG BR 4356 4-1) for financial support.References
1. Schmitt P, et al. Inversion Recovery TrueFISP: Quantification of T1, T2 and Spin Density. MRM 2004; 51:661–667.
2. Pfister J, et al. Simultaneous T1/T2 measurements in combination with PCA-SENSE reconstruction (T1* shuffling) and multicomponent analysis. Proc. ISMRM 2017; #452.
3. Hargreaves B and Nishimura DG. Relaxometry using Transient Steady-State Free Precession Imaging. Proc. ISMRM 2003; p.1100.
4. Tamir JI, et al. T2 Shuffling: Sharp, Multicontrast, Volumetric Fast Spin-Echo Imaging. MRM 2017; 77:180-195.
5. Oh SH, et al. Direct visualization of short transverse relaxation time component (ViSTa). NeuroImage 2013; 83:485-492.
Figures