0686
Mapping water exchange across the blood-brain barrier using three-dimensional diffusion-prepared arterial spin labeled perfusion MRI1Laboratory of FMRI Technology (LOFT), Mark & Mary Stevens Neuroimaging and Informatics Institute, Los Angeles, CA, United States, 2Department of Neurology, Keck School of Medicine, University of Southern California, Los Angeles, CA, United States
Synopsis
We present a novel pulse sequence and modeling algorithm to quantify the water exchange rate (kw) across the BBB without contrast, and to evaluate its clinical utility in a cohort of elderly subjects at risk of cerebral small vessel disease (SVD). A diffusion preparation module was integrated with pseudo-continuous ASL (pCASL) with background suppressed 3D GRASE readout. The results showed good reproducibility of kw measurements (ICC=0.75) in elderly subjects with repeated scans ~2 weeks apart. Average kw was increased in subjects with diabetes and hypercholesterolemia, and was correlated with vascular risk factors, cognitive function and white matter hyperintensities.
Background
Accumulating evidence suggests that the blood-brain barrier (BBB) has limited permeability to water molecules.1 Since water molecules have a small molecular weight, assessing BBB water permeability could provide a more direct and sensitive biomarker of BBB function at the early stage of disease progression, compared to gadolinium based contrast agents (GBCAs). The purpose of this study was to present a new pulse sequence with diffusion prepared pseudo-continuous ASL (pCASL) with 3D gradient and spin echo (GRASE) readout. The test-retest reproducibility was evaluated with repeated scans approximately 2 weeks apart. The clinical utility for detecting subtle changes of BBB permeability was evaluated by performing the proposed sequence in a cohort of elderly subjects at risk of cerebral small vessel disease (SVD) through correlations of water permeability with known risk factors and behavioral phenotypes of SVD.Methods
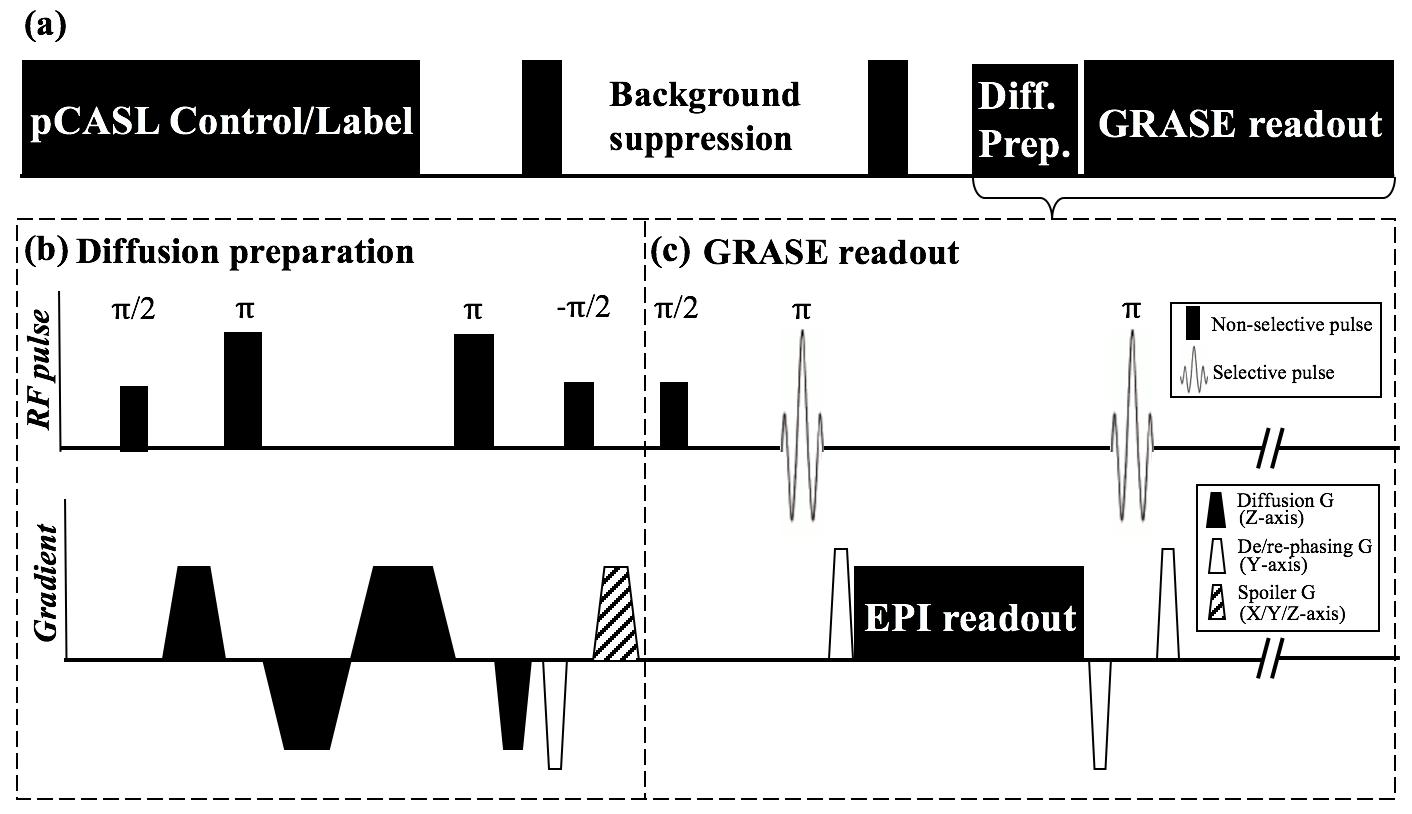
Figure 1 (a) shows the sequence diagram. Diffusion preparation was implemented by non-selective pulses and bipolar gradients along z-direction with their timing optimized to minimize the eddy current.2 The non-CPMG component of DW pCASL signal was eliminated by applying a de-phasing gradient as proposed by Alsop3 (Figure 1(b,c)). Imaging parameters were: FOV=224mm, matrix size=64×64, 12 slices (10% oversampling), resolution=3.5×3.5×8 mm3, turbo factor=14, EPI factor=64, bandwidth=3125Hz/pixel, TE=36.5ms, TR=4000ms, label/control duration=1500ms. A 2-stage approach was employed6: 1) PLD=900ms and b=0,14 s/mm2 for FEAST scan (15 measurements, TA=4min); and 2) PLD=1800ms and b=0,50 s/mm2 for kw measurement (20 measurements, TA=5min20sec).
The single-pass approximation (SPA) was applied to fit the water exchange rate (kw) by estimating pCASL signals in the capillary/brain tissue compartments. To minimize spuriously high kw due to noise, a novel total generalized variation (TGV)4 regularized SPA modeling algorithm was applied for estimating ATT and kw, based on DW pCASL data acquired at two PLDs with respective b values:
$$argmin_{\tiny{ATT,ATT'}}\large[\small\frac{1}{2\lambda}||ATT-g(\frac{\tiny\triangle \small M_{b_{ATT}}^{900}}{\tiny\triangle \small M_{0}^{900}})||_2^2+\alpha_1|\triangledown ATT-\triangledown ATT^{'}|_1+\frac{\alpha_0}{2}|\triangledown ATT^{'}-\triangledown ATT^{'T}|_1\large]\small...[1]$$
$$argmin_{\tiny{kw,kw'}}\large[\small\frac{1}{2\lambda}||kw-f(1-\frac{\tiny\triangle \small M_{b_{DW}}^{1800}}{\tiny\triangle \small M_{0}^{1800}},ATT)||_2^2+\alpha_1|\triangledown kw-\triangledown kw^{'}|_1+\frac{\alpha_0}{2}|\triangledown kw^{'}-\triangledown kw^{'T}|_1\large]\small...[2]$$
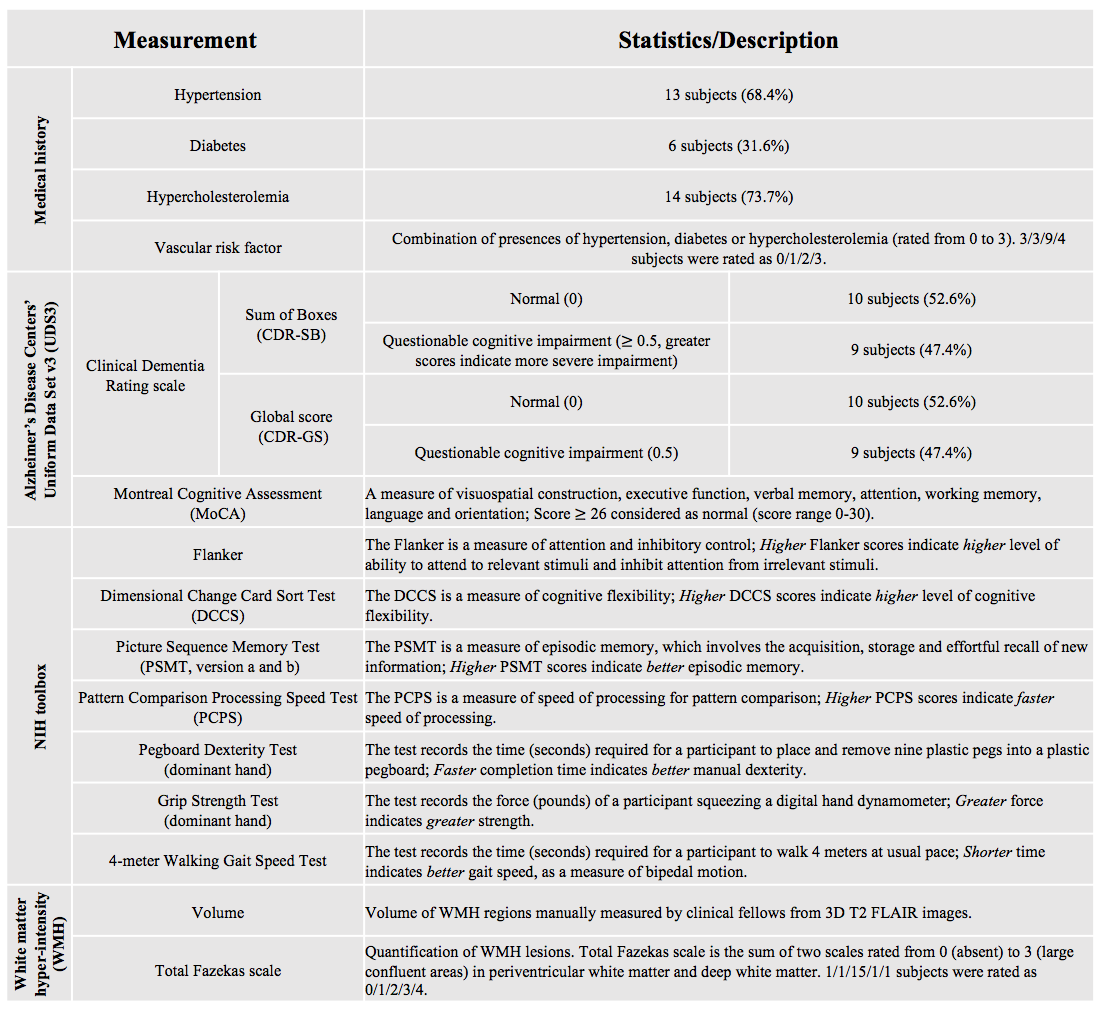
where $$$\tiny\triangle \small M_{b-value}^{PLD}$$$ is ASL signal with PLD and b-value indicated by superscript and subscript. Vascular signal was suppressed with bATT=14s/mm2 (VENC=7.5mm/s) at PLD=900ms,5 and tissue/capillary fraction of the ASL signal at PLD=1800ms was separated by bDW=50s/mm2.6 Function g( ) calculates ATT based on the FEAST technique5 and f( ) describes the monotonic relationship between kw and the capillary fraction at a given ATT.6 λ= 0.05 is the weighting factor balancing data fidelity and TGV penalty function, while α1=1 and α0=2, balances between the first and second derivative of ATT and kw maps.4 Nineteen aged subjects (7 male, age=68.8±7.6 yrs) underwent two MRIs approximately 2 weeks apart on a Siemens 3T Prisma system (Erlangen, Germany) using a 20-channel head coil. Subjects underwent a physical exam, medical history evaluation and blood draw before the first MRI scan. Descriptions of clinical assessments are summarized in Table 1. Correlations between average kw from both test and retest scans and clinical/behavioral assessments were evaluated using mixed effects linear regression model incorporating age and gender as covariates and time (test/retest) as the random variable.
Results and discussion
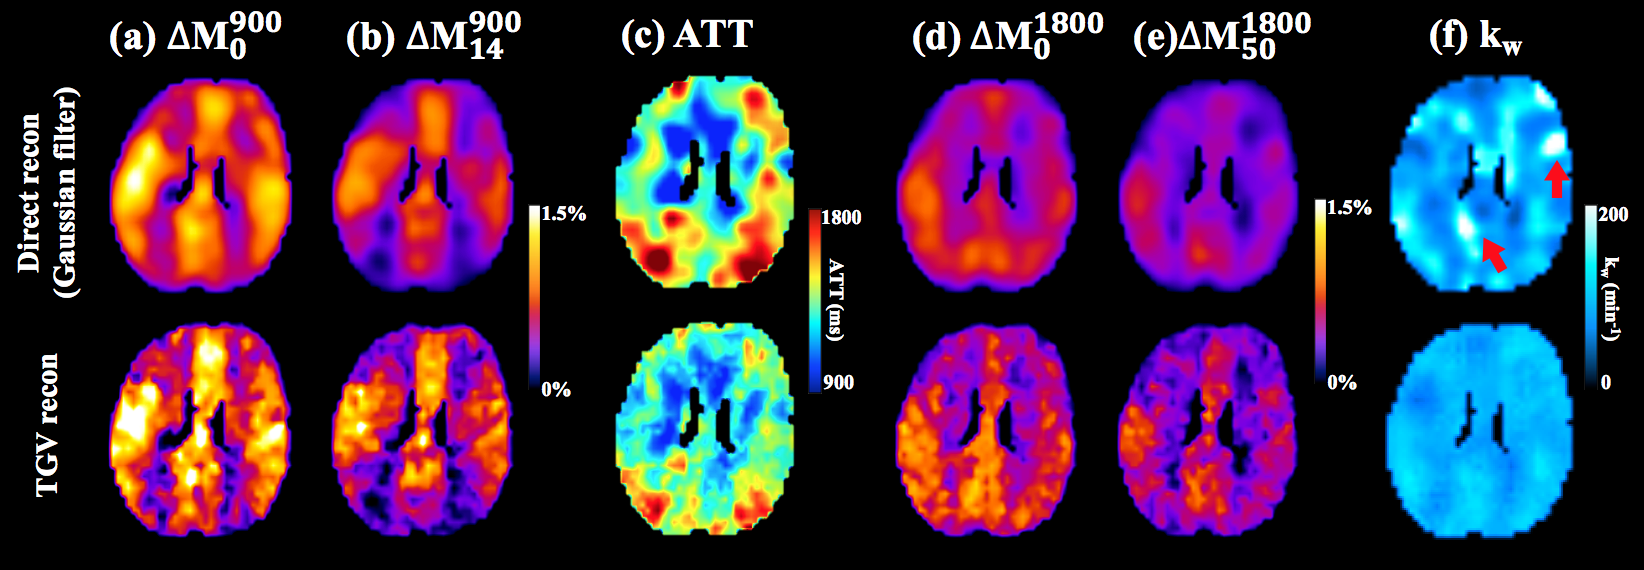
Figure 2 shows the comparison of ATT and kw maps estimated using direct SPA modeling and the proposed SPA modeling with TGV regularization respectively. TGV regularized SPA modeling preserved the original image resolution. The local bright regions (indicated by red arrows, kw>200 min-1) with spuriously high kw values in direct SPA modeling were suppressed by TGV regularized SPA modeling.
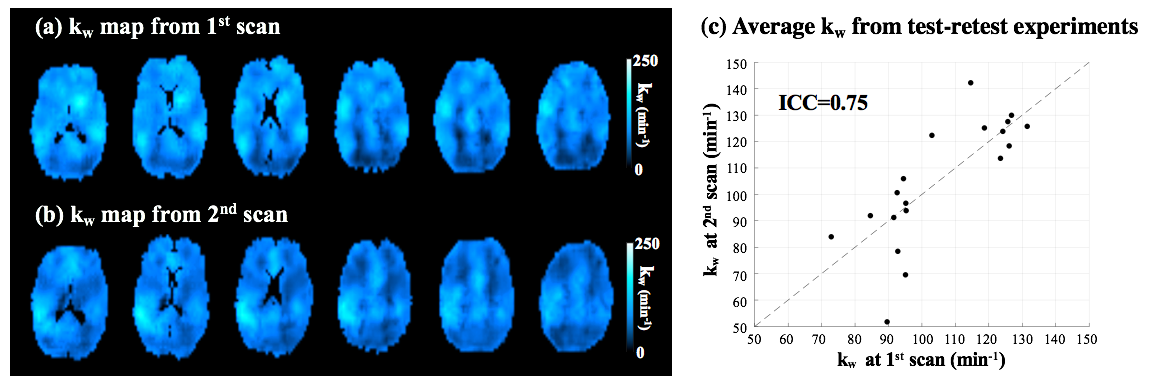
Figure 3 (a,b) shows six slices of kw maps from test-retest scans (global kw = 95.3 and 96.5 min-1) of one representative subject (Female,64yrs). Good test-retest reproducibility (ICC=0.75) was achieved for the proposed sequence across nineteen subjects. Average kw values from repeated scans were shown in figure 3 (c).
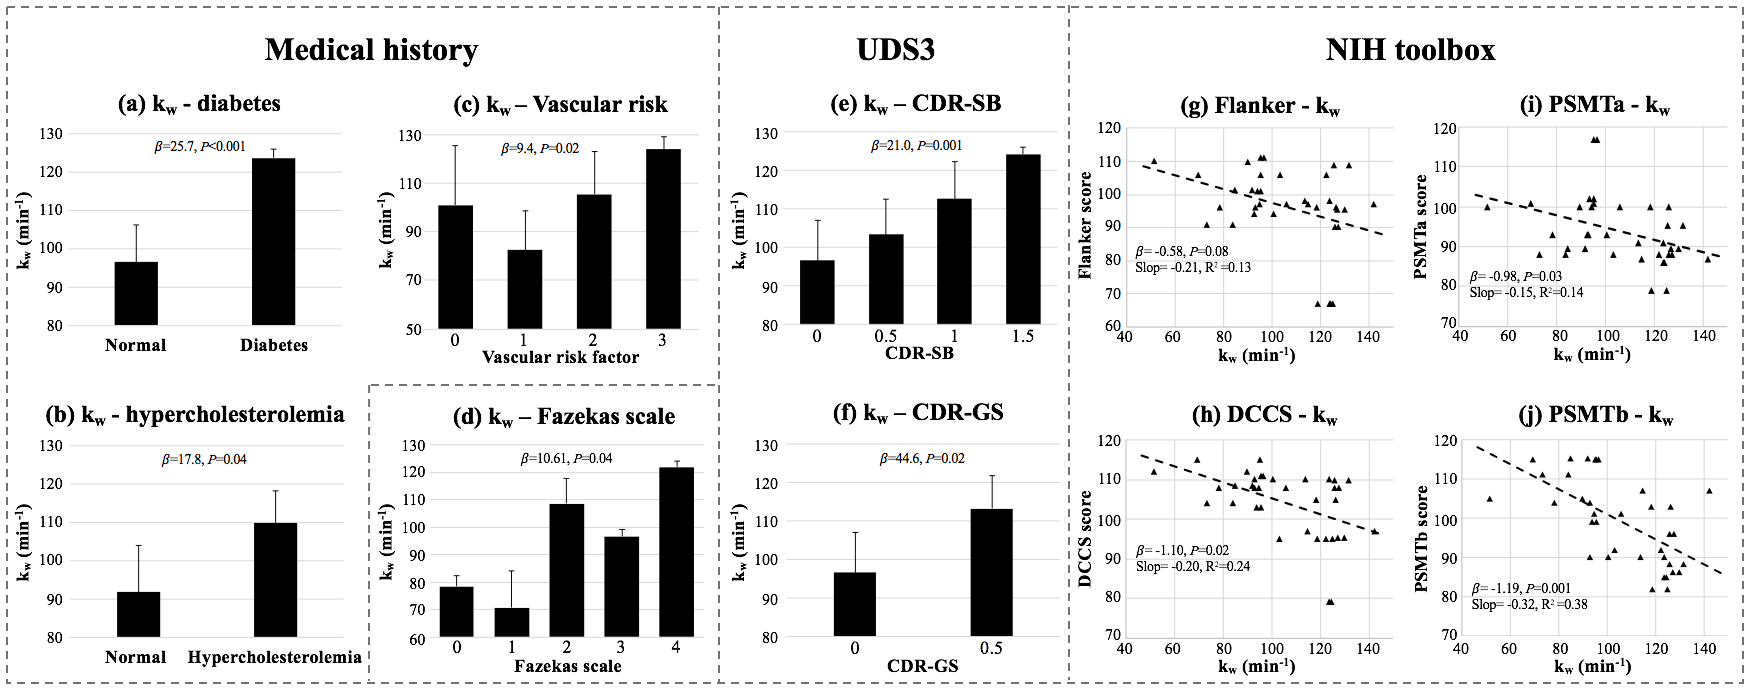
Increased kw was found in subjects with type 2 diabetes (β=25.7,P<0.001) (figure 4(a)) and hypercholesterolemia (β=17.8,P=0.04) (figure 4(b)), which is consistent with DCE-MRI7 and biochemical studies.8 Increased kw was found in subjects with higher vascular risk factors (β=9.4, P=0.02) (figure 4(c)). Both CDR scores were significant predictors of kw (CDR-GS: β=44.6,P=0.002; CDR-SB: β=21.0,P=0.001) (figure 4(e, f)), which indicates increased BBB permeability is associated with a greater severity of functional impairment. NIH toolbox measurements: DCCs (β=-1.10,P=0.02), PSMTa (β=-0.98,P=0.03) and PSMTb (β=-1.19,P=0.001) were significant correlated with kw, and a trend of negative correlation was found between Flanker and kw (β=-0.58,P=0.08) (figure 4(g-j)). kw was also significantly correlated with the Fazekas scale of WMH (β=10.61,P=0.04) (figure 4(d)), which indicates kw is associated with severity of WMH.
Conclusion
A diffusion prepared 3D GRASE pCASL sequence with TGV regularized SPA modeling was proposed to measure BBB water permeability non-invasively with good reproducibility. kw may serve as an imaging marker of cerebral SVD and associated cognitive impairment.Acknowledgements
This work was supported by National Institute of Health (NIH) grant UH2-NS100614.References
[1] Paulson OB. Blood-brain barrier, brain metabolism and cerebral blood flow. Eur Neuropsychopharmacol 2002;12(6):495-501.
[2] Reese T G, Heid O, Weisskoff R M, et al. Reduction of eddy‐current‐induced distortion in diffusion MRI using a twice‐refocused spin echo[J]. Magnetic Resonance in Medicine: An Official Journal of the International Society for Magnetic Resonance in Medicine, 2003, 49(1): 177-182.
[3] Alsop D C. Phase insensitive preparation of single‐shot RARE: Application to diffusion imaging in humans[J]. Magnetic resonance in medicine, 1997, 38(4): 527-533.
[4] Knoll F, Bredies K, Pock T, et al. Second order total generalized variation (TGV) for MRI[J]. Magnetic resonance in medicine, 2011, 65(2): 480-491.
[5] Wang J, Alsop D C, Song H K, et al. Arterial transit time imaging with flow encoding arterial spin tagging (FEAST)[J]. Magnetic resonance in medicine, 2003, 50(3): 599-607.
[6] St Lawrence K S, Owen D, Wang D J J. A two-stage approach for measuring vascular water exchange and arterial transit time by diffusion‐weighted perfusion MRI[J]. Magnetic resonance in medicine, 2012, 67(5): 1275-1284.
[7] Starr JM, Wardlaw J, Ferguson K, MacLullich A, Deary IJ, Marshall I. Increased blood-brain barrier permeability in type II diabetes demonstrated by gadolinium magnetic resonance imaging. J Neurol Neurosurg Psychiatry 2003;74(1):70-76.
[8] Acharya NK, Levin EC, Clifford PM, Han M, Tourtellotte R, Chamberlain D, Pollaro M, Coretti NJ, Kosciuk MC, Nagele EP, Demarshall C, Freeman T, Shi Y, Guan C, Macphee CH, Wilensky RL, Nagele RG. Diabetes and hypercholesterolemia increase blood-brain barrier permeability and brain amyloid deposition: beneficial effects of the LpPLA2 inhibitor darapladib. J Alzheimers Dis 2013;35(1):179-198.
Figures