0683
Constant gradient magnetic resonance elastography experiments on phantom and bovine liver.1Univ Lyon, INSA‐Lyon, Université Claude Bernard Lyon 1, UJM-Saint Etienne, CNRS, Inserm, CREATIS UMR 5220, U1206, Lyon, France, 2Université de Toulouse, CNRS, INPT, UPS, IMFT, Toulouse, France, 3Department of Chemistry, Technische Universität München, Munich, Germany, 4ICB, CNRS UMR6303, Université de Bourgogne, Dijon, France
Synopsis
Magnetic Resonance Elastography (MRE) is performed by the application of motion-sensitive gradients. In this study, RF pulses are designed with an optimal control algorithm to obtain a desired magnetization phase distribution. Such pulse, in presence of a constant gradient, allows to simultaneously perform spatially selective excitation and motion encoding. This offers some advantages when compared to standard MRE encoding strategy. Simulations, phantom and ex vivo experiments show that phase-to-noise ratios are improved. These results demonstrate that optimal control-based pulses can be used to encode motion in the MRE excitation phase with relevant advantages for further in vivo liver rat studies.
Introduction
MRE has become a valuable technique to quantify mechanical properties of tissues based on the characteristics of shear waves propagation. Conventionally, motion encoding gradients are applied between RF excitation and signal acquisition yielding phase images that depict the propagation of the shear wave1. The drawback of this technique is a longer echo-time and thus a degraded SNR. For that purpose, we propose to use a single RF excitation pulse that could simultaneously enable the slice selection and the motion encoding in the phase of the MR signal while also maximizing its norm. To this end, we use the optimal control (OC) formalism to design this RF pulse.
Methods
The application of optimal control theory to MRE consists in designing OC RF pulses which manipulate the magnetization ($$$\vec{M}$$$), whose evolution is governed by Bloch equations, towards a target state in which the isochromats phase is directly linked to the phase of the wave motion they are experiencing2 while also taking into account the T2 so as to maximize the transverse magnetization. The OC pulse computation is performed with the GRAPE algorithm3.
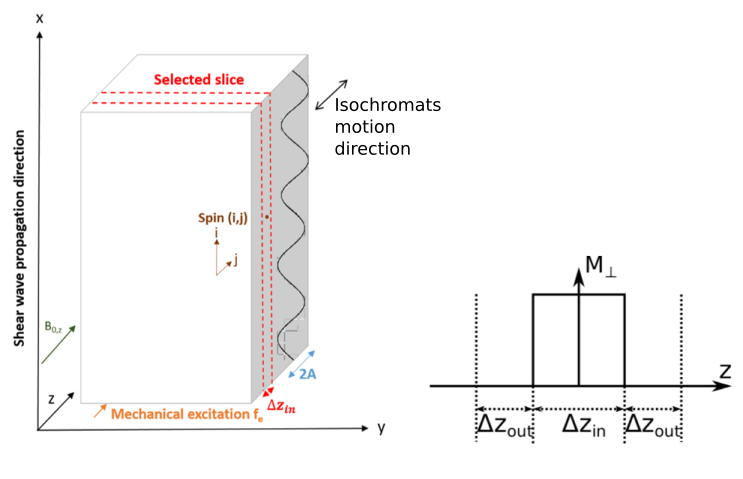
In the OC MRE
strategy, the RF pulse is applied simultaneously with a constant gradient.This imposes slice
selectivity4 by considering
isochromats located at different positions in the slice ($$$z^{(j)}$$$). Consequently to the
application of the constant gradient G and sinusoidal shear wave motion at
frequency $$$f_e$$$, static field variations experienced by an isochromat in position $$$θ^{(i)}$$$ along the propagating shear wave and $$$z^{(j)}$$$ in the slice direction are given:
$$ΔB_0^{(i,j)}(t)=G(Asin(-2πf_et+θ^{(i)})+z^{(j)})$$
Different target states will be attributed whether an isochromat is located in ($$$Δz_{in}$$$) (the selected slice) or in ($$$Δz_{out}$$$), as illustrated in Fig. 1.
$$ \vec{T}^{(i,j)}=ρ(CosΦ^i,SinΦ^i,0) ~~ if ~~ j\inΔz_{in}$$
$$ \vec{T}^{(i,j)}=(0,0,1) ~~ if ~~ j\inΔz_{out}$$
The defined cost function :
$$ C=\sum_{j=1}^{J}\sum_{i=1}^{N}\parallel\vec{M}^{(i,j)}(t_f)-\vec{T}^{(i,j)}\parallel^2$$
requires minimizing the difference between final magnetization state ($$$\vec{M}^{(i,j)}$$$) and target state ($$$\vec{T}^{(i,j)}$$$) of the $$$(i,j)$$$ spin ensemble.
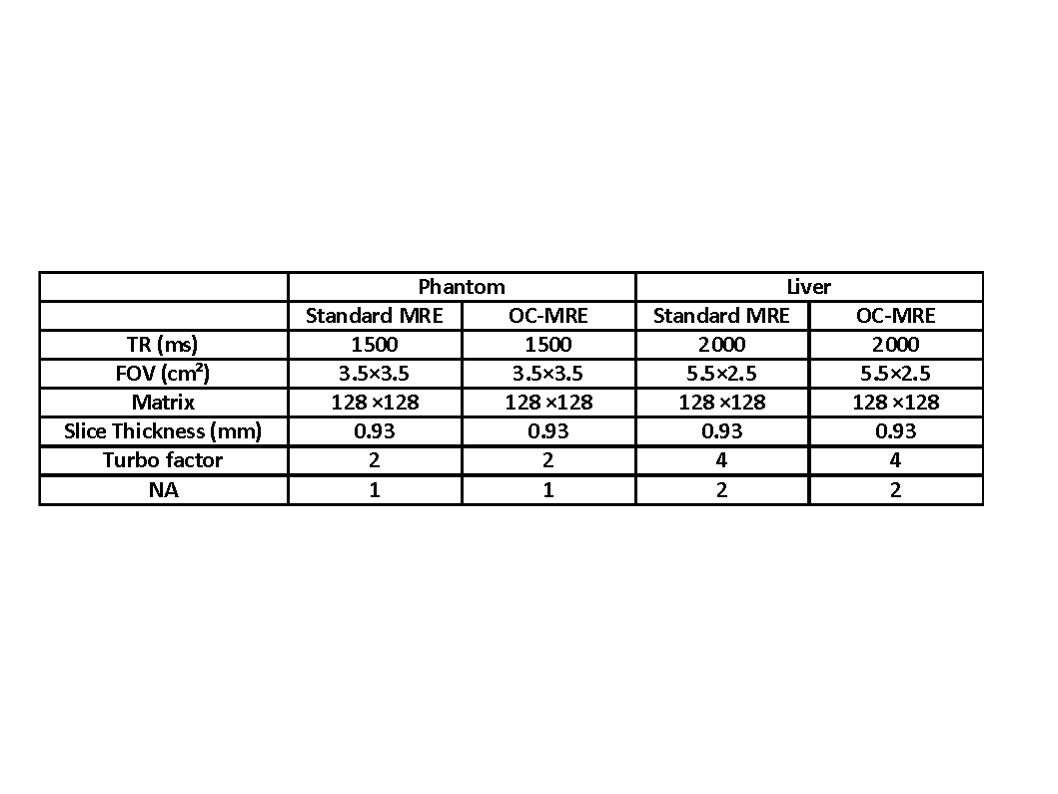
The OC-MRE strategy was compared to standard MRE, through phantom and ex vivo MRE experiments. MRI measurements were run on a Bruker 4.7 T small-animal MRI-system, with a 70mm inner diameter volume coil. Shear waves were generated using a piezoelectric actuator (CEDRAT Technologies). Phantom experiments were carried out on a 100% plastisol (suspension of polyvinyl chloride particles in a liquid plasticizer) phantom5 whose relaxation times [T1, T2] = [300, 25] ms. Ex-vivo experiments were performed on a piece of bovine liver; relaxation times [T1, T2] = [650, 30] ms. The OC-pulse was optimized for an excitation frequency of 400Hz, a T2=20ms and a duration of 13.8ms. We used a RARE MRI sequence with parameters described in table 1. For the standard MRE, a conventional RARE MRE sequence was used, with an equal number of sinusoidal gradient periods (NG = 2,4,6,8 for phantom and 2,4 for ex-vivo) before and after the refocusing pulse.
Results
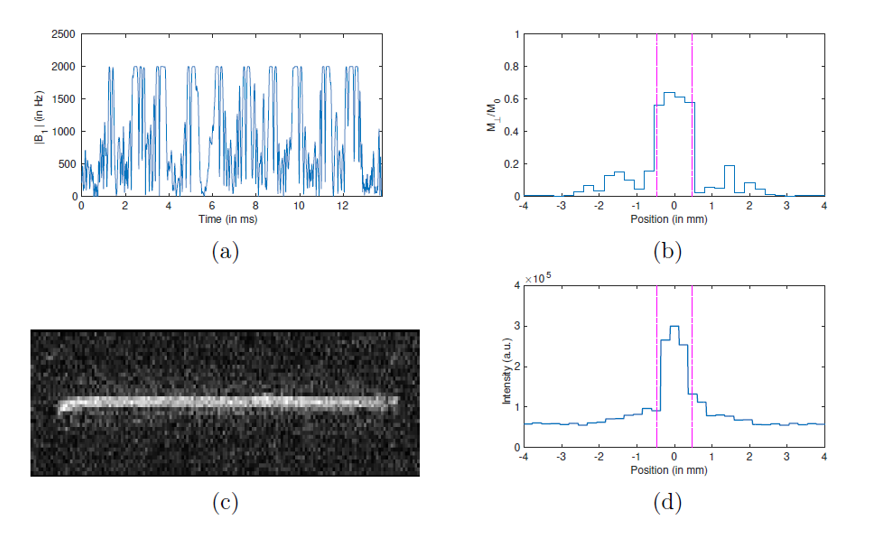
Fig. 2. illustrates
the B1 pulse magnitude obtained and the corresponding simulated and
experimentally measured slice profiles demonstrating correct in-slice
homogeneity and selectivity.
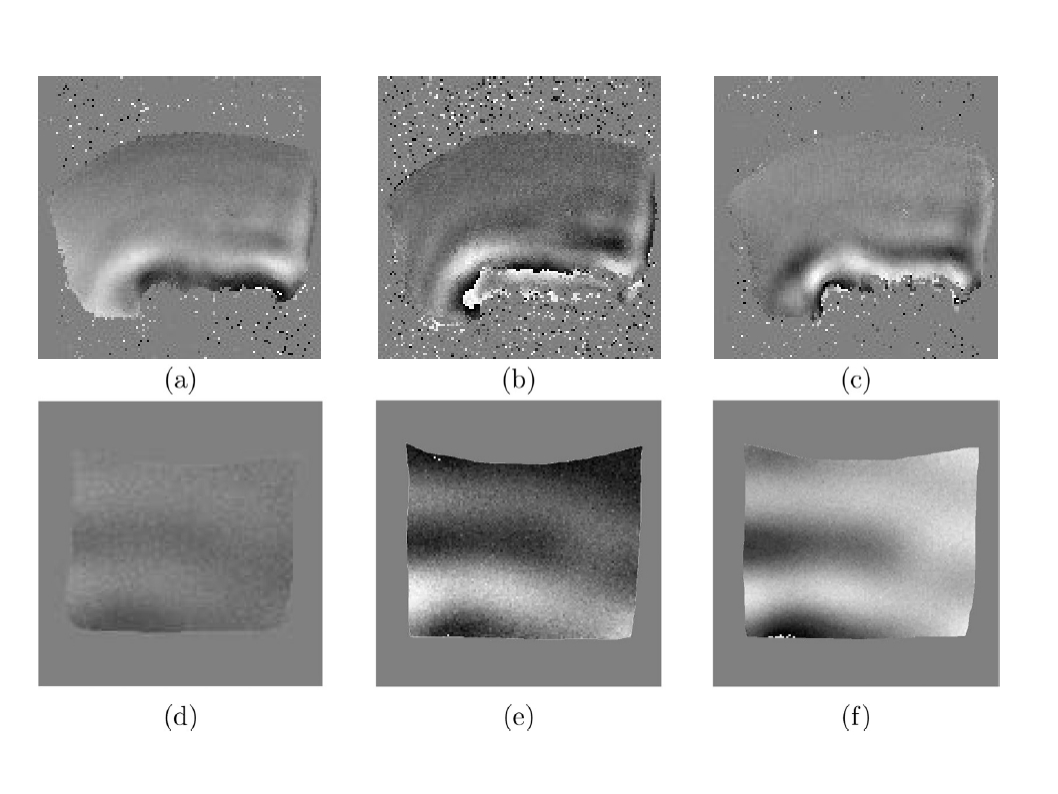
Fig. 3. illustrates
the phase images obtained on ex-vivo
and phantom experiments.
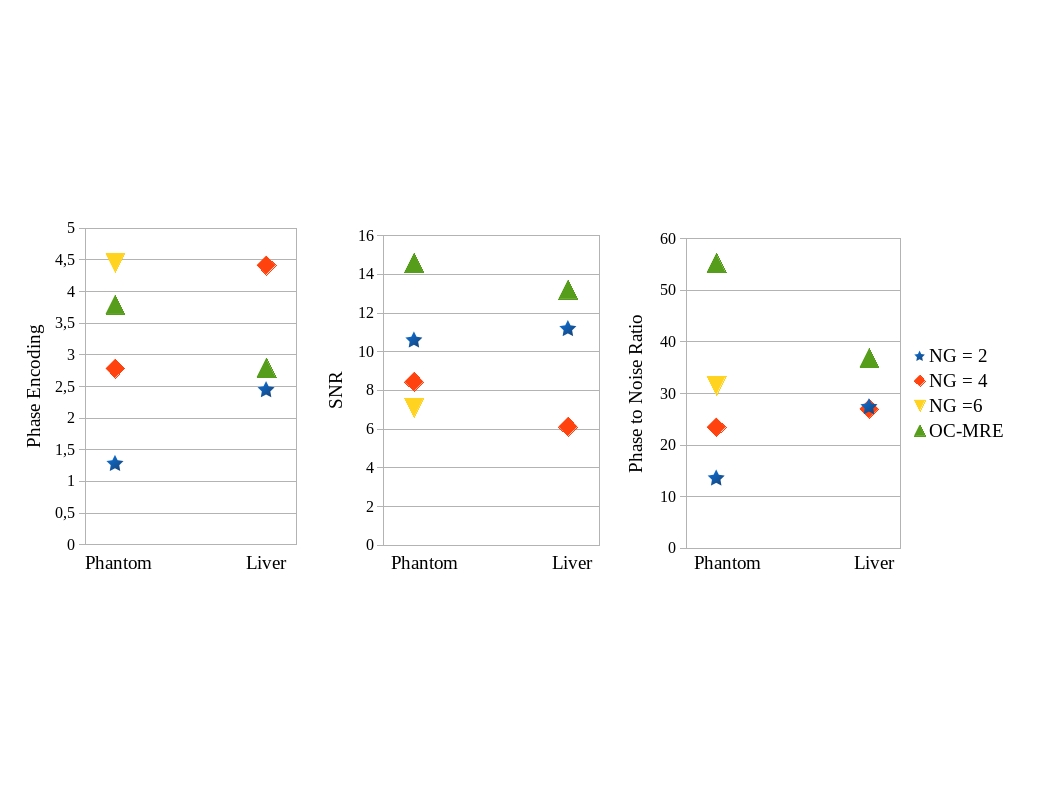
Fig. 4. compares phantom
and ex vivo, standard and OC-MRE acquisitions.
For standard acquisitions, increasing NG increases the phase
encoding (Δ) but decreases SNR. Computing a phase-to-noise ratio; PNR=Δ×SNR, accounts simultaneously for both. For phantom experiments,
the OC-MRE produces good values of Δ while yielding the best SNR
resulting in higher PNR. Furthermore, despite the difference between liver’s T2
and the optimized T2, ex-vivo OC-MRE
results show that OC-MRE still outperforms standard MRE.
Conclusion and Discussion
A new encoding
strategy of the shear wave propagation, by simultaneously applying a tailored
RF pulse and a constant gradient was demonstrated. The RF pulse, which
simultaneously performs frequency selective excitation and motion encoding thus
allows extremely short echo times. Phantom and ex-vivo measurements demonstrate the ability of the OC-pulse to
outperform standard MRE even when T2 values are different from the optimized
one (which would have been a limiting factor for future applications). Future
work will focus on investigating multi-frequency excitation and pre-clinical in vivo studies on rat livers will be
conducted to evaluate the encoding improvement of OC MRE.
Acknowledgements
We acknowledge support from the ANR-DFG research program Explosys (Grant No. ANR-14-CE35-0013-01; GL203/9-1) and from the Technische Universität München Institute for Advanced Study, funded by the German Excellence Initiative and the E. U. Seventh Framework Programme under Grant No. 291763. This work was performed within the framework of the LABEX PRIMES (ANR-11-LABX-0063/ANR-11-IDEX-0007). Experiments were performed on the PILoT imaging platform, member of France Life Imaging network (grant ANR-11-INBS-0006).References
1. Muthupillai R, Lomas D, Rossman P, Greenleaf J, Manduca A, Ehman R. Magnetic resonance elastography by direct visualization of propagating acoustic strain waves. Science 1995; 269:1854–1857.
2. Lefebvre PM, Van Reeth E, Ratiney H, et al. Active control of the spatial MRI phase distribution with optimal control theory. Journal of Magnetic Resonance 2017; 281:82–93.
3. Khaneja N, Reiss T, Kehlet C, Schulte-Herbrüggen T, Glaser SJ. Optimal control of coupled spin dynamics: design of NMR pulse sequences by gradient ascent algorithms. Journal of Magnetic Resonance 2005; 172:296–305.
4. Vinding MS, Maximov II, Tošner Z, Nielsen NC. Fast numerical design of spatial-selective rf pulses in MRI using Krotov and quasi-Newton based optimal control methods. The Journal of Chemical Physics 2012; 137:054203.
5. Lefebvre PM, Tse Ve Koon K, Brusseau E, et al. Comparison of viscoelastic property characterization of plastisol phantoms with magnetic resonance elastography and high-frequency rheometry. In 2016 38th Annual International Conference of the IEEE Engineering in Medicine and Biology Society (EMBC). Orlando, FL, USA: IEEE; 2016:1216–1219.
Figures