0679
Accelerating Acquisition for the Reconstruction of Fiber Orientation Distribution Function Using Convolutional Neural Network1Center for Brain Imaging Science and Technology, Key Laboratory for Biomedical Engineering of Ministry of Education, College of Biomedical Engineering and Instrumental Science, Zhejiang University, Hangzhou, China, 2Department of Instrument Science & Technology, Zhejiang University, Hangzhou, China, 3Department of Imaging Sciences, University of Rochester, Rochester, NY, United States
Synopsis
Fiber orientation distribution function (fODF) is one of the key components for establishing brain connectivity maps. However, its reliable reconstruction usually requires a large number of diffusion weighted image (DWI) volumes leading to long acquisition time. Our previous study has shown the potential of multi-layer perceptron in recovering fODF directly from a small number of DWIs. In this study, we proposed a 3-dimentional convolution neural network to take the spatial correlation into consideration, allowing robust fODF reconstruction with up to eleven-fold reduction of number of DWIs. This method offers a new approach for fast fODF reconstruction which could facilitate its clinical applications.
Introduction
The Fiber Orientation Distribution Function (fODF) can be more reliably reconstructed by multi-shell, multi-tissue, constrained spherical deconvolution (MSMT-CSD)1, at the cost of long acquisition time. Inspired by the strong inference ability of neural network, our earlier study applied the multi-layer perceptron (MLP) to exploit down-sampled DWIs to directly reconstruct the fODF voxel-by-voxel, with promising preliminary results.2 However, the voxel-wise method may confront a constraint of low signal-to-noise ratio when a limited number of DWIs are used. Since there is spatial continuity, the spatial correlations may provide additional information for network learning. We herein propose to apply 3-dimentional convolution neural network (3D-CNN) in a regression manner to take the spatial information into consideration, improving the performance of the deep-learning based method for direct reconstruction of fODF.Method
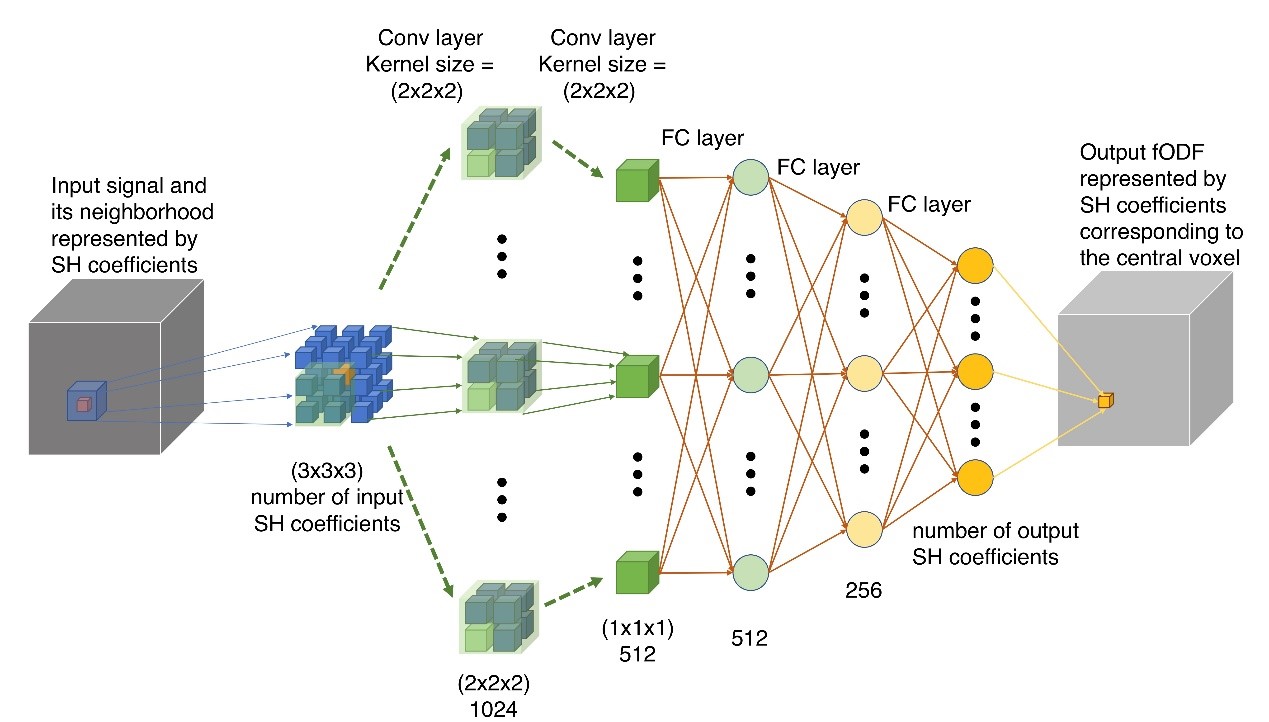
The method treats spherical harmonics (SH)-represented diffusion-weighted image (DWI) signals and fODF coefficients as inputs and outputs, respectively. A highest recommended order of 8 leading to 45 SH coefficients 3 was adopted for the output fODF. For input DWI signals, the highest order was utilized for each shell, and the SH coefficients were concatenated for all shells to generate as many coefficients as possible. The detailed network structure is depicted in Figure 1. The network width and depth were chosen as the setting of 1024-512-512-256, achieving a balance between the performance and the cost of time and space.
We conducted experiments on 30 randomly selected datasets from the database of the Human Connectome Project (HCP). The HCP datasets were acquired at a 1.25 mm isotropic resolution with the diffusion weighting of b = 1000, 2000, and 3000 s/mm2 applied in 90 directions in each shell, and additionally 18 b=0 s/mm2 images, resulting in a total of 288 DWIs.4 To evaluate the generalization capability of the proposed method, 24 subject datasets were used for training and the remaining 6 subjects were reserved for testing.
The performance of the proposed method was primarily compared to the super-resolved MSMT-CSD1 with decreasing number of DWIs. All MSMT-CSD reconstruction was performed in MRtrix (http://www.mrtrix.org/) using an unsupervised method.5 The fODFs reconstructed by MSMT-CSD from all available 288 DWIs were used as training labels and reference standard. The performance was quantitatively measured by the angular correlation coefficient (ACC)6 and the mean angular error (MAE) of all peaks. Finally, to validate the effectiveness of the learned fODFs, fiber tractography was conducted using extracted peaks from fODFs.7
Results
In general, the proposed method outperformed the MSMT-CSD in all investigated cases, with its advantage more obvious when a smaller number of DWIs were used.
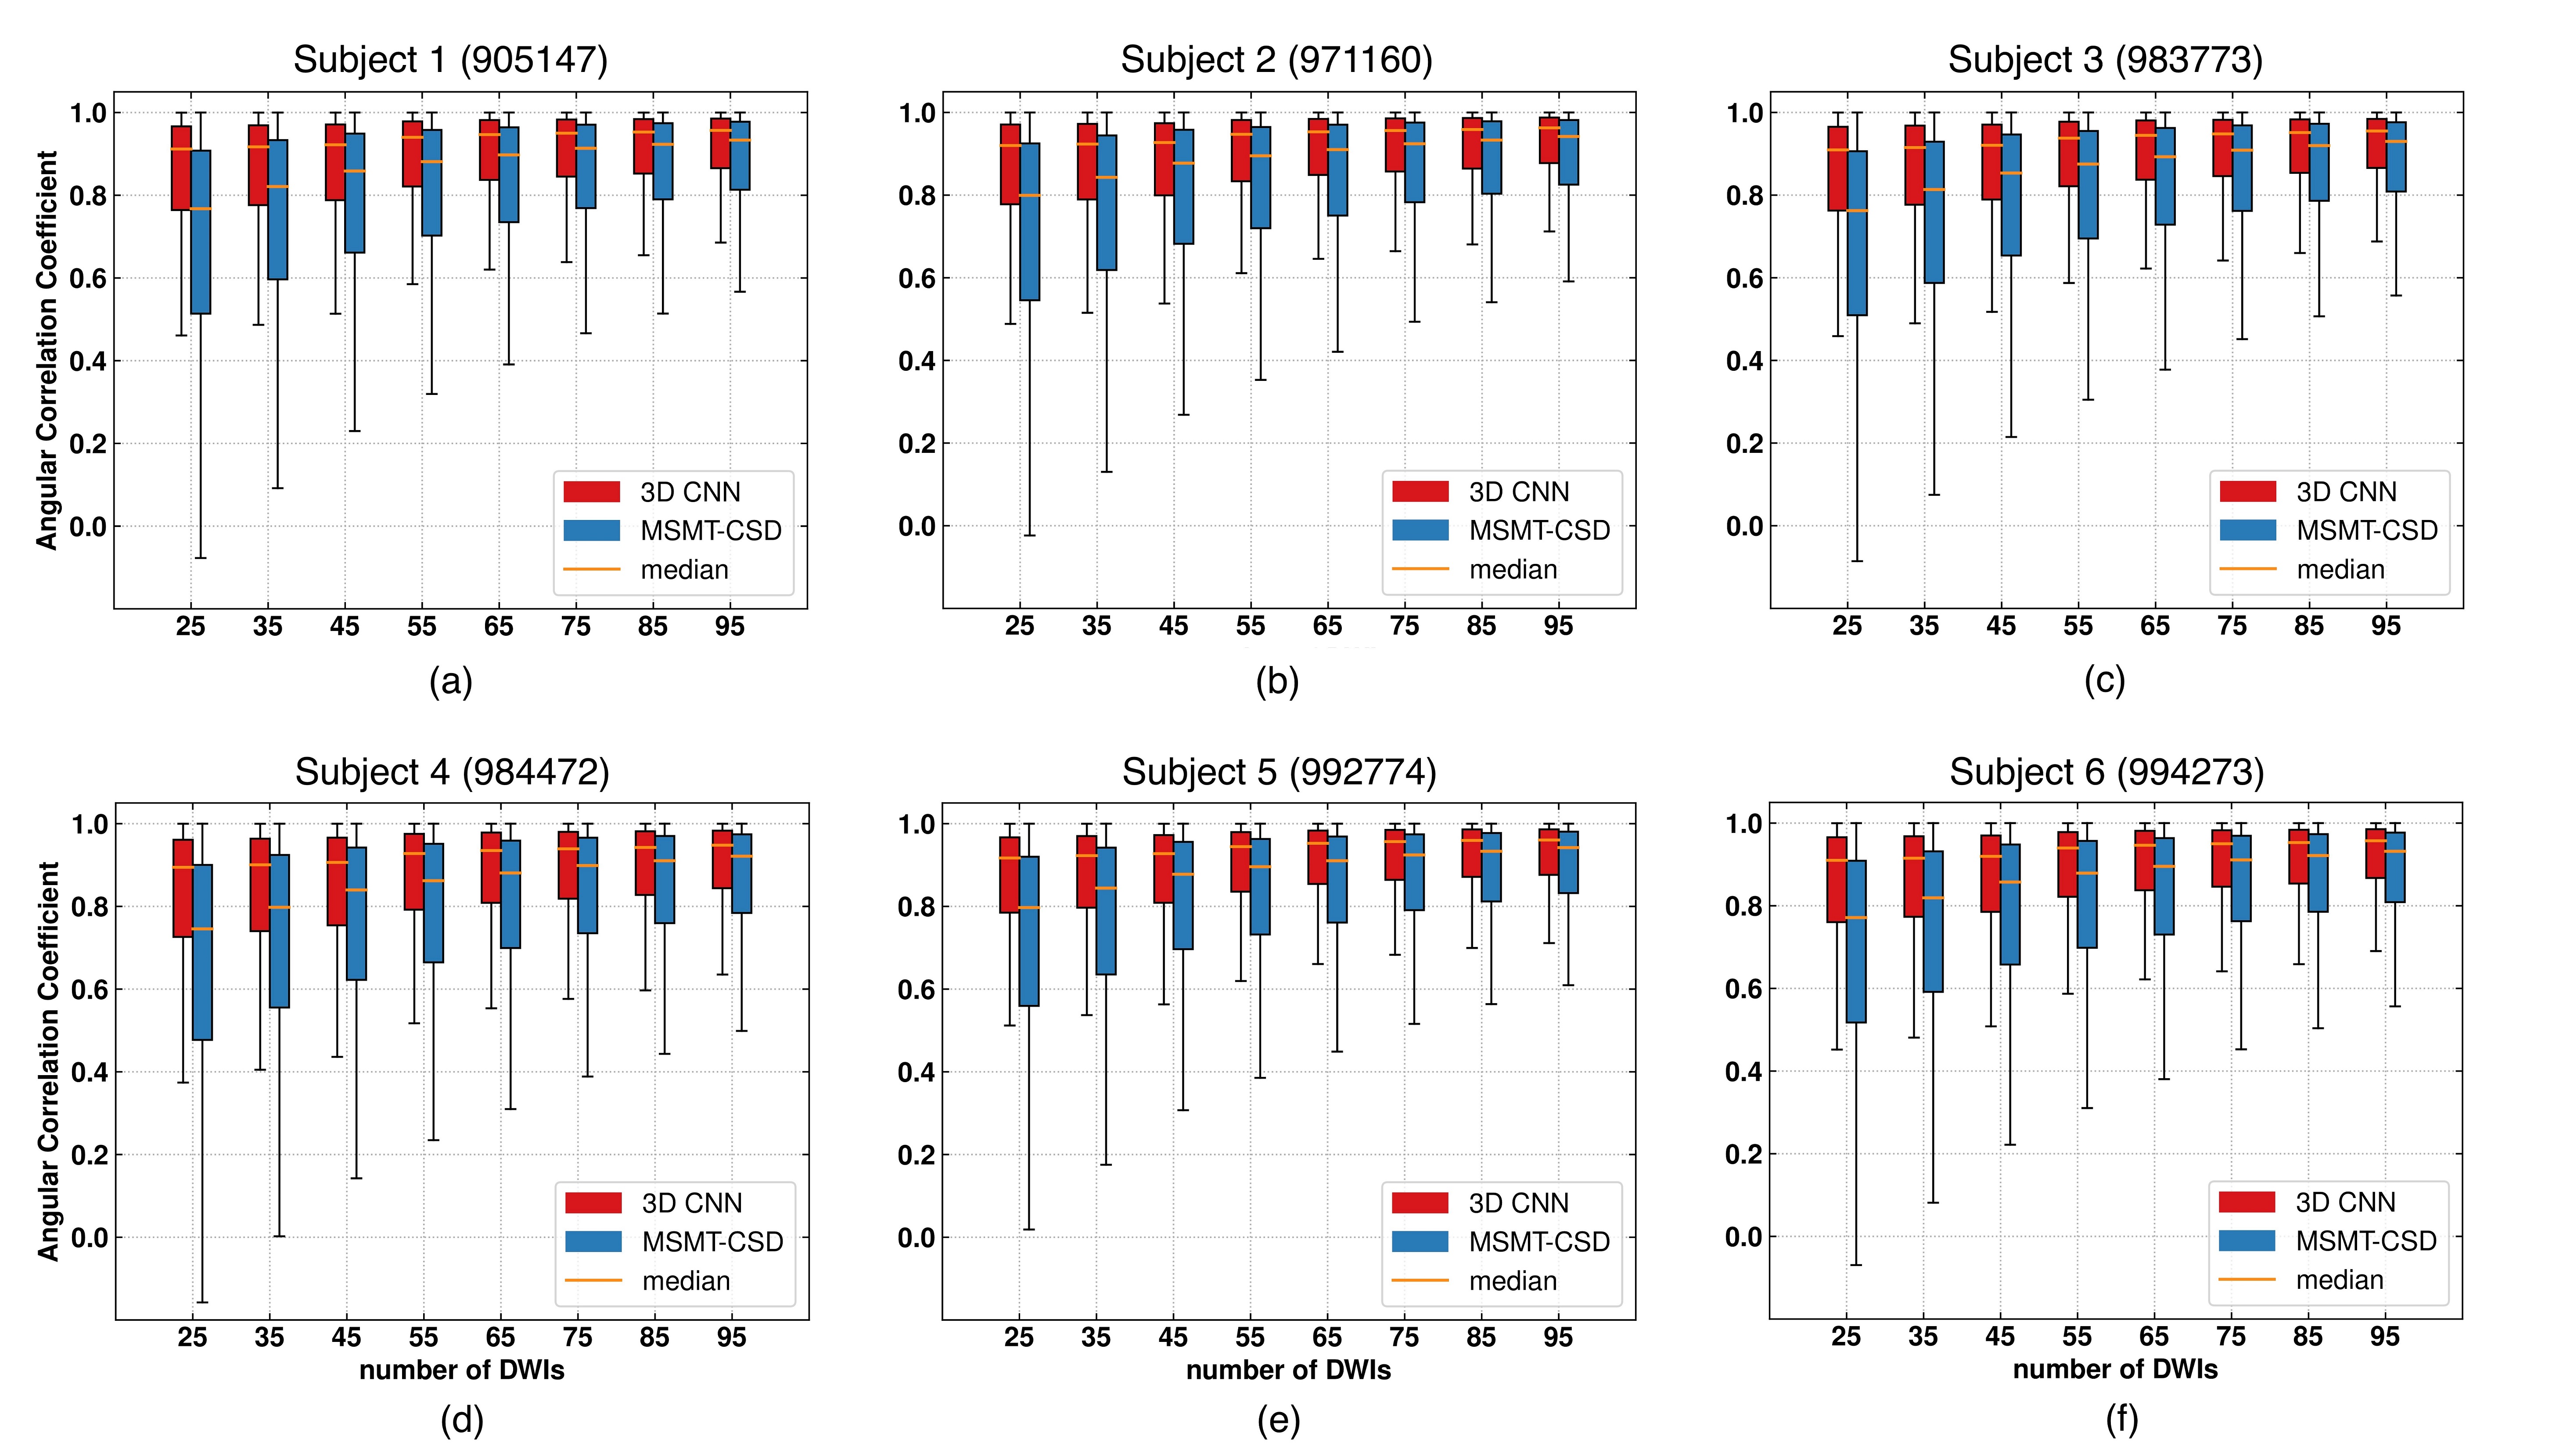
Figure 2: From average of the six subjects, the median ACC ranges from 0.96 to 0.91 for CNN, and 0.93 to 0.77 for MSMT-CSD (with perfect score of 1) when the number of DWIs was reduced from 95 to 25. The CNN reached a more concentrated average interquartile range (IQR) ranging from 0.20 to 0.12, whereas the MSMT-CSD reached 0.39 to 0.18.
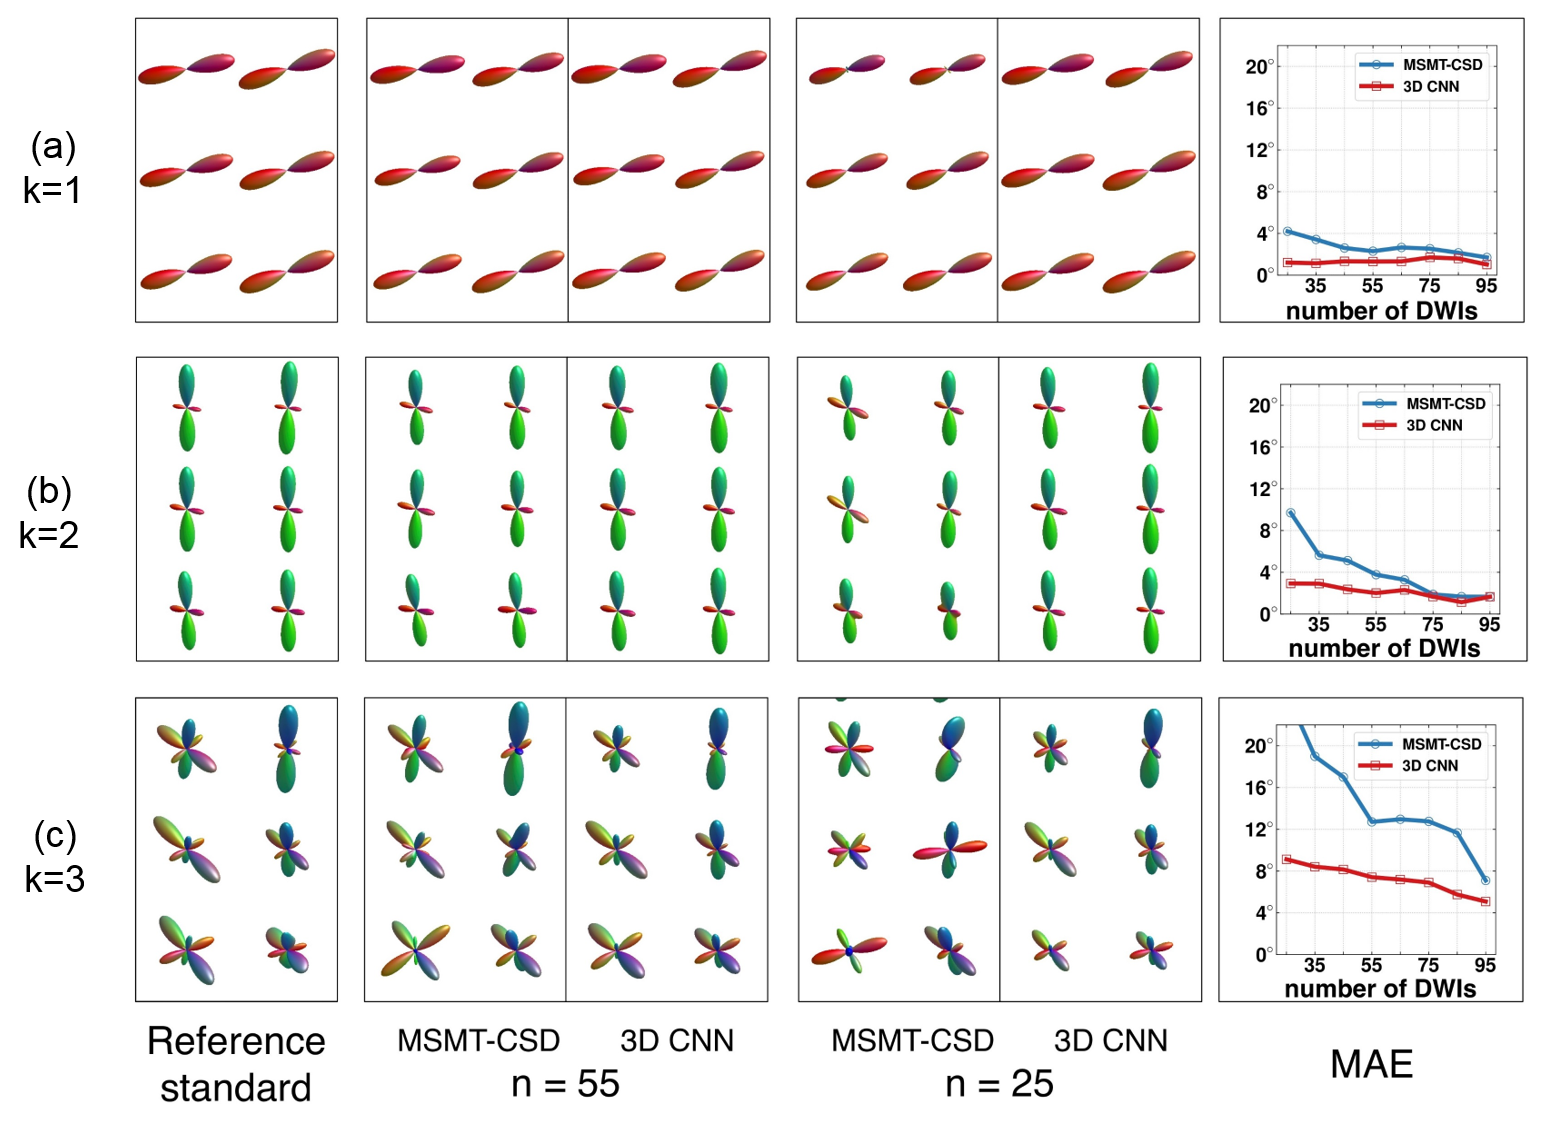
Figure 3: The average MAE for the CNN method in regions containing one, two, three fibers was respectively 1.09°, 2.75°, and 8.35° smaller than the MSMT-CSD method. The visual inception of the fODF further confirmed this superiority.
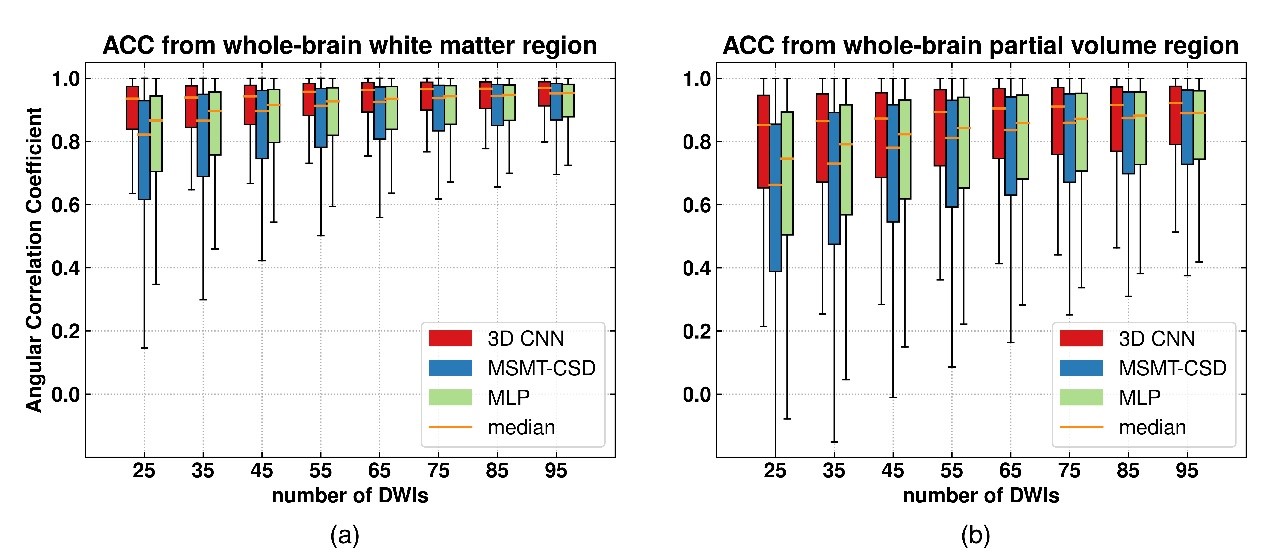
Figure 4: For multi-tissue assessment, the boxplots in pure white matter region and partial volume region show similar patterns to those of the whole brain ACC (Figure 2), with better performance in white matter region for all methods. Comparing to our previous study using MLP, 3D-CNN shows huge improvements especially when a limited number of DWIs were available.
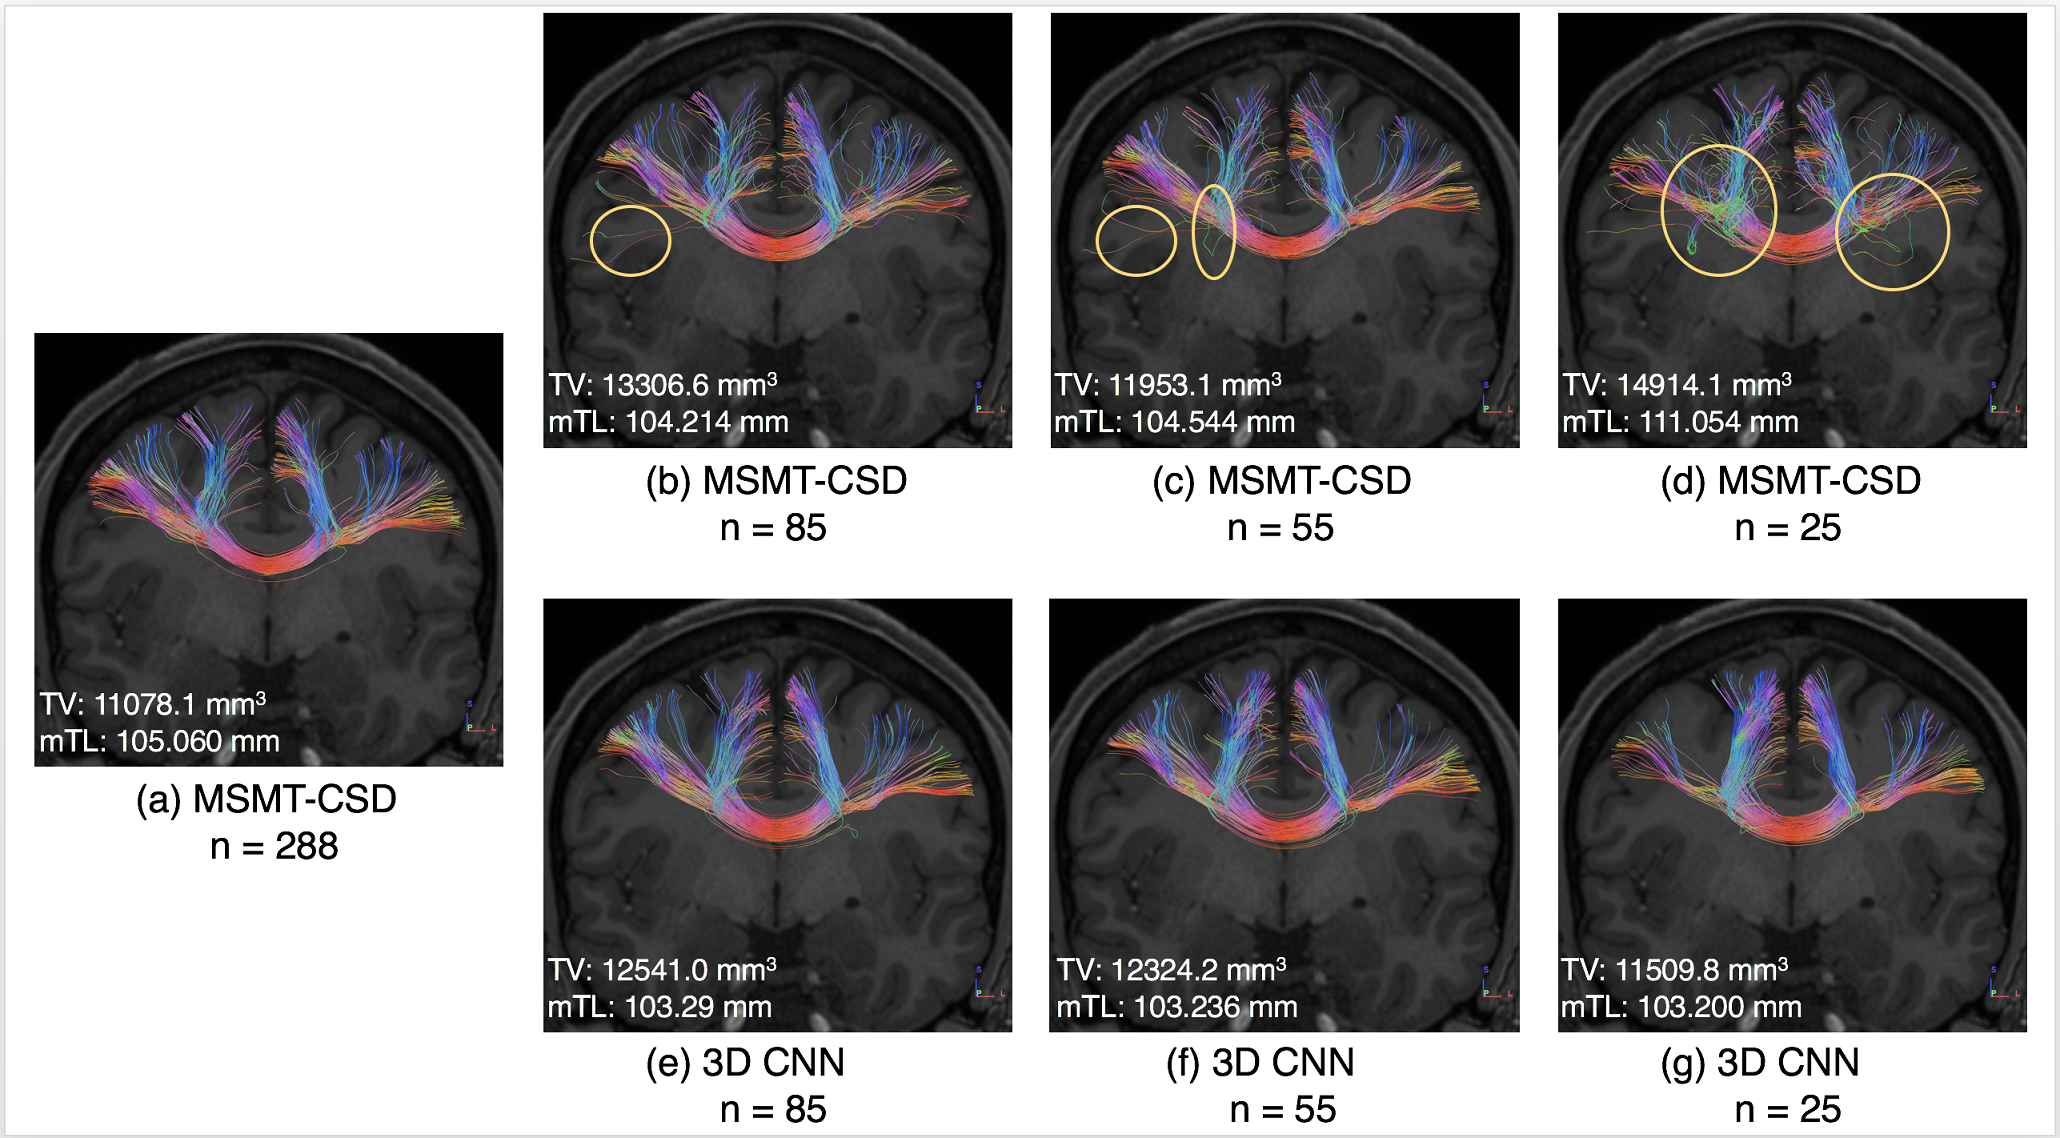
Figure 5: Finally, the tractography results were consistent with the previous fODF inspection in that more spurious and rotated peaks led to more meaningless tracts.
Discussion
The proposed method derives the SH representation of the DWI signals by least-squares linear fitting the amplitude data, which alleviates possible effect of inconsistent gradient schemes between training and testing dataset. However, this additional step may yield inevitable errors when very limited DWIs are used. One possible improvement is to obtain the SH representations by deep learning also. Hence, the network could learn the fODF from the raw DWI signals and the related b-values and DW directions directly in an end-to-end manner. The related research is ongoing.Conclusion
Experiments on HCP datasets demonstrated the feasibility of the proposed method in recovering fODFs from up to eleven-fold reduced number of DWIs. In terms of acquisition time in HCP protocol, this implies a reduction of scan time from approximately 59 minutes to 5 minutes. The proposed method exhibits promising potential in acquisition acceleration for the reconstruction of fODFs with good accuracy.Acknowledgements
We would like to acknowledge the support from National Key R&D Program of China (2017YFC0909200), NSFC (81871428, 91632109) and Shanghai Key Laboratory of Psychotic Disorders(13dz2260500).References
1. Jeurissen B, Tournier J, Dhollander T, et al. Multi-tissue constrained spherical deconvolution for improved analysis of multi-shell diffusion MRI data. NeuroImage, 2014: 411-426.
2. Gong T, He H, Lin Z, et al. Direct and Fast Learning of Fiber Orientation Distribution Function for Tractography. In: Joint Annual Meeting ISMRM-ESMRMB. Paris, France; 2018:6-8.
3. Tournier J, Calamante F, Connelly A, et al. Determination of the appropriate b value and number of gradient directions for high-angular-resolution diffusion-weighted imaging. NMR Biomed. 2013;26(12):1775-1786.
4. Van Essen DC, Ugurbil K, Auerbach E, et al. The Human Connectome Project: a data acquisition perspective. Neuroimage. 2012;62(4):2222-2231.
5. Dhollander T, Raffelt D, Connelly A. Unsupervised 3-tissue response function estimation from single-shell or multi-shell diffusion MR data without a co-registered T1 image. Proc. ISMRM Workshop on Breaking the Barriers of Diffusion MRI, vol. 5, 2016.
6. Anderson AW. Measurement of fiber orientation distributions using high angular resolution diffusion imaging. Magn Reson Med An Off J Int Soc Magn Reson Med. 2005;54(5):1194-1206.
7. Yeh F-C, Verstynen TD, Wang Y, et al. Deterministic diffusion fiber tracking improved by quantitative anisotropy. PLoS One. 2013;8(11).
Figures