0677
How to Generalize a Deep Learning Model to New Data Lacking Appropriate MR Inputs? An Exploration using Ultra-low-dose Amyloid PET/MRI1Stanford University, Stanford, CA, United States, 2University of Leipzig, Leipzig, Germany
Synopsis
When generalizing a deep learning model to data acquired from different sites, non-harmonized protocols might result in missing or different data for use as model inputs. For an ultra-low-dose amyloid PET/MRI network we trained previously and wish to apply to other data, protocol differences resulted in missing MRI data and different PET image qualities. In this project we showed that structurally similar contrasts for substitution is a viable alternative in the case of missing input data and that noise reduction was observed when applying the network on any of the low-dose PET images.
Introduction
Previously, we have demonstrated the ability to reduce radiotracer dose by 100-fold using deep learning approaches for 18F-florbetaben amyloid studies acquired on an integrated PET/MRI scanner with time-of-flight capabilities (Signa PET/MRI, GE Healthcare; “Scanner 1”)1. Such methods should ideally be transferable directly to PET scans acquired from different PET/MRI scanner models (resulting in different image quality) and with different PET/MRI acquisition and image reconstruction protocols, such as those having fewer MRI sequences or different dose reduction factors (DRFs). In this multi-center study, we aimed to investigate the effect of training data bias and non-harmonized protocols when generalizing a network developed in one institution to another.Methods
PET/MRI data acquisition: 40 PET/MRI datasets (39 participants, 19 female; 67±8 years) were obtained from Scanner 1 while 40 other participants (23 female, 64±11 years) were scanned on another PET/MRI scanner (mMR, Siemens Healthineers; “Scanner 2”). The amyloid radiotracer 18F-florbetaben was injected into the subject and PET data were acquired simultaneously 90-110 minutes after injection.
Protocol differences: T1-weighted and T2-weighted MR images were acquired on both scanners, but T2 FLAIR was acquired on Scanner 1 only. The raw list-mode PET data was reconstructed for the full-dose ground truth image and was also either randomly undersampled by a factor of 100 (Scanner 1) or framed for 12 seconds, 24 seconds, 1 minute, and 5 minutes from the start of PET acquisition (Scanner 2) for reconstruction to produce low-dose (1% dose for Scanner 1 and approximately 1%, 2%, 5%, 25% dose respectively for Scanner 2) PET images.
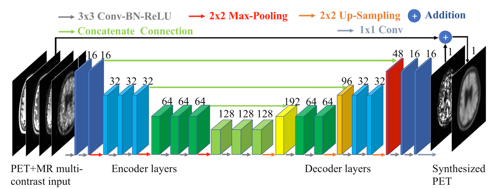
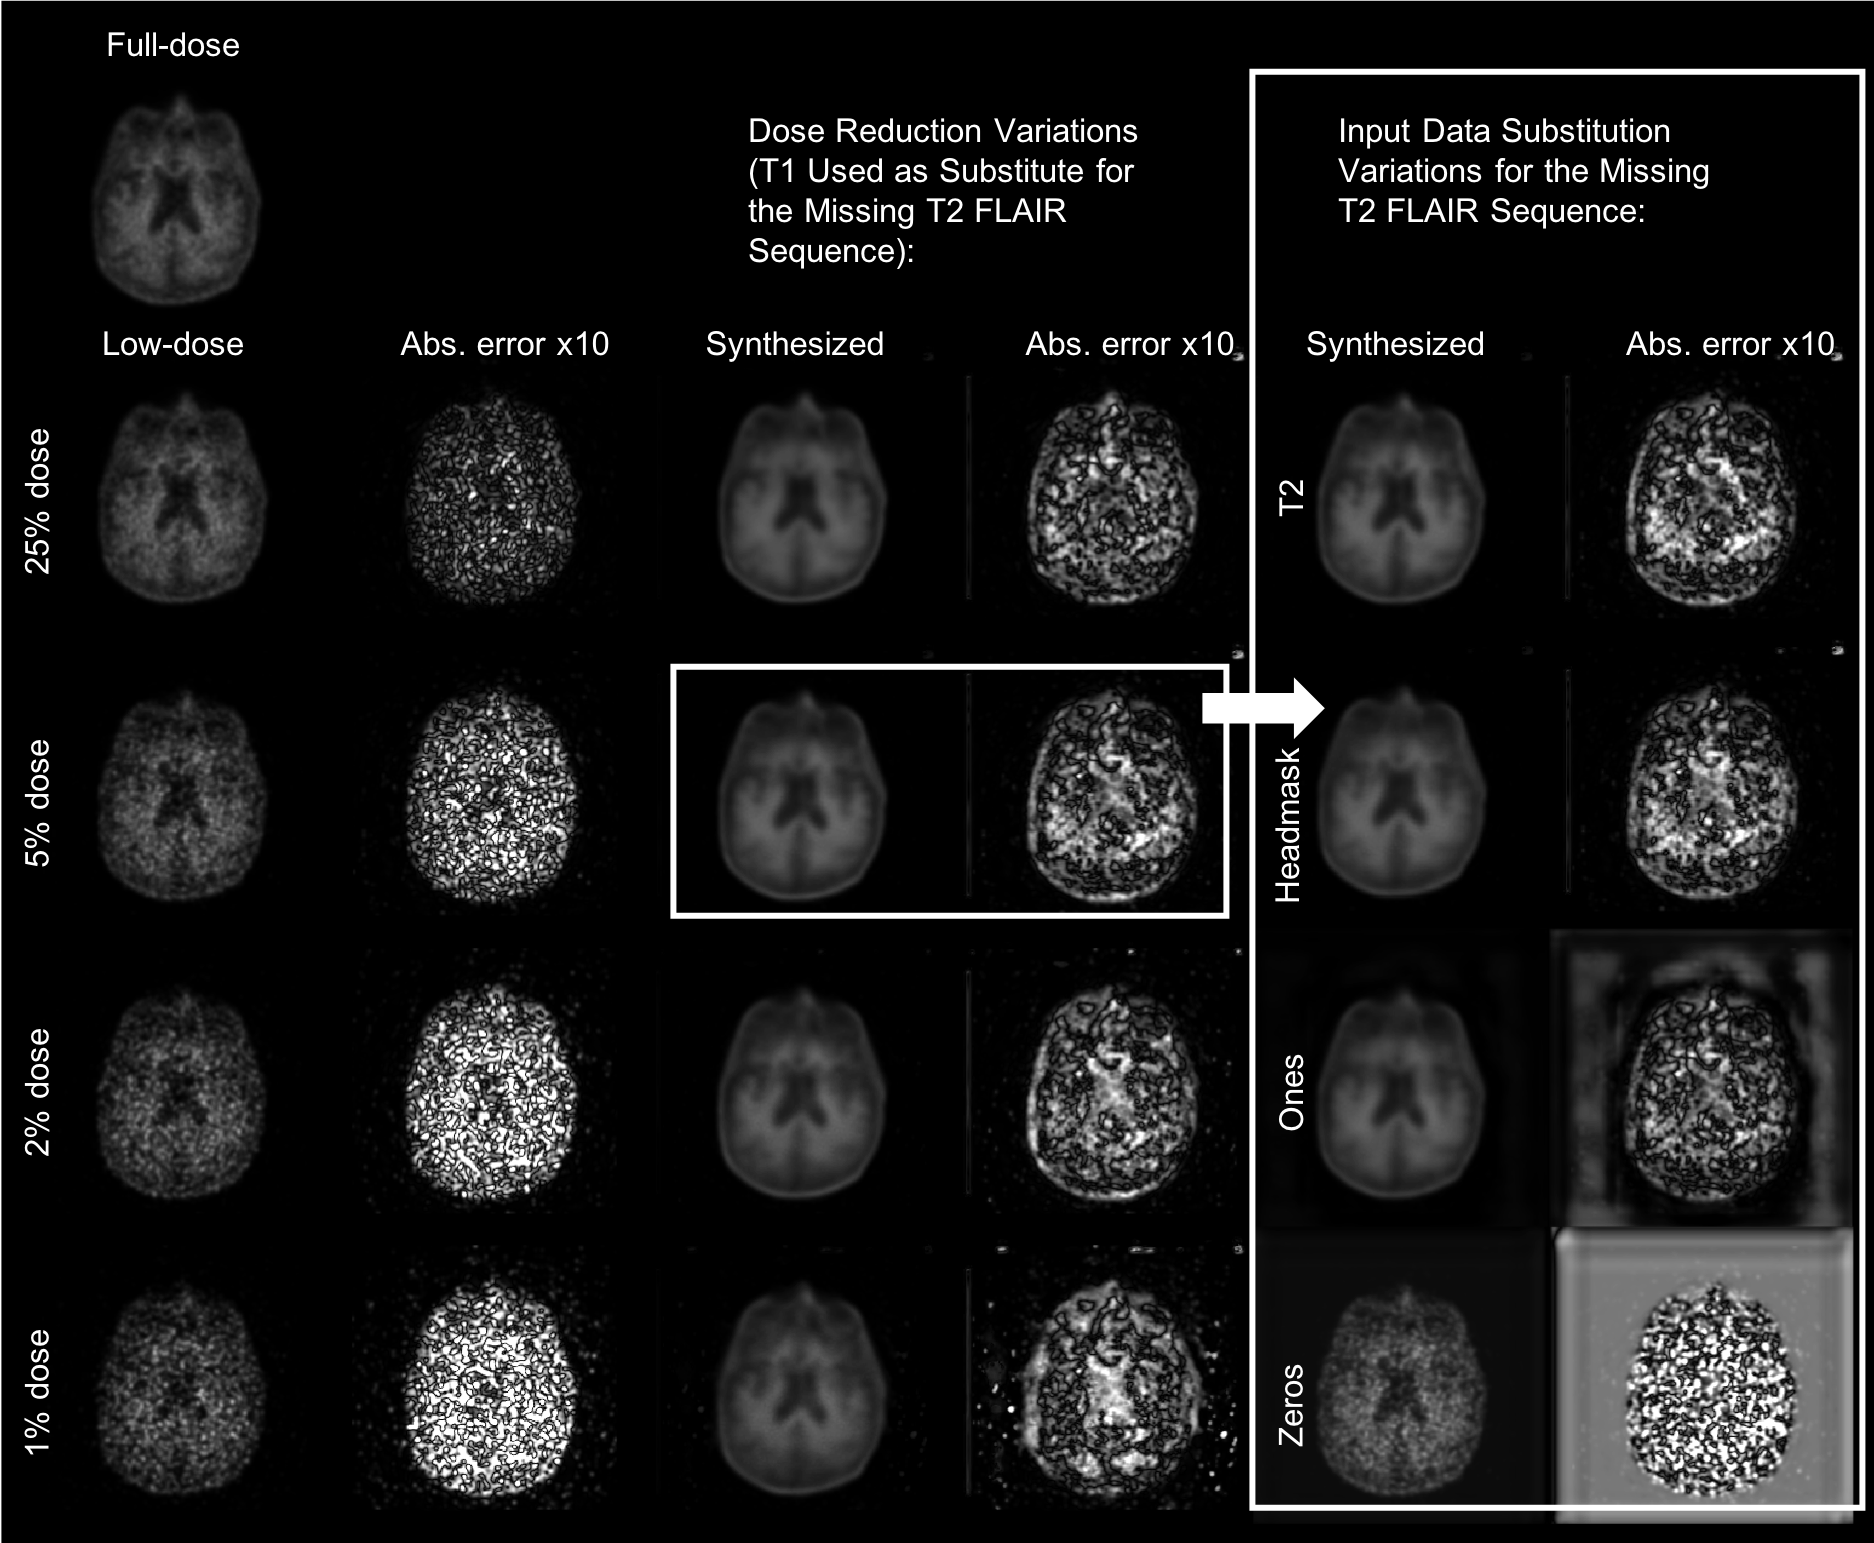
U-net implementation: We trained a convolutional neural network (“U-net”) with the proposed structure (Figure 1)2,3, using Scanner 1 data. The inputs of the network are the multi-contrast MR images (T1-weighted, T2-weighted, T2 FLAIR) and the low-dose PET image. For investigating the effect of incomplete data, the T1- and T2-weighted images as well as a T1-derived binary head mask and matrices of either all ones or all zeros were used as inputs for the missing T2 FLAIR channel in the network. 5%-dose images were used as the low-dose input for Scanner 2 data. For investigating the effect of DRFs the T1-weighted images were used in the event of missing T2 FLAIR data. 8 datasets from Scanner 1 were set aside as testing data for the network. No fine-tuning was performed for data from Scanner 2.
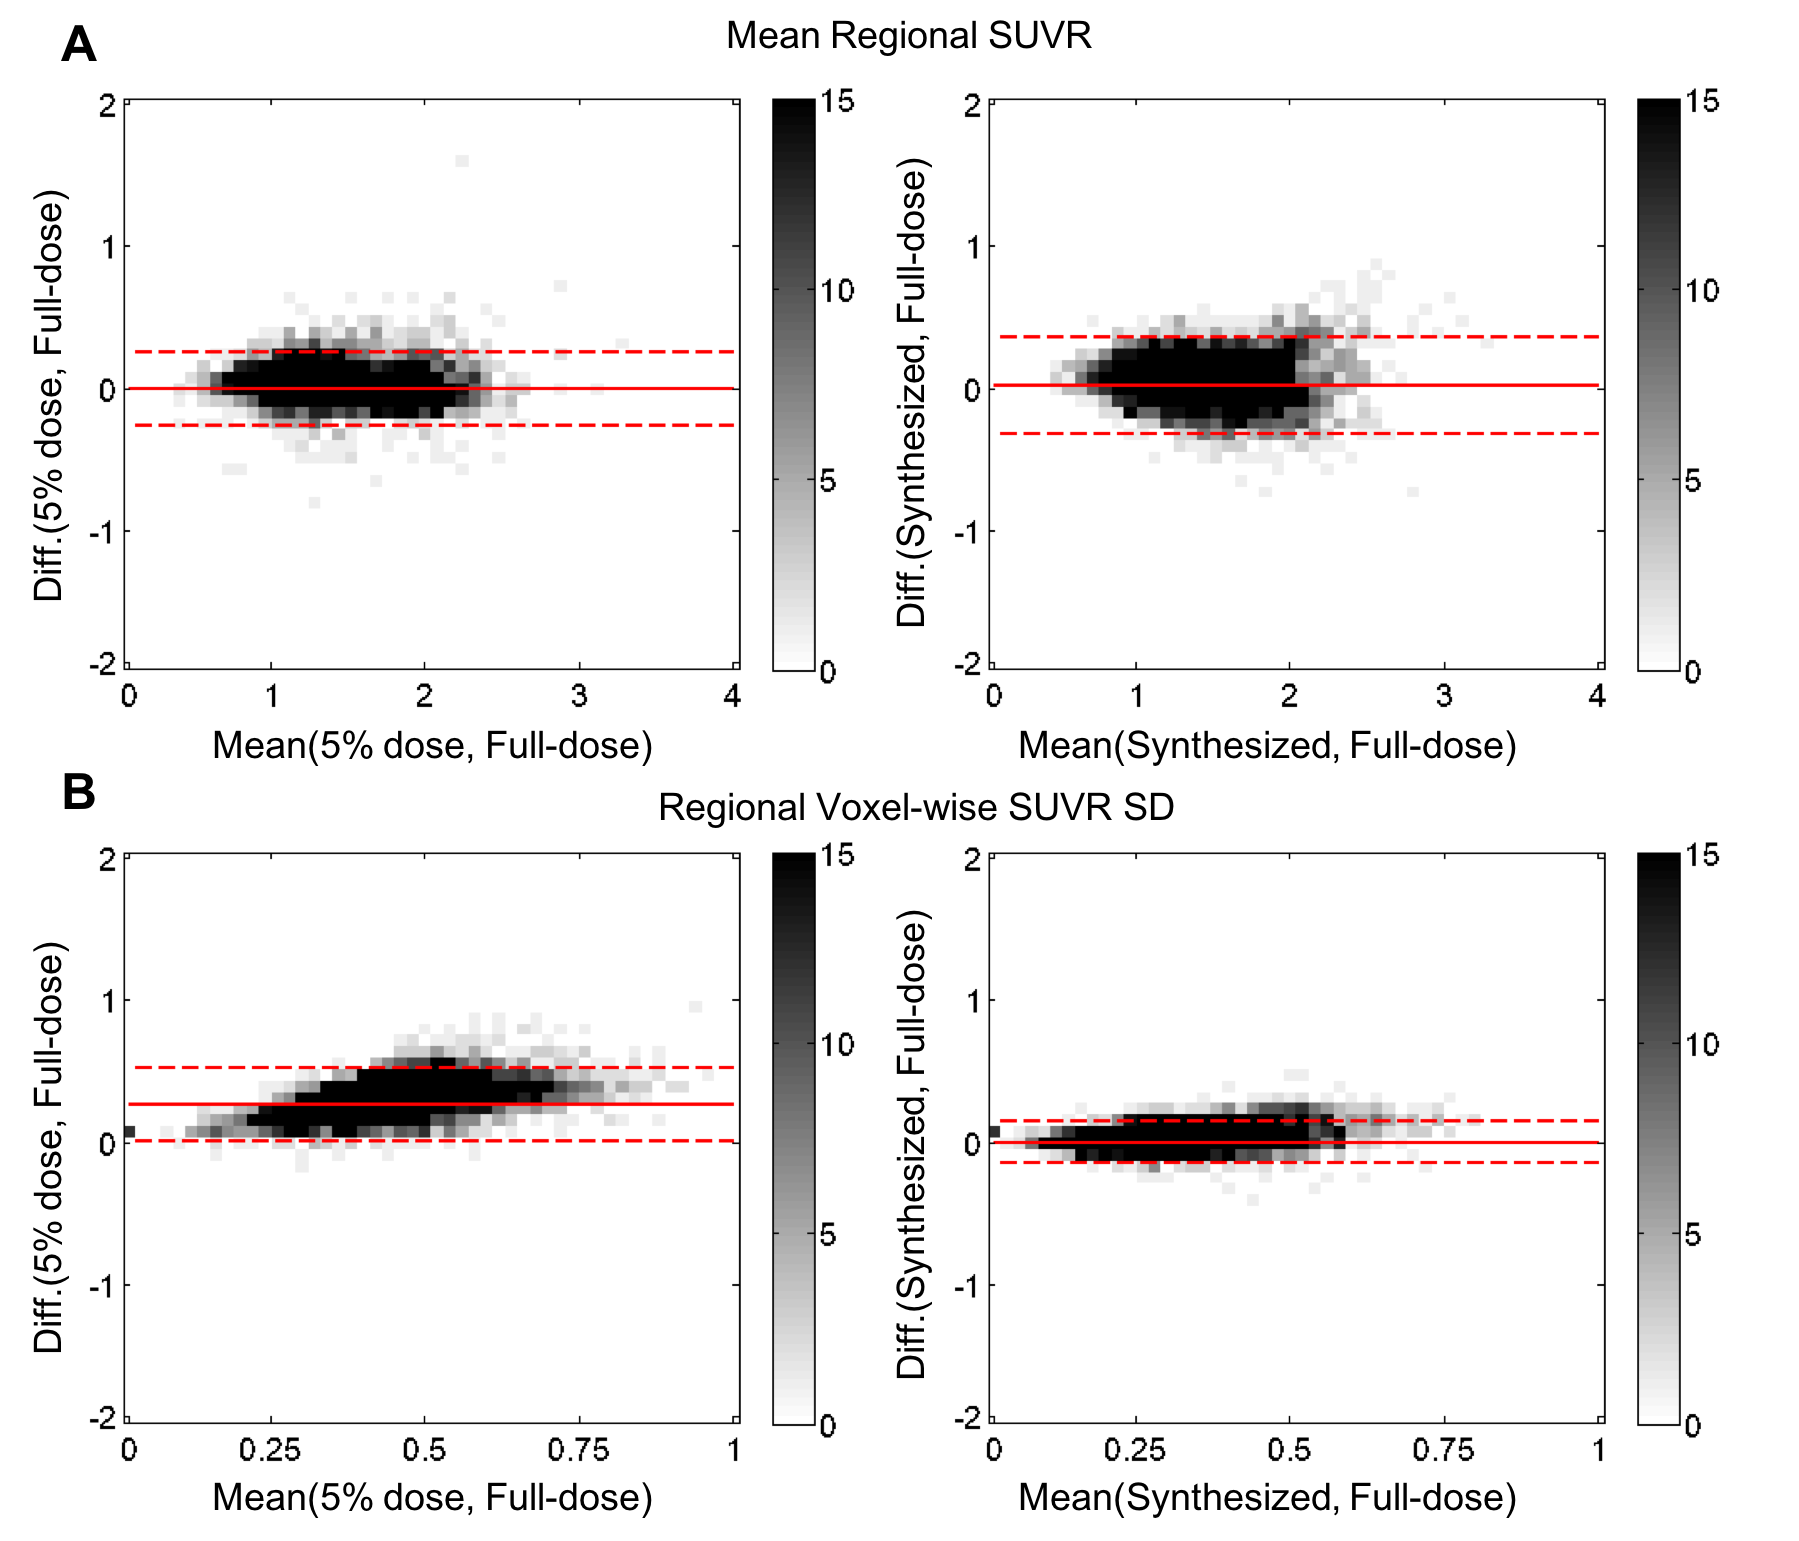
Data analysis: Using the software FreeSurfer4, T1-based brain masks and region-of-interest (ROI) segmentations of each subject were used for voxel- and region-based analyses. The synthesized PET image and the low-dose PET images were compared to the full-dose images. For comparing image quality, in each axial slice of the volumes, the metrics peak signal-to-noise ratio (PSNR), structural similarity (SSIM), and root mean square error (RMSE) were calculated. Paired t-tests were used to assess the difference of metrics across datasets. Bland-Altman plots were used to assess the distribution of the mean and voxel-wise standard deviation of standard uptake value ratios (SUVRs; mean uptake in ROI/mean uptake in the cerebellar cortex) in each ROI.
Results and Discussion
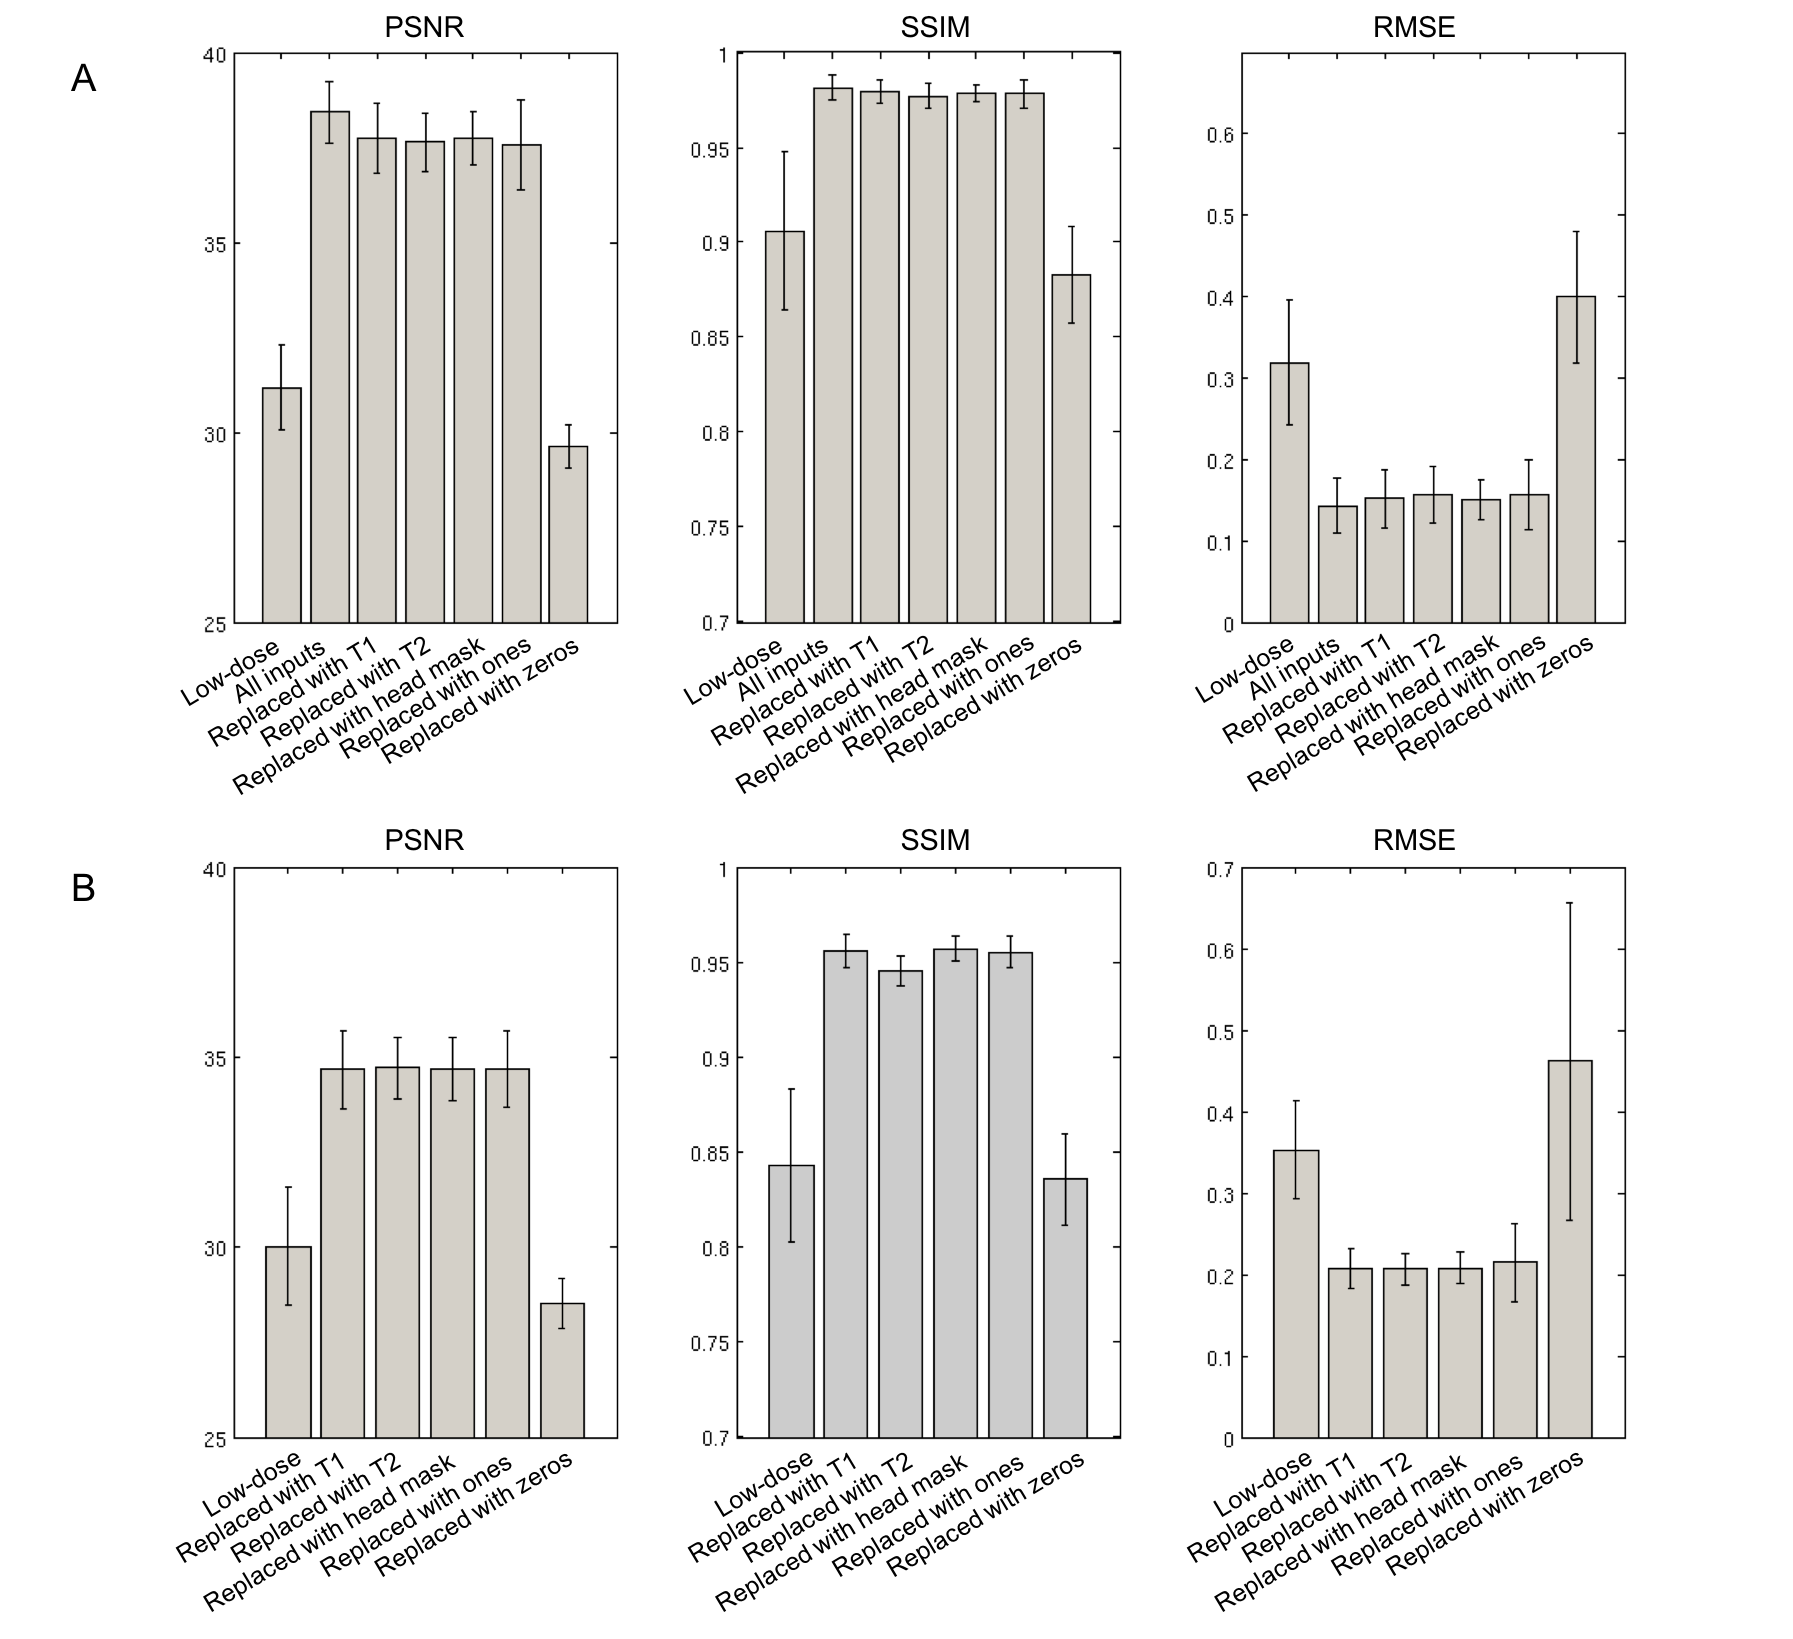
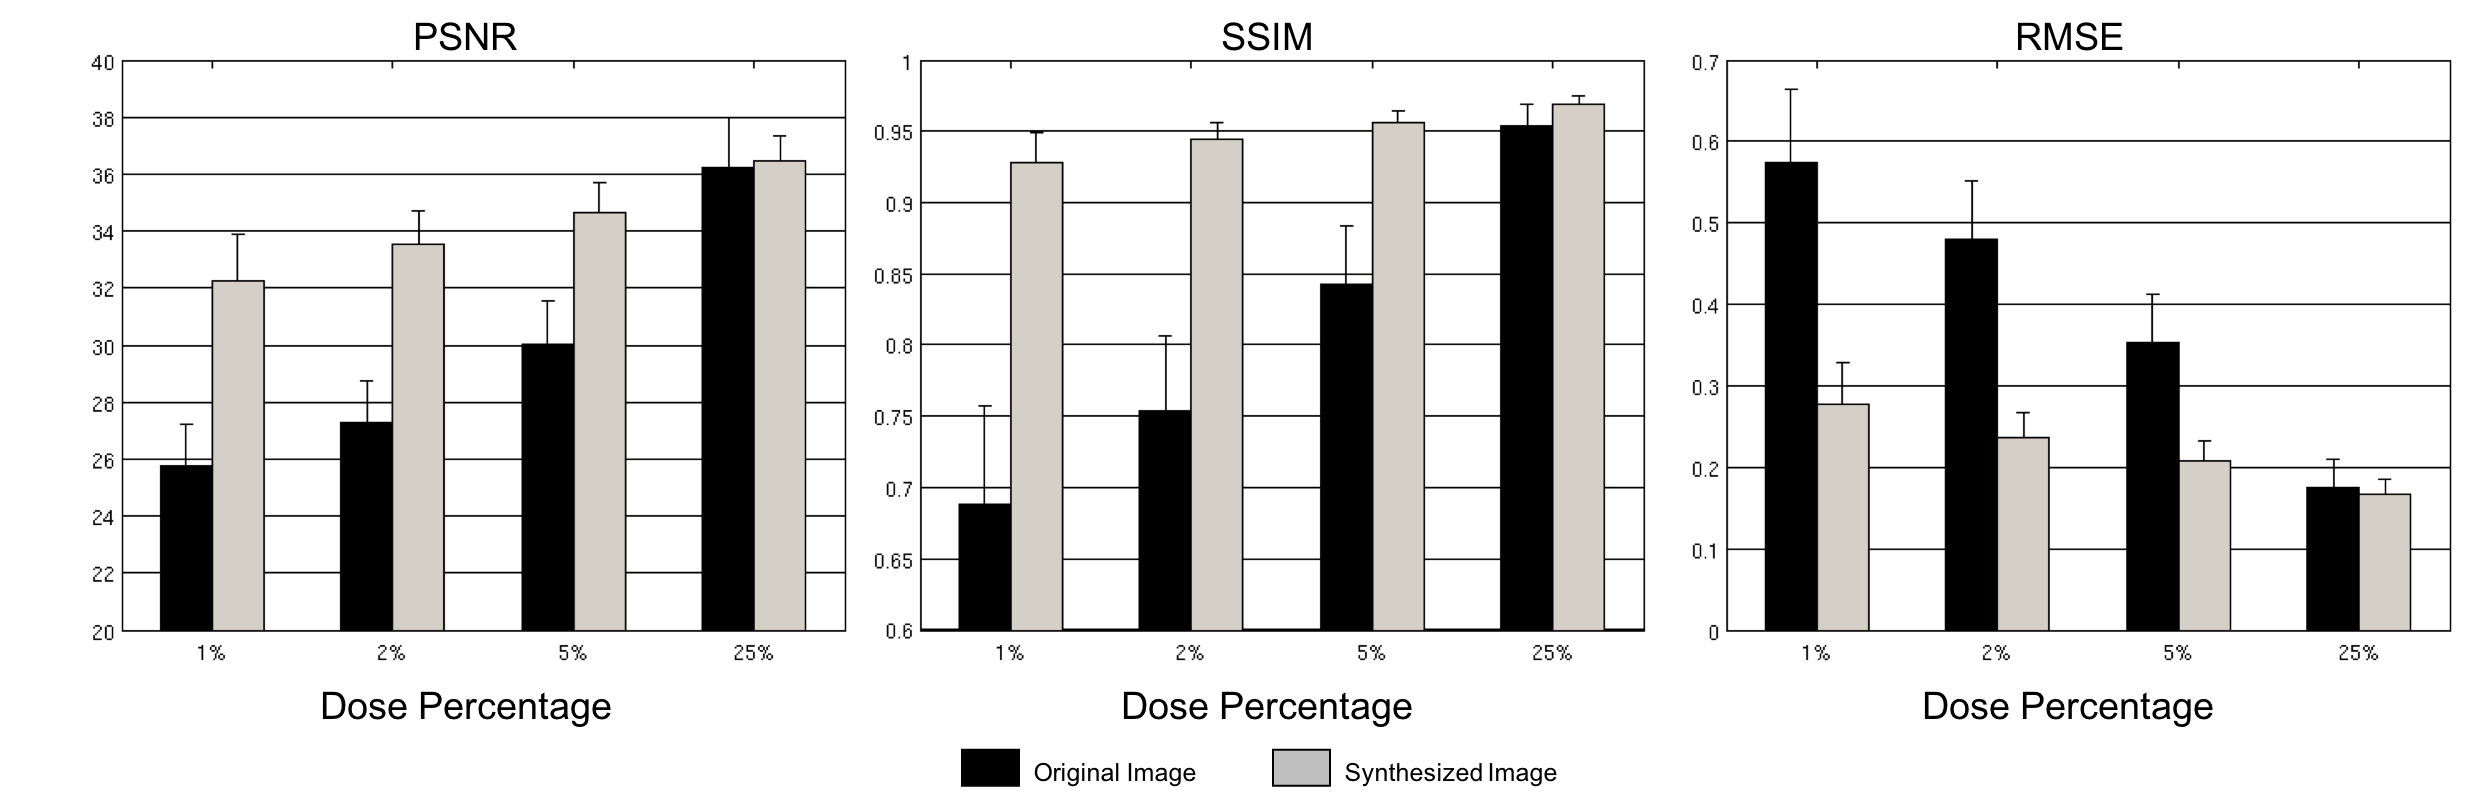
Qualitatively, all synthesized images show marked improvement in noise reduction to the low-dose image and resemble the ground truth image, except when using zeros to replace the missing contrast. Replacing missing data with all ones or zeros resulted in undesirable errors outside the head (Figure 2). Quantitatively, within the brain the synthesized images with substituted data performed worse (lower PSNR and SSIM; higher RMSE) than those generated using all available input data (Figure 3A, p<0.05 except comparing against head mask replacement, p=0.08). Moreover, replacing the T2 FLAIR data with T1, T2, or head mask images had similar performance for data acquired on Scanner 2 (Figure 3B, generally p>0.05; for comparing SSIM with head mask replacement vs. T1 or T2 replacement, p<0.05). An improvement in image quality metrics was achieved when using any of the low-dose images as inputs through the network (p<0.05 for all comparisons except 25%-dose PSNR; Figure 4). Bland-Altman plots showed that the synthesized images had minimal regional SUVR bias while the voxel-wise noise in the ROIs was reduced (Figure 5).Conclusion
We successfully applied the U-net trained on one PET/MRI scanner to data acquired on another and with a different PET/MRI data acquisition/reconstruction protocol. Selecting structurally similar contrasts for substitution is a viable alternative in the case of missing input data. Noise reduction was observed when applying the network on any of the low-dose images. This study can aid the generalization of trained low-dose PET/MRI networks in future multi-center studies.Acknowledgements
This project was made possible by the NIH grant P41-EB015891, GE Healthcare, the Michael J. Fox Foundation for Parkinson’s Research, the Stanford Alzheimer’s Disease Research Center, the Foundation of the ASNR, and Piramal Imaging.References
1. Chen KT, et al. " Ultra-low-dose 18F-florbetaben Amyloid PET Imaging using Deep Learning with Multi-contrast MRI Inputs." Radiology 2018, in press.
2. Ronneberger O, Fischer P, Brox T. “U-Net: Convolutional Networks for Biomedical Image Segmentation.” arXiv:1505.04597 (2015).
3. Chen H et al. “Low-Dose CT with a Residual Encoder-Decoder Convolutional Neural Network (RED-CNN).” arXiv:1702.00288 (2017).
4. Dale AM, Fischl B, Sereno MI. "Cortical surface-based analysis. I. Segmentation and surface reconstruction." Neuroimage. 1999;9(2):179-94.
Figures