0675
High resolution imaging of the arterial and venous vasculature in deep gray matter1Biomedical Magnetic Resonance, Otto-von-Guericke-University, Magdeburg, Germany, 2Wellcome Centre for Human Neuroimaging, London, United Kingdom, 3German Center for Neurodegenerative Disease, Magdeburg, Germany, 4Center for Behavioral Brain Sciences, Magdeburg, Germany, 5Leibniz Institute for Neurobiology, Magdeburg, Germany
Synopsis
Recent studies investigated the human vasculature by building vascular atlases and performing vessel morphometry. Even though these studies showed great potential, the used resolution might not be sufficiently high to study changes the microvasculature as there occur in i.e. Alzheimer’s. Therefore, an approach to assess the arterial and venous microvasculature in deep gray matter regions is presented. Based on high resolution ToF angiography and QSM acquired at 7T vascular densities and vessel probability maps were computed.
Purpose
Building structural atlases and processing voxel-based morphometry is common practice. However, applying these concepts to the vasculature is relatively new1-3, even though, assessing vascular changes holds great promise. In neurodegenerative diseases (i.e. Alzheimer’s and Parkinson’s) the microvascular in deep gray matter regions declines4. Furthermore, changes in hippocampal vascular density are more sensitive than changes in hippocampal volume in studying epilepsy5.
To fully assess these changes in the microvasculature high spatial resolutions are necessary. However, whole brain atlases with up 0.6mm isotropic resolution have been built so far.
Hence, in this study the arterial and venous microvasculature was imaged at higher resolution (2.4-fold decreased voxel size), analyzed in five deep gray matter regions, vascular density computed and vascular patterns extracted.
Methods
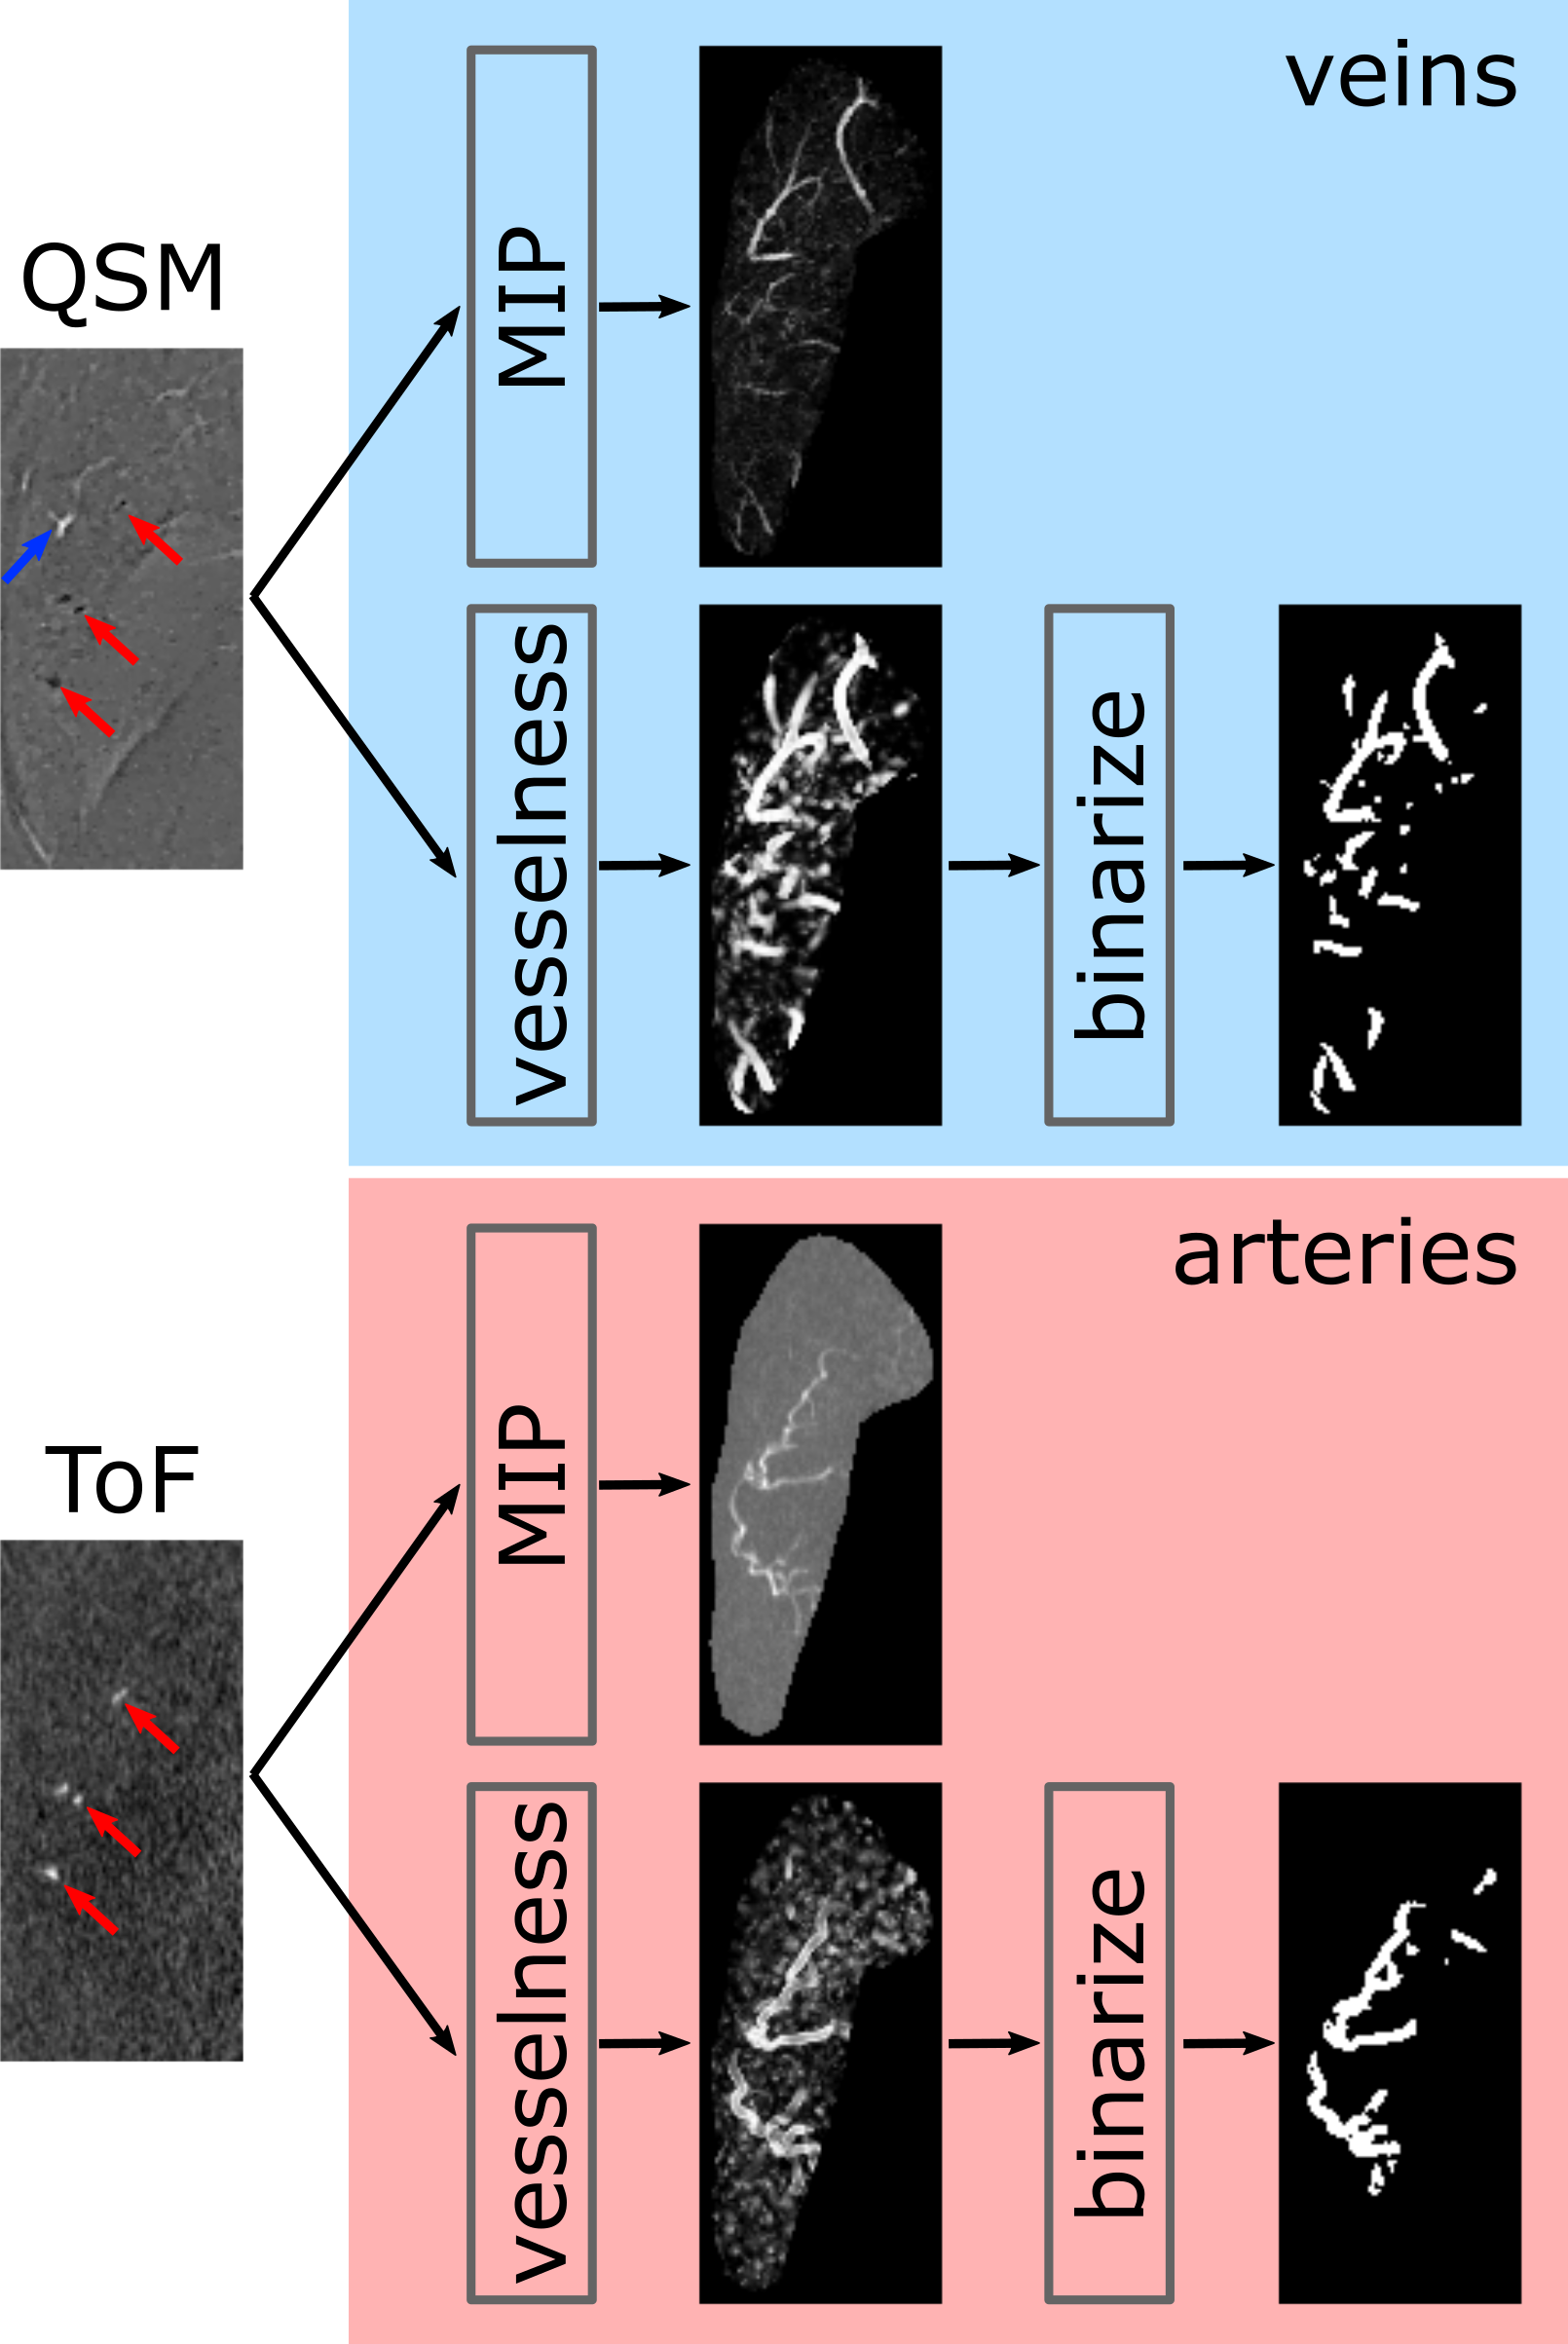
After study approval by the local ethics committee, six healthy subjects (gave written consent, 2 female, 32.3+/-5.0 years) were scanned at 7T (Siemens Healthineers, Erlangen, Germany) with 32 channel head coil (Nova Medical, Wilmington, USA). Time-of-Flight (ToF) angiography and Quantitative Susceptibility Mapping (QSM) were used to image the arterial and venous vasculature, respectively. Both 3D, flow compensated sequences covered a 202x152x96mm FoV with 0.3x0.3x1.0mm voxel size. To investigate the effect of resolution on vessel depiction, one subject was scanned with prospective motion correction at 0.25x0.25x1mm resolution (see6,7). FSL FIRST segmented bilaterally thalamus, putamen, pallidum, caudate, and hippocampus on an additionally acquired MPRAGE. Magnitude GRE (from QSM acquisition) and ToF images of all subjects were used jointly to build a multivariate template with ANTs (equal contrast weighting, rigid intra-subject registration prior to template construction). To reconstruct venous QSM the MSDI algorithm was used with a spherical-kernel radius of 2mm.8 The resulting, high-pass filtered susceptibility maps suppress large anatomical structures and contain only small-scale features such as the venous vasculature (see8). Before vessel extraction, ToF and QSM data were upsampled to isotropic resolution. For each subject and ROI, signal intensities were normalized, a vesselness filter was applied9, and the resulting vessel map was binarized (threshold 99th percentile, empirically optimized for small vessel detection, see Fig. 1).
Assessment of the microvasculature consisted of two independent parts:
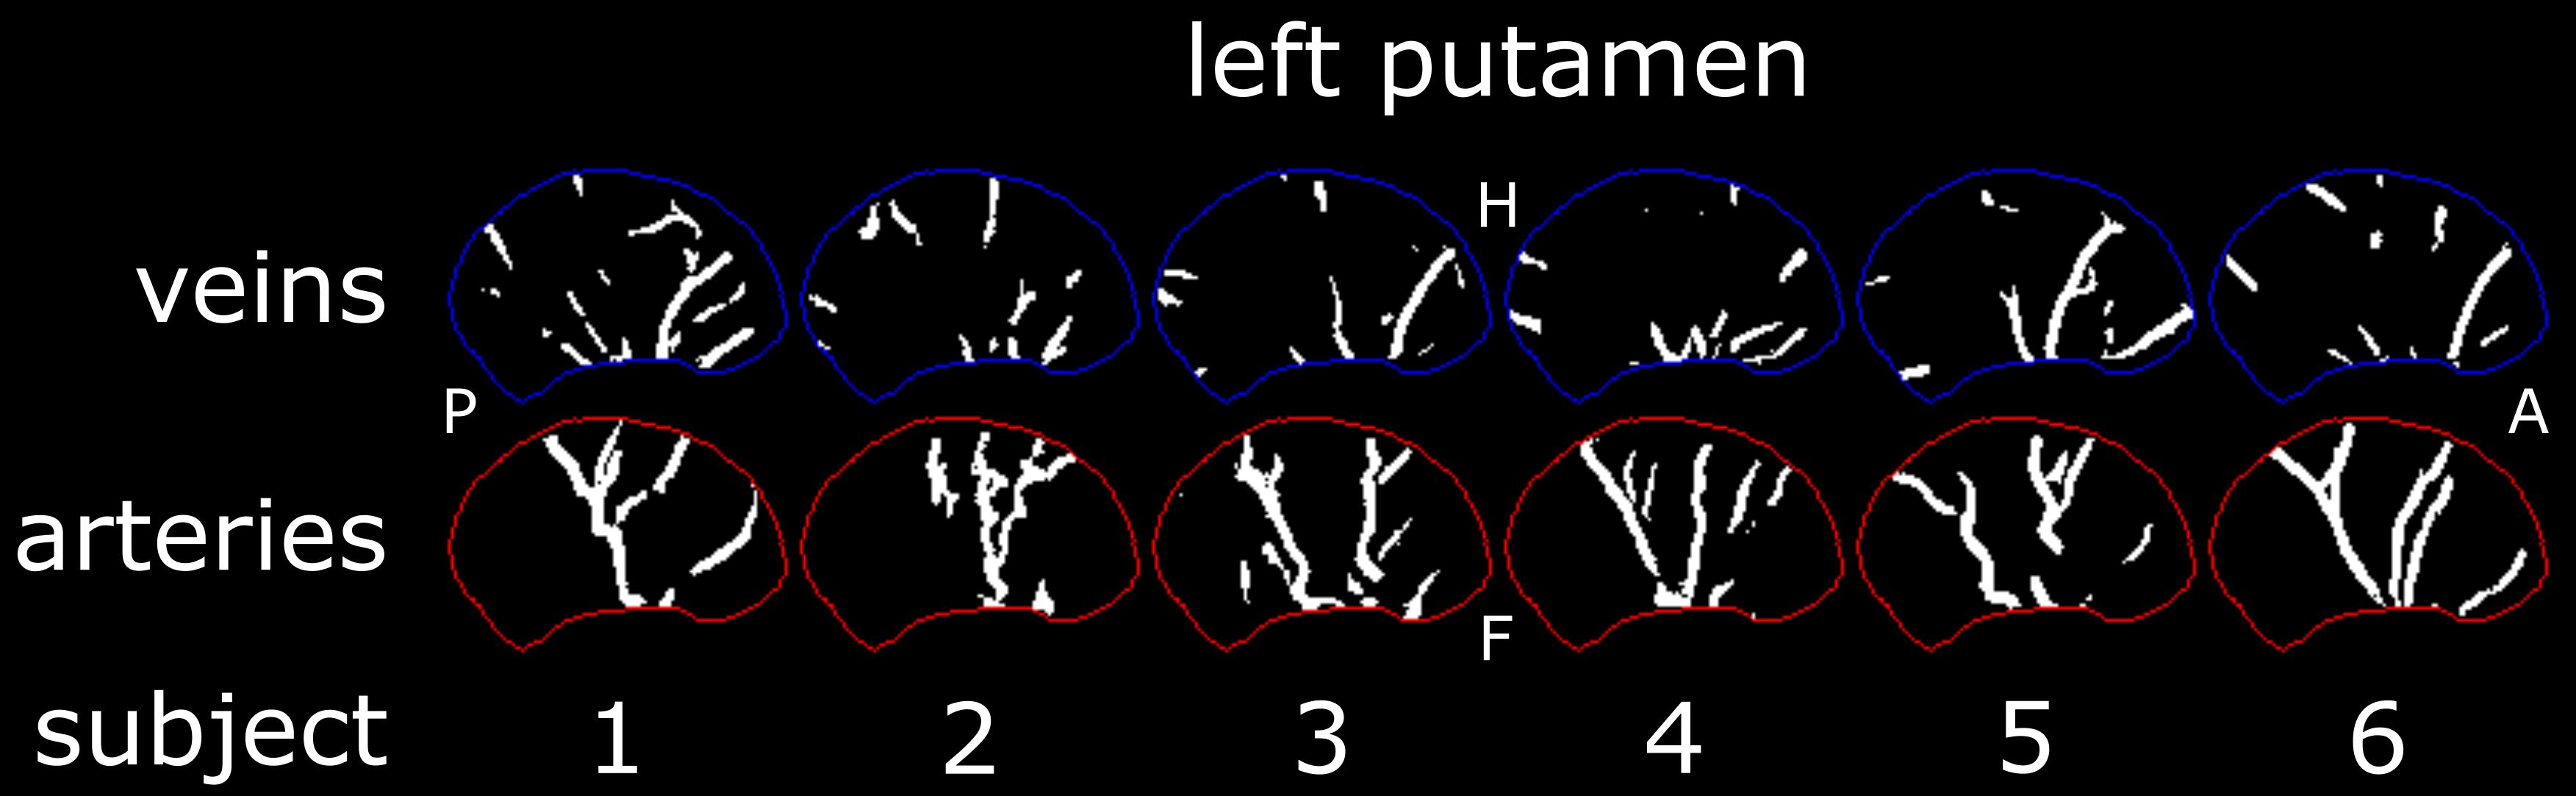
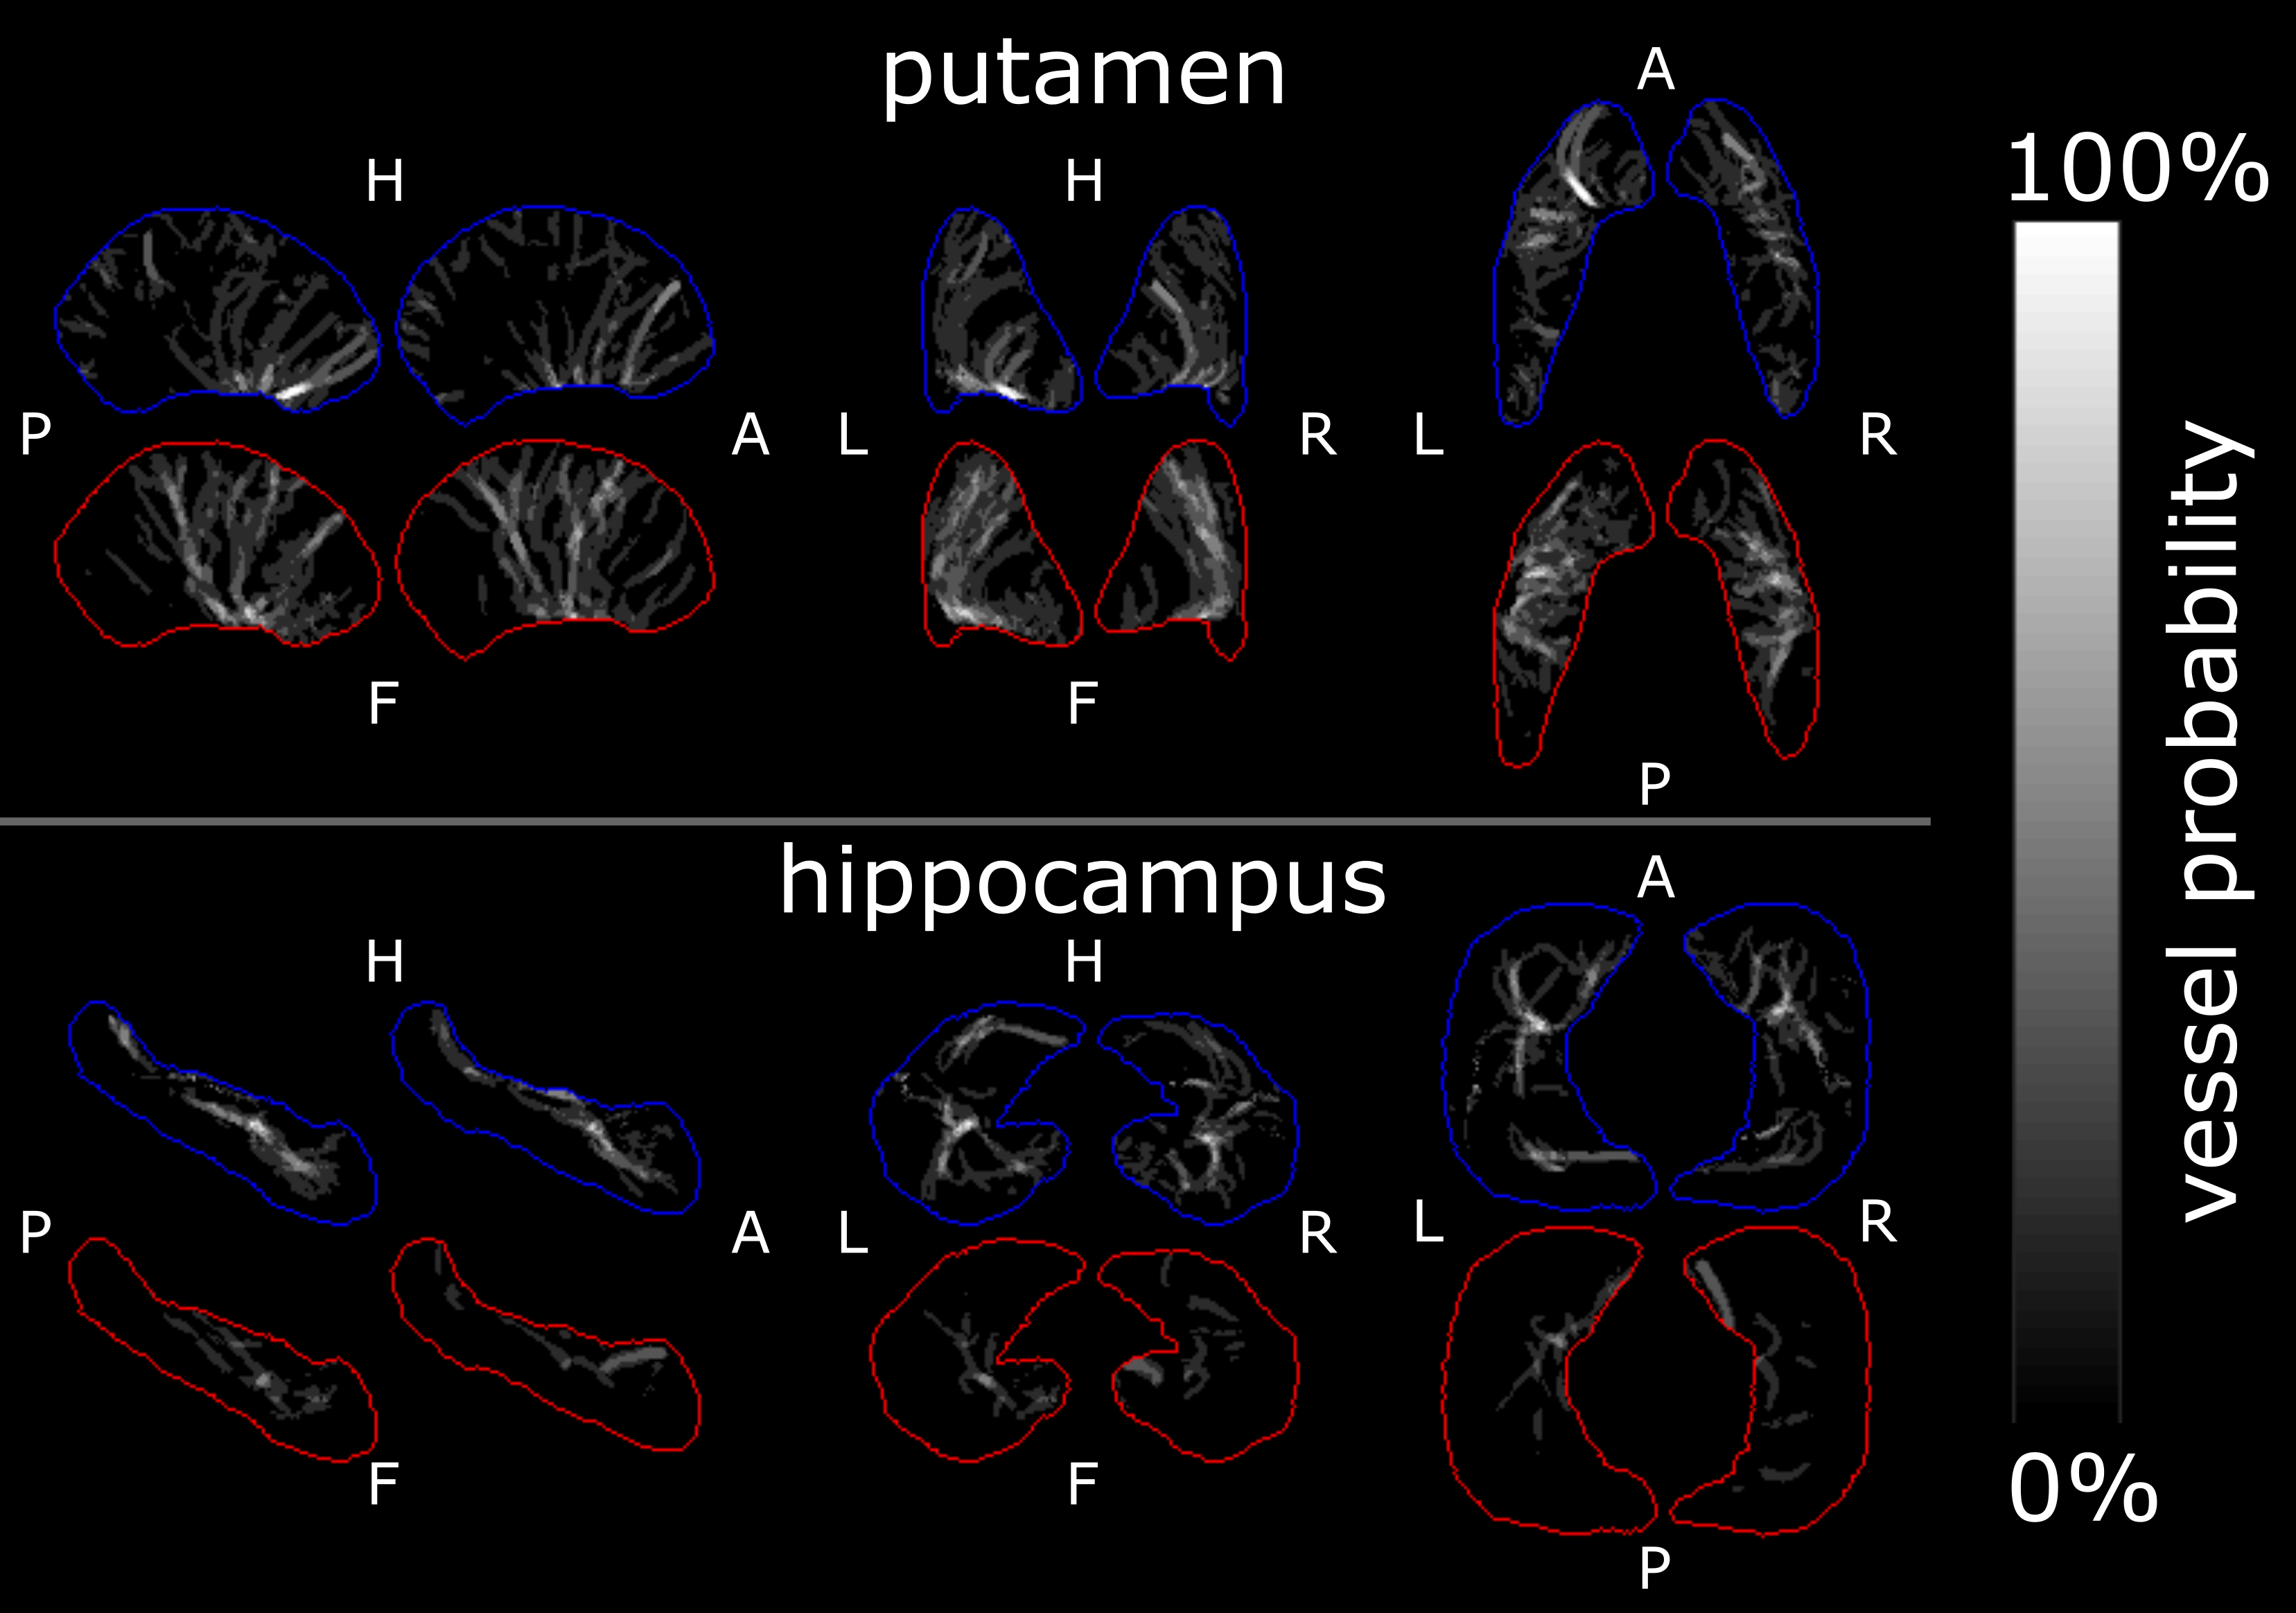
1.) Vessel probability maps were created by averaging the binarized vessel maps of all subjects in template space for each ROI individually (see Fig. 2 and Fig. 3).
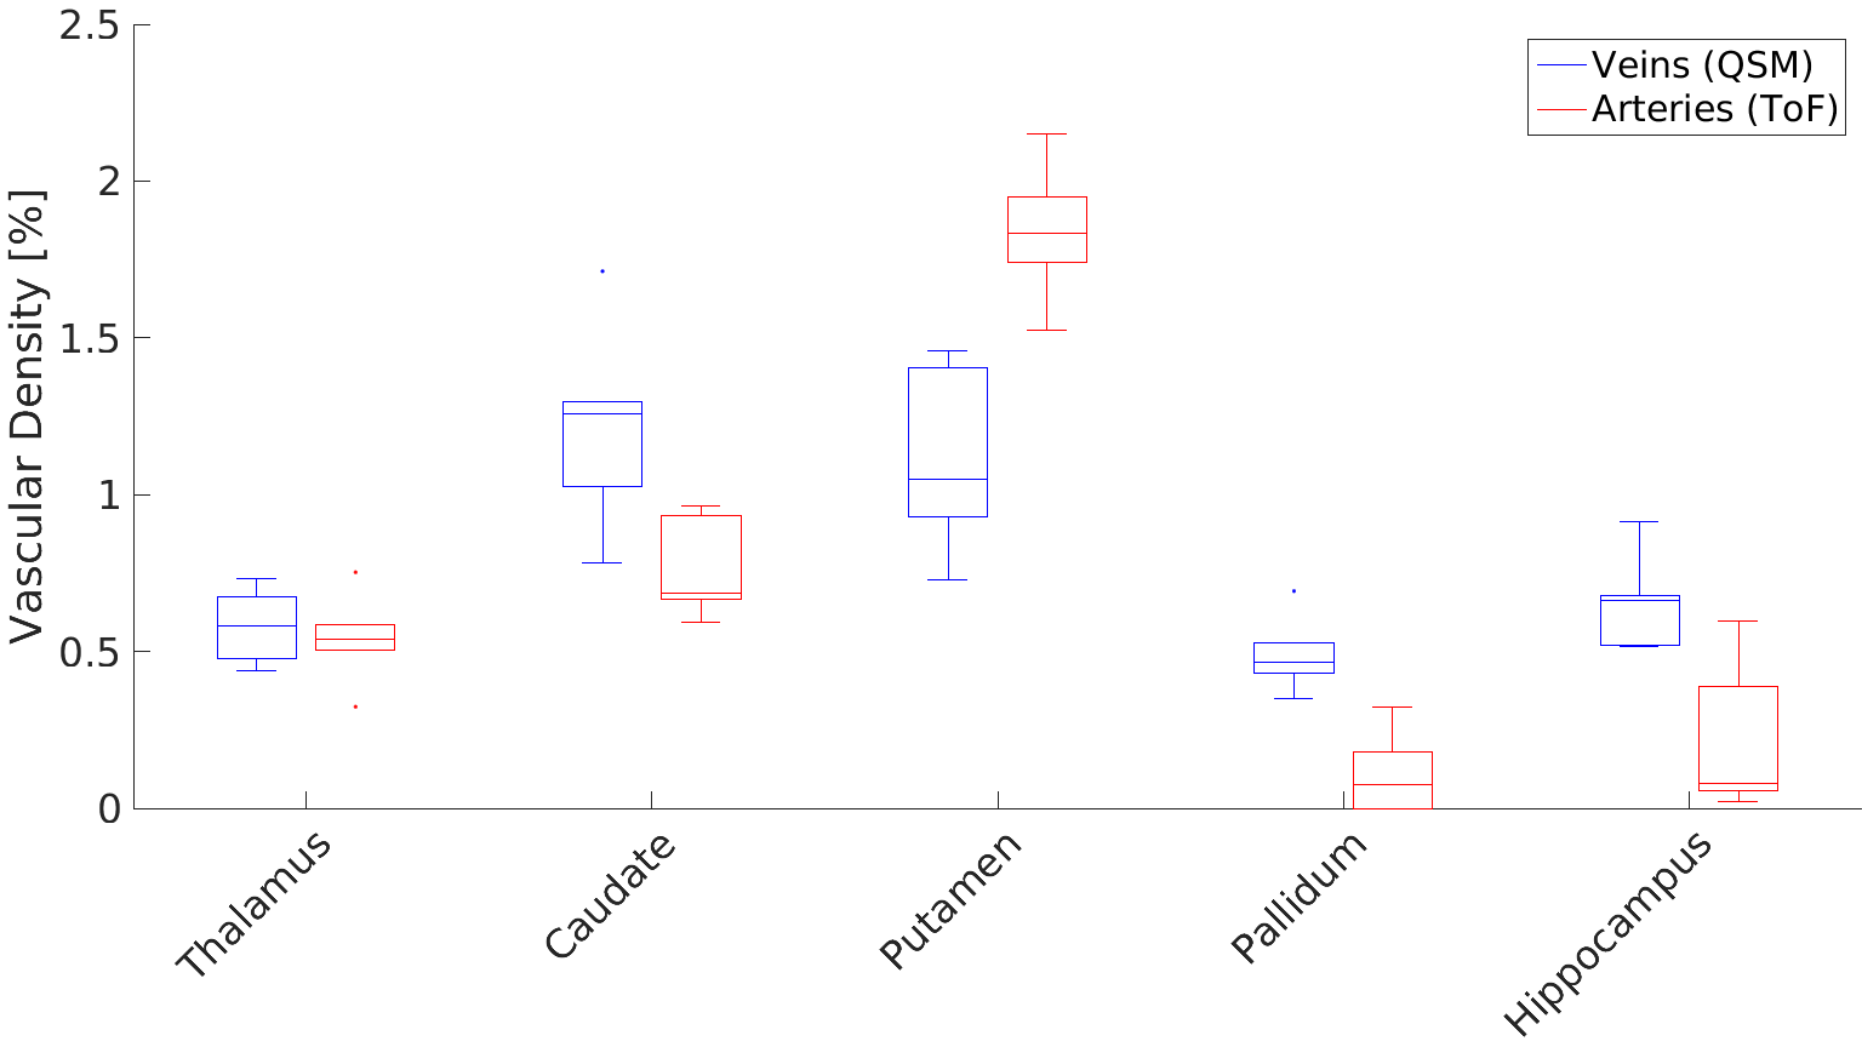
2.) The Vascular Density (VD) was estimated in subject space using the binarized vessel maps by dividing the number of estimated vessel voxel by the ROI size in voxels (ROIs combined bilateral). Box plots10 for the arterial and venous VD per ROI were computed.
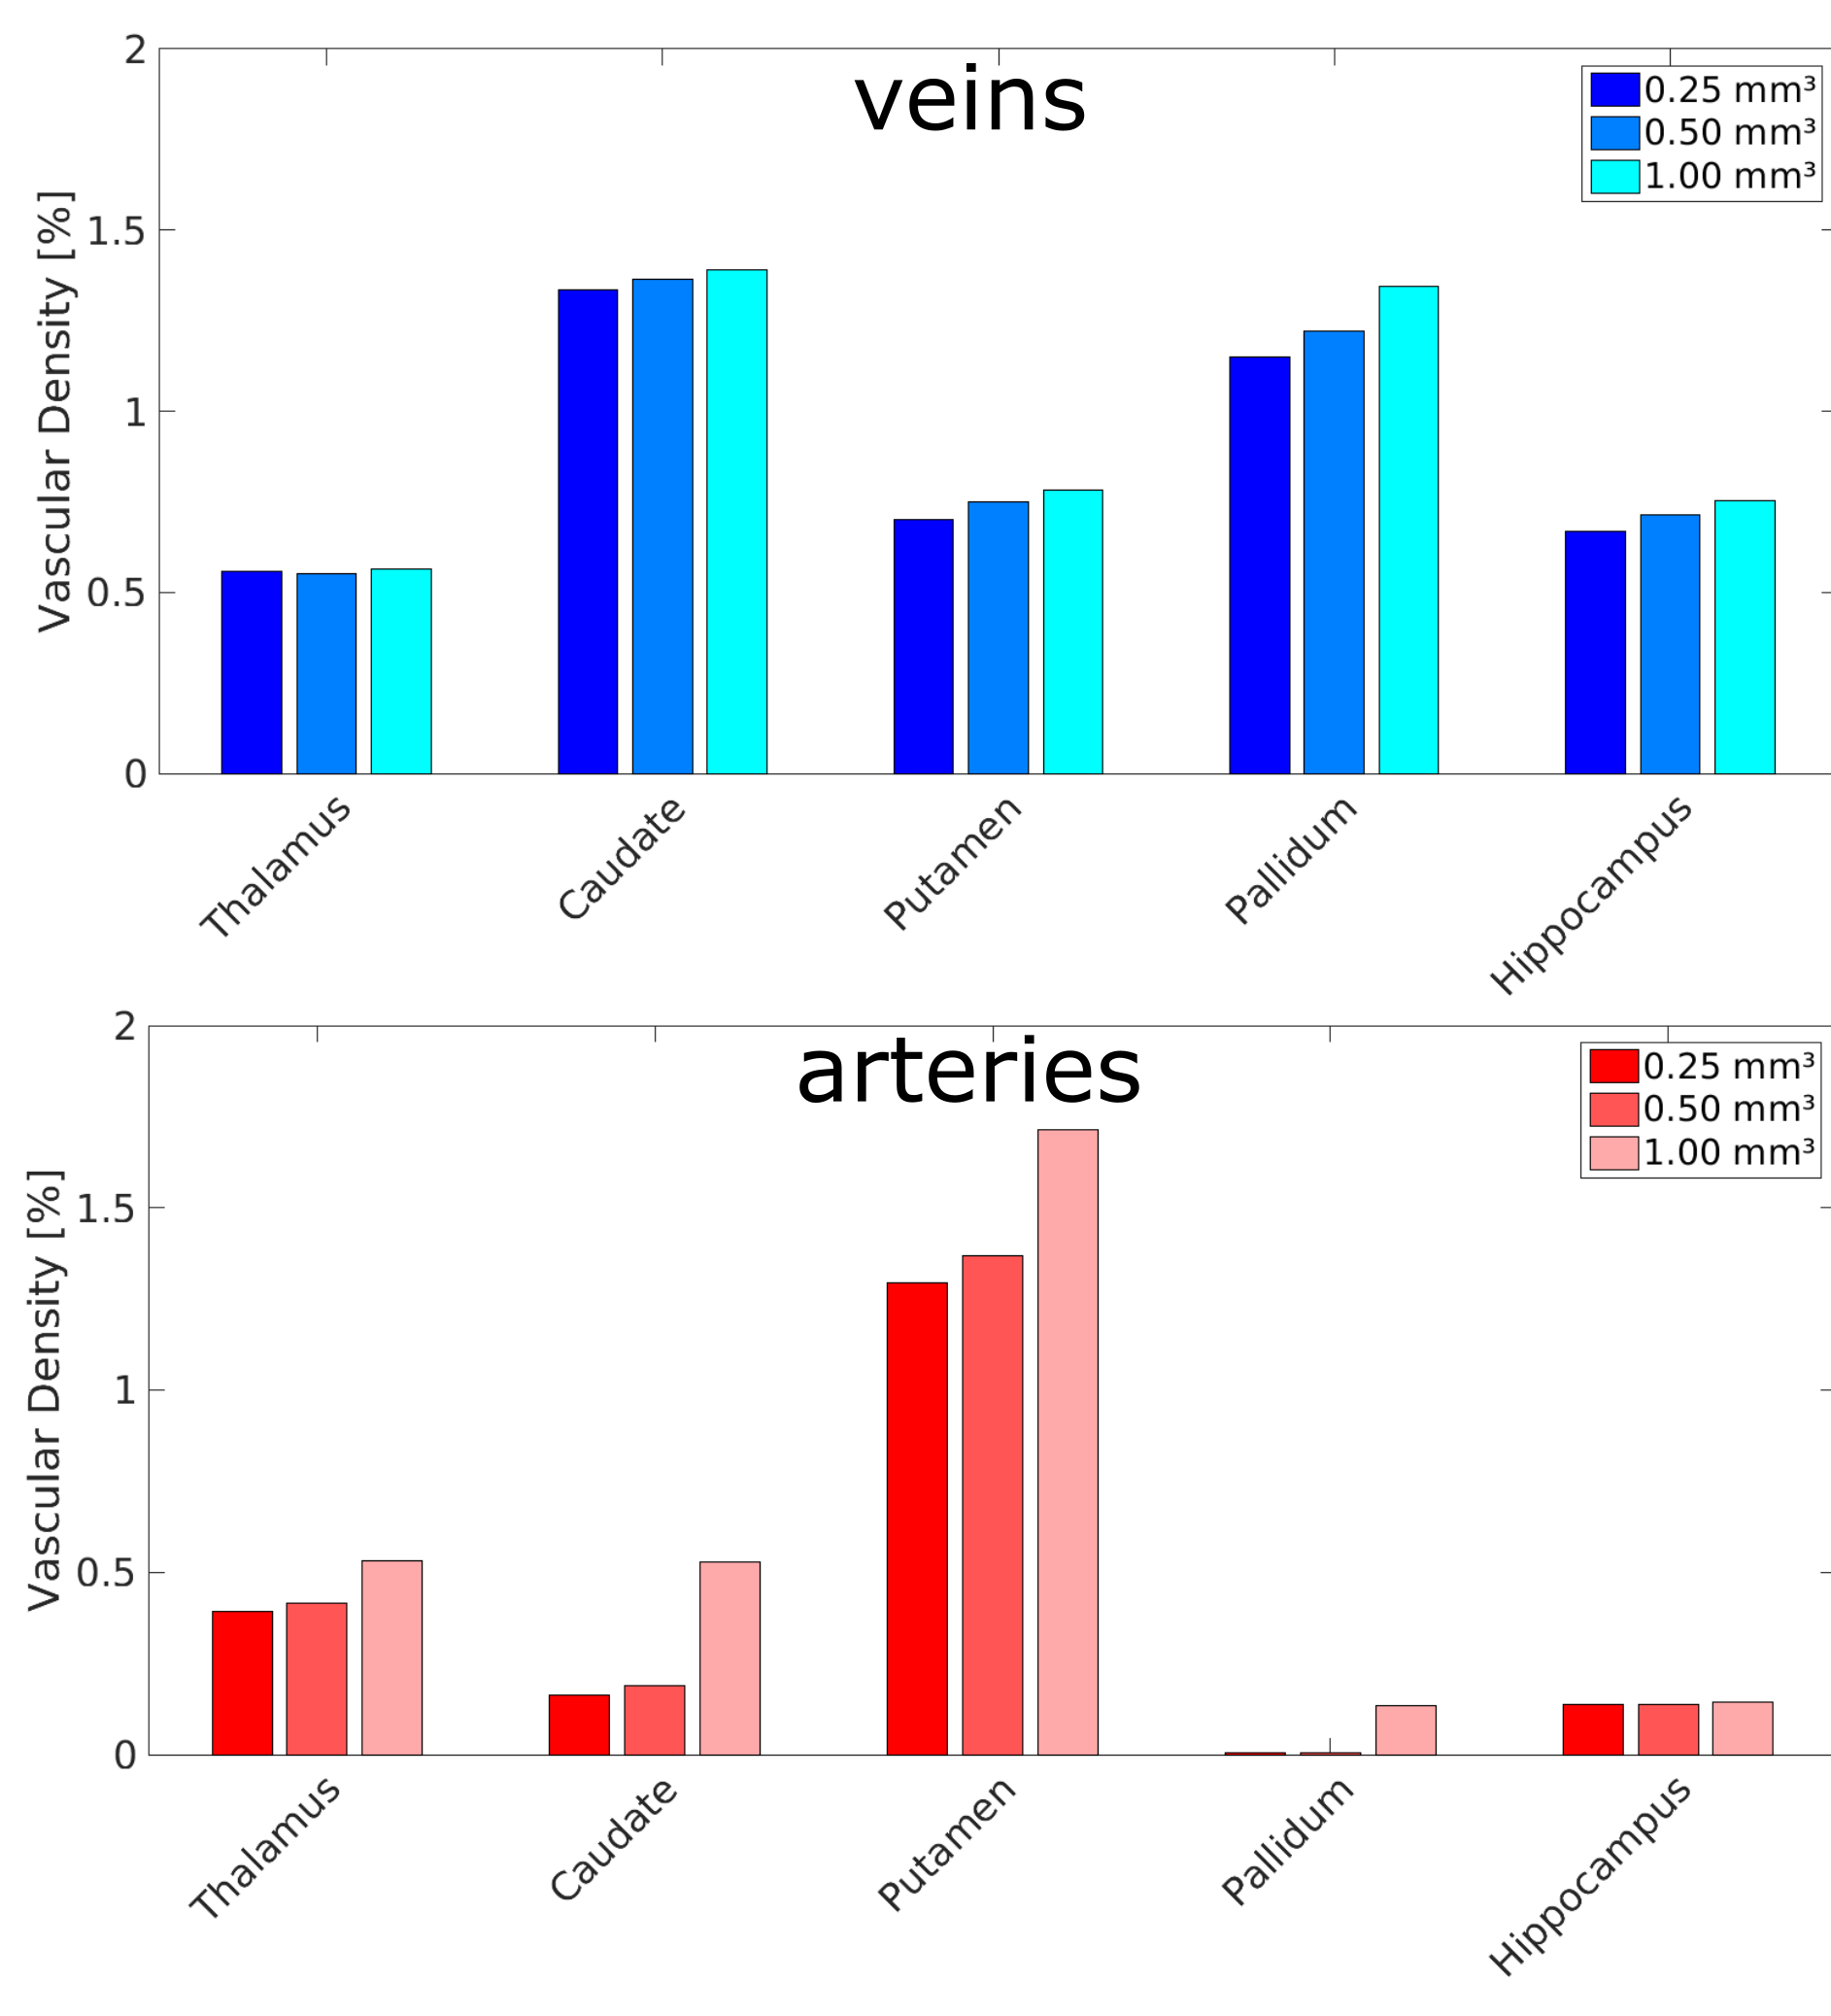
The 0.25 data was zero-masked in k-space (setting respective, high frequency components to zero) to create ToF and QSM images with the same nominal resolution, but containing only measured information for 0.5mm or 1.0mm. Subsequently, VD was estimated for the three datasets.
Even though 3D data was processed, for visualization maximum intensity projections are used throughout the abstract.
Results
Binarized vessel maps show good visual agreement with the Maximum Intensity Projections (MIPs, see Fig. 1). However, noise or (for QSM) small residual iron rich structures were erroneously detected as vessels in the binary maps. Furthermore, the vesselness filter enlarged the vessel diameter compared to the MIPs. Note that arteries in ToF angiography were detected in the QSM as well (see red arrows in Fig.1).
The arterial and venous vessel probability maps for the hippocampus and putamen are shown in Fig. 3. Across the six subjects, the microvasculature is organized in similar patterns; however, each subject has specific branches and bifurcation (see Fig. 2).
Depending on the ROI, VD differed considerably (see Fig. 4). While the arterial VD was highest in the putamen, in the adjacent pallidum is was the lowest. At the same resolution, venous VD in the pallidum was considerably higher.
Zero-masking the data blurred the vessels. Therefore in the performed single subject analysis, more voxel were detected as vessels, overestimating the VD (see Fig.5).
Discussion
Even though, vessel detection needs to be improved and only a small cohort was imaged, studying microvasculature patterns at intra- and inter-subject level was possible. With vascular density the microvasculature can be summarized into a single number, while vessel probability maps provided a more comprehensive view. Even though, both metrics depended on imaging resolution as well as contrast mechanism and can describe regional microvasculature, future research is required to show their potential in clinical trials. In conclusion, the presented approach enables studying microvascular patterns in 3D and, potentially in the future, could enable vessel morphometry at previously not achieved resolution.Acknowledgements
This work was supported by the NIH, grant number 1R01-DA021146, and the Wellcome Trust, grant number 203147/Z/16/Z.References
1. Huck et al. High resolution atlasing of the venous brain vasculature from 7T quantitative susceptibility. bioRxiv(2018). doi:10.1101/444349
2. Ward et al. Combining images and anatomical knowledge toimprove automated vein segmentation in MRI. Neuroimage 165:294–305. doi:10.1016/j.neuroimage.2017.10.049
3. Bernier et al. The morphology of the human cerebrovascular system. Hum Brain Mapp. doi: 10.1002/hbm.24337
4. Jellinger et al. Prevalence and impact of cerebrovascular pathology in Alzheimer’s disease and Parkinsonism. Acta Neurol Scand 2006;114:38–46
5. Feldman et al. Quantification of venous structures in the hippocampus using segment co-registered 7T susceptibility and structural images: First application to focal temporal lobe epilepsy. #3295 ISMRM2018
6. Mattern et al. Prospective motion correction enables highest resolution time-of-flight angiographyat 7T. Magnetic Resonance in Medicine, 2017. doi:10.1002/mrm.27033
7. Mattern et al. Prospective motion correction improves high resolution quantitative susceptibilitymapping at 7T. MRM, 2018. doi:10.1002/mrm.27509
8. Acosta-Cabronero et al. A robust multi-scale approach to quantitative susceptibility mapping. NeuroImage, 2018. doi:10.1016/j.neuroimage.2018.07.065
9. Hessian Based Frangi Vesselness Filter https://de.mathworks.com/matlabcentral/fileexchange/24409-hessian-based-frangi-vesselness-filter
10. BoxPlot2 https://de.mathworks.com/matlabcentral/fileexchange/59303-boxplot2
Figures