0671
Generalization and Analysis of a Deep Convolutional Neural Networks (DCNN)-Based Cerebral Microbleed Detection Algorithm1The UC Berkeley - UCSF Graduate Program in Bioengineering, San Francisco, CA, United States, 2Department of Radiology and Biomedical Imaging, University of California, San Francisco, San Francisco, CA, United States, 3Department of Anesthesia, University of California, San Francisco, San Francisco, CA, United States
Synopsis
We tested and analyzed a deep learning based CMB detection algorithm previously developed using 7T SWI images we found that this method can be well generalized to different scan environment, parameters and pathologies.
Introduction
Cerebral microbleeds (CMBs) are small chronic brain hemorrhages that are prevalent in various neurological disorders, traumatic brain injury, and following radiation therapy for a brain tumor1. We have recently combined traditional computer vision techniques with residual deep convolutional neural networks (DCNN) as an approach for automatic CMB detection and segmentation using 7T SWI images from patients with radiation-induced CMBs2. The goal of this study was to evaluate the performance and generalizability of this approach to lower field strength (3T) images with alternative scan parameters and pathology.Methods
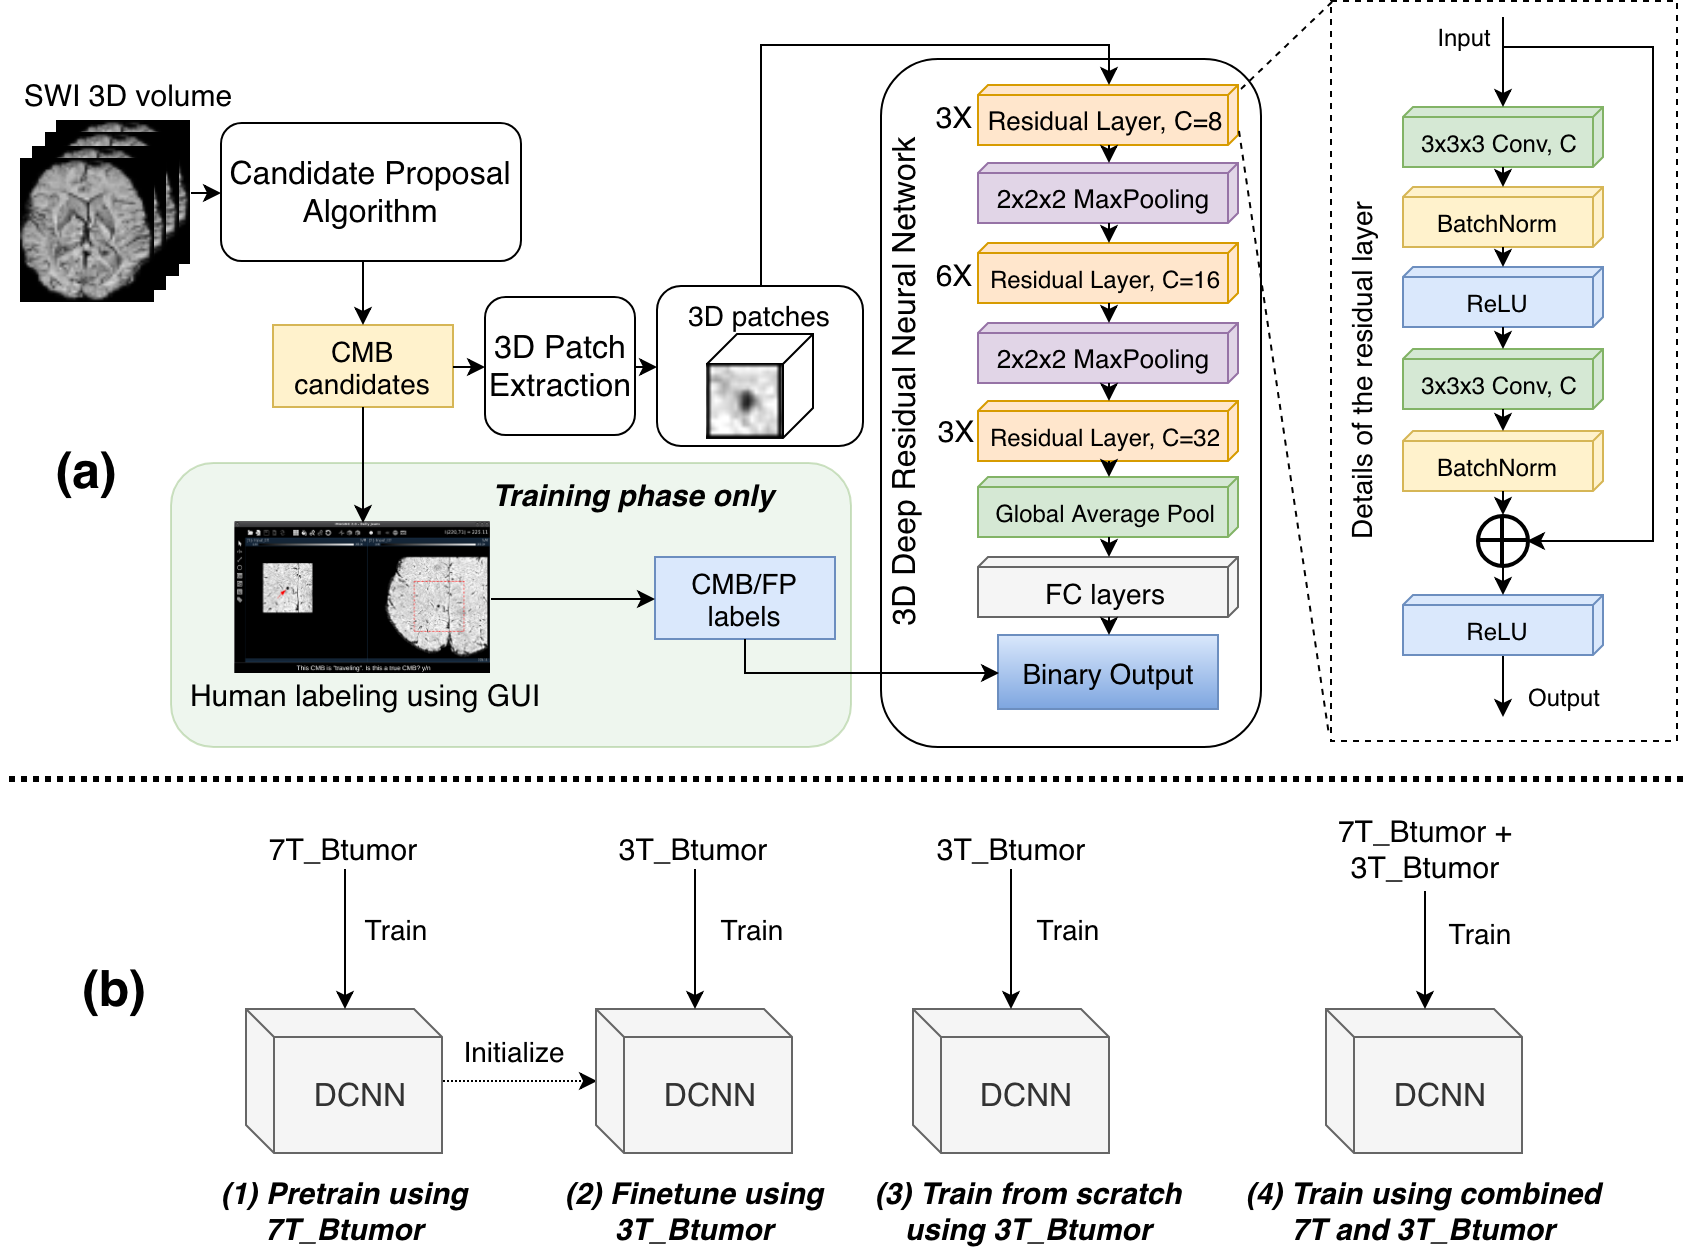
DCNN-based algorithm: The original automatic CMB detection algorithm was a patch-based DCNN with residual architecture that was applied after the identification of candidate CMBs using a previously developed detection algorithm designed to maximize sensitivity3. Figure 1 shows the overall schematic of the algorithm, the detailed architecture of the networks, and the 4 training strategies tested.
Dataset: Figure 2 summarizes the 3 different datasets included: 1) 7T_Btumor: 7T SWI scans of brain tumor patients with radiation induced CMBs were acquired on a GE 7T scanner using either a standard SWI sequence (resolution=0.5x0.5x2mm, FOV=24x24cm, TE=16ms, TR=50ms, 49 subjects) or a 4-echo 3D TOF-SWI sequence4 (resolution=0.5x0.5x1mm, TE=2.7,10.4,13.2,20.9ms, TR=40ms, 31 subjects); 2) 3T_Btumor: 3T SWI scans of brain tumor patients with radiation induced CMBs patients were scanned on a 3T GE system (resolution=0.5x0.5x2mm, FOV=24x24cm, TE=28ms, TR=46ms) and 3) 3T_CCM: 3T SWI was performed in patients with cerebral cavernous malformation (CCM) on a Siemens 3T scanner using a standard sequence (resolution=1x1x1.5mm, FOV=25.6x19.2cm, TE=20ms, TR=28ms). The GE SWI images were reconstructed using in-house software and CMBs/FPs were labeled by experienced researchers assisted by a user-guided GUI previously developed in our group5.
Training and Evaluation: 12 subjects in the 7T_Btumor dataset (370CMBs + 1203FPs), 16 subjects in 3T_Btumor dataset (362CMBs + 2367FPs) and all subjects in 3T_CCM were used as the test set. The remaining data were used in training/evaluation with 5-fold cross-validation. The models were optimized using an Adam optimizer with 1e-4 learning rate (gradually reduced to 1e-6 when loss plateaued). AUC, classification sensitivity, precision, and mean number of remaining FPs/scan were calculated to evaluate model performance. During the testing phase, CMB likelihood values were generated for all candidates by averaging the result from each 5-fold-model. A threshold of 0.1 was selected to maximize detection sensitivity.
Results and Discussion
Direct application of pre-trained models: Figure 3, rows 1-2, shows that directly applying the original 7T pre-trained model to the 3T_Btumor dataset achieved slightly lower AUC scores for the 3T_Btumor test data compared to the 7T_Btumor test set.
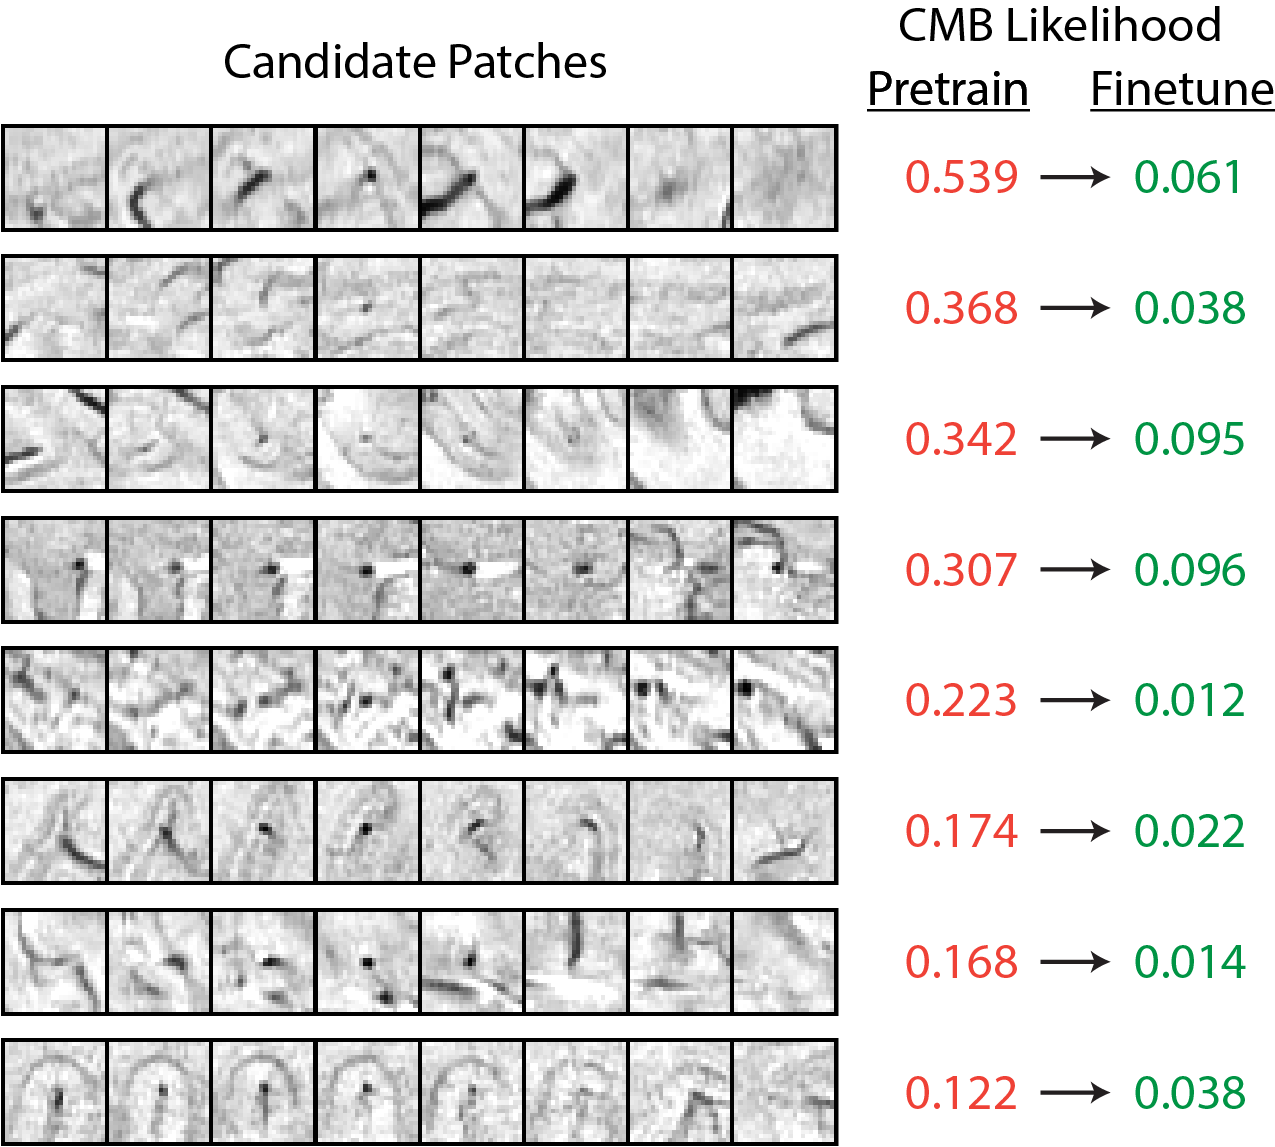
The effects of fine-tuning the pre-trained 7T model v.s. training from scratch: Figure 3 rows 4-7 compare the performance of fine-tuning the pre-trained 7T model using 3T_Btumor data with training new models that only use 3T_Btumor data. Fine-tuning the pre-trained model achieved higher performance (improved CMB classification AUC scores) for both the 3T_Btumor and 3T_CCM datasets, while training new models degraded the performance. Figure 4 shows several examples of how fine-tuning the 7T model with 3T data further reduced FP mimics in the 3T test set.
Training on a combined 3T and 7T brain tumor dataset: Although the model trained using the combined dataset outperformed the one trained only on 7T_Btumor data (Figure 3 rows 9 and 2) for the 3T_Btumor test set, this model was not significantly better than the 7T model that was fine-tuned with 3T data (Figure 3 rows 9 and 4). Figure 5 compares the ROC curves of the different training strategies, highlighting the benefits of using the combined dataset.
Application to a new disease not encountered during training: For the 3T_CCM test set, the combined trained model performed significantly better than both the pre-trained and fine-tuned models (Figure 3 rows 10, 3 and 5, Figure 5(c)), likely due to the greater percentage of CMBs/scan in this dataset. Although the performance of all models was worse for the 3T_CCM test set because they were provided with examples of this data during training, the combined DCNN still greatly reduced the number of FPs in CMB detection.
Conclusions
Our DCNN-based CMB detection algorithm is generalizable to different scan environments, parameters, and pathologies. The strategy of fine-tuning the existing pre-trained 7T model with 3T data outperformed training a separate model with only 3T data. Future studies will incorporate additional data from other pathologies into the model training.
Acknowledgements
The authors acknowledge NICHD grant R01-HD079568, NINDS grant U54-NS065705, and funding from GE Healthcare.References
- Lupo, JM., et al. "The effects of anti-angiogenic therapy on the formation of radiation-induced microbleeds in normal brain tissue of patients with glioma." Neuro-oncology 18.1 (2015): 87-95.
- Chen, Y., et al. “Toward Automatic Detection of Radiation-Induced Cerebral Microbleeds Using a 3D Deep Residual Network.” Journal of Digital Imaging. (In press)
- Bian, W., et al. "Computer-aided detection of radiation-induced cerebral microbleeds on susceptibility-weighted MR images." NeuroImage: clinical 2 (2013): 282-290.
- Bian, W., et al. “Simultaneous imaging of radiation‐induced cerebral microbleeds, arteries and veins, using a multiple gradient echo sequence at 7 Tesla.” Journal of Magnetic Resonance Imaging, 42.2 (2015): 269-279.
- Morrison, M., et al. "A user-guided tool for semi-automated cerebral microbleed detection and volume segmentation: Evaluating vascular injury and data labelling for machine learning." NeuroImage: Clinical 20 (2018): 498-505.
Figures