0668
Deriving Brain Myelin Water Fraction Maps from Relaxometry: a Data-Driven Approach1Advanced Clinical Imaging Technology, Siemens Healthcare AG, Lausanne, Switzerland, 2Department of Radiology, Centre Hospitalier Universitaire Vaudois (CHUV), Lausanne, Switzerland, 3LTS5, École Polytechnique Fédérale de Lausanne (EPFL), Lausanne, Switzerland
Synopsis
Currently, one of the gold-standard methods to obtain brain myelin water fraction (MWF) maps is the multi-echo spin-echo sequence. To overcome some of its limitations (e.g. long acquisition times), a data-driven approach for deriving MWF maps is proposed here. A general linear model (GLM) and a conditional generative adversarial network (cGAN) were trained to learn the reference MWF from T1 and T2 maps acquired in a healthy cohort. While GLM-derived maps exhibited MWF overestimation, especially in WM tissue, the cGAN yielded images in agreement with the reference. The proposed methods were preliminarily tested in patients and revealed myelin degradation in expected areas.
Introduction
One of the current gold-standard methods for in vivo myelin water imaging (MWI) in the human brain is based on the multi-echo spin-echo (MESE) sequence. Typically, a model is fitted to the acquired T2 decays to estimate the contributions of three water compartments (myelin, intra-/extra-cellular and free water) to the overall signal intensity and derive myelin water fraction (MWF) maps accordingly1.
The main limitations of MWI with MESE sequences are B1 sensitivity, high energy deposit restrictions, and long acquisition times. Various methods were developed to address these challenges2. One of particular interest to this work derives MWF maps from quantitative T1 and T2 measurements using physical models3. Following the rationale that relaxometry maps contain MWF information, this work aims at a data-driven estimation of MWF maps from relaxometry using machine learning.
Methods
After obtaining written informed consent, MESE data were acquired from 20 healthy volunteers (12 female, age range = [23-33]$$$\,$$$y/o) at 3T (MAGNETOM Skyra, Siemens Healthcare, Erlangen, Germany) using a standard 64-channel head/neck coil. Using the MP2RAGE4 and GRAPPATINI5 prototype sequences, whole-brain T1 and T2 maps were acquired in 6:24$$$\,$$$minutes (Table 1). Relaxometry data were also acquired in three patients with multiple sclerosis6 (MS).
Extended-phase-graph simulations7,8 were used to estimate voxel-wise the T2 spectrum with a regularized non-negative least-squares optimization9. No a priori assumption was made on the number of water compartments, and the MWF cutoff time was set to 40$$$\,$$$ms. Brain tissues were segmented on the MP2RAGE contrast using the in-house prototype software MorphoBox10. Nineteen bilateral ROIs were selected for analysis (Figure 1). The first echo of the MESE was rigidly registered to the MP2RAGE, and the resulting transformation was applied to the MWF map using Elastix11.
Based on prior work3, it was first hypothesized that a general linear model (GLM) would suffice to describe the relation between MWF and relaxation times; a GLM was thus built using averaged values of MWF, T1 and T2 from all extracted ROIs:
$$\mathbb{E}\{MWF\}=\beta_0+\beta_{T1}T1+\beta_{T2}T2+\beta_{T1T2}T1\!\cdot{\!T2}+\beta_{T1^2}T1^2+\beta_{T2^2}T2^2.$$
A second method based on a multi-channel conditional generative adversarial network12 (cGAN) was designed to derive the reference MWF from T1 and T2 maps. The architecture for the generator (G) and the discriminator (D) were the same as in12. Training was performed over 400 epochs using the Adam optimizer. The final loss function ($$$J$$$) was obtained by also including a voxel-wise L1 distance between the target $$$y$$$ and the output of the network $$$G(x,z)$$$:
$$J_{cGAN}(G,D)=\arg\min_{G}\max_{D}\mathbb{E}_{x,y}\{log[D(x,y)]\}+\mathbb{E}_{x,z}\{log[1-(D(x,G(x,z))]\}+\lambda\mathbb{E}_{x,y,z}\{\mid\!y-G(x,z)\!\mid\},$$
with $$$x$$$ being the network input, $$$z$$$ random noise, and $$$\lambda$$$ the weighting term of the voxel-wise loss.
Within each iteration of a 10-fold cross-validation, the GLM and the cGAN were trained with 18 subjects and tested on the remaining two. ROIs averaged values of the derived MWF maps were compared to the reference with a two-tailed t-test.
After retraining the GLM and the cGAN using the entire healthy cohort, MWF maps were derived in the MS patients.
Results
The adjusted coefficient of determination of the GLM (averaged across all cross-validation iterations) was 0.89, meaning that relaxation times can explain 89% of the MWF variation. The Pearson’s correlation coefficient between reference and cGAN-derived MWF maps was 0.87.
Visually, GLM-based MWF maps appeared more blurred and homogeneous than the reference. In contrast, MWF maps derived by the cGAN better captured MWF variabilities in fine structures (Figure 2). Direct comparison against reference values within ROIs revealed no significant difference for cGAN-derived maps, while the GLM overestimated the MWF, especially in white matter tissues (Figure 3).
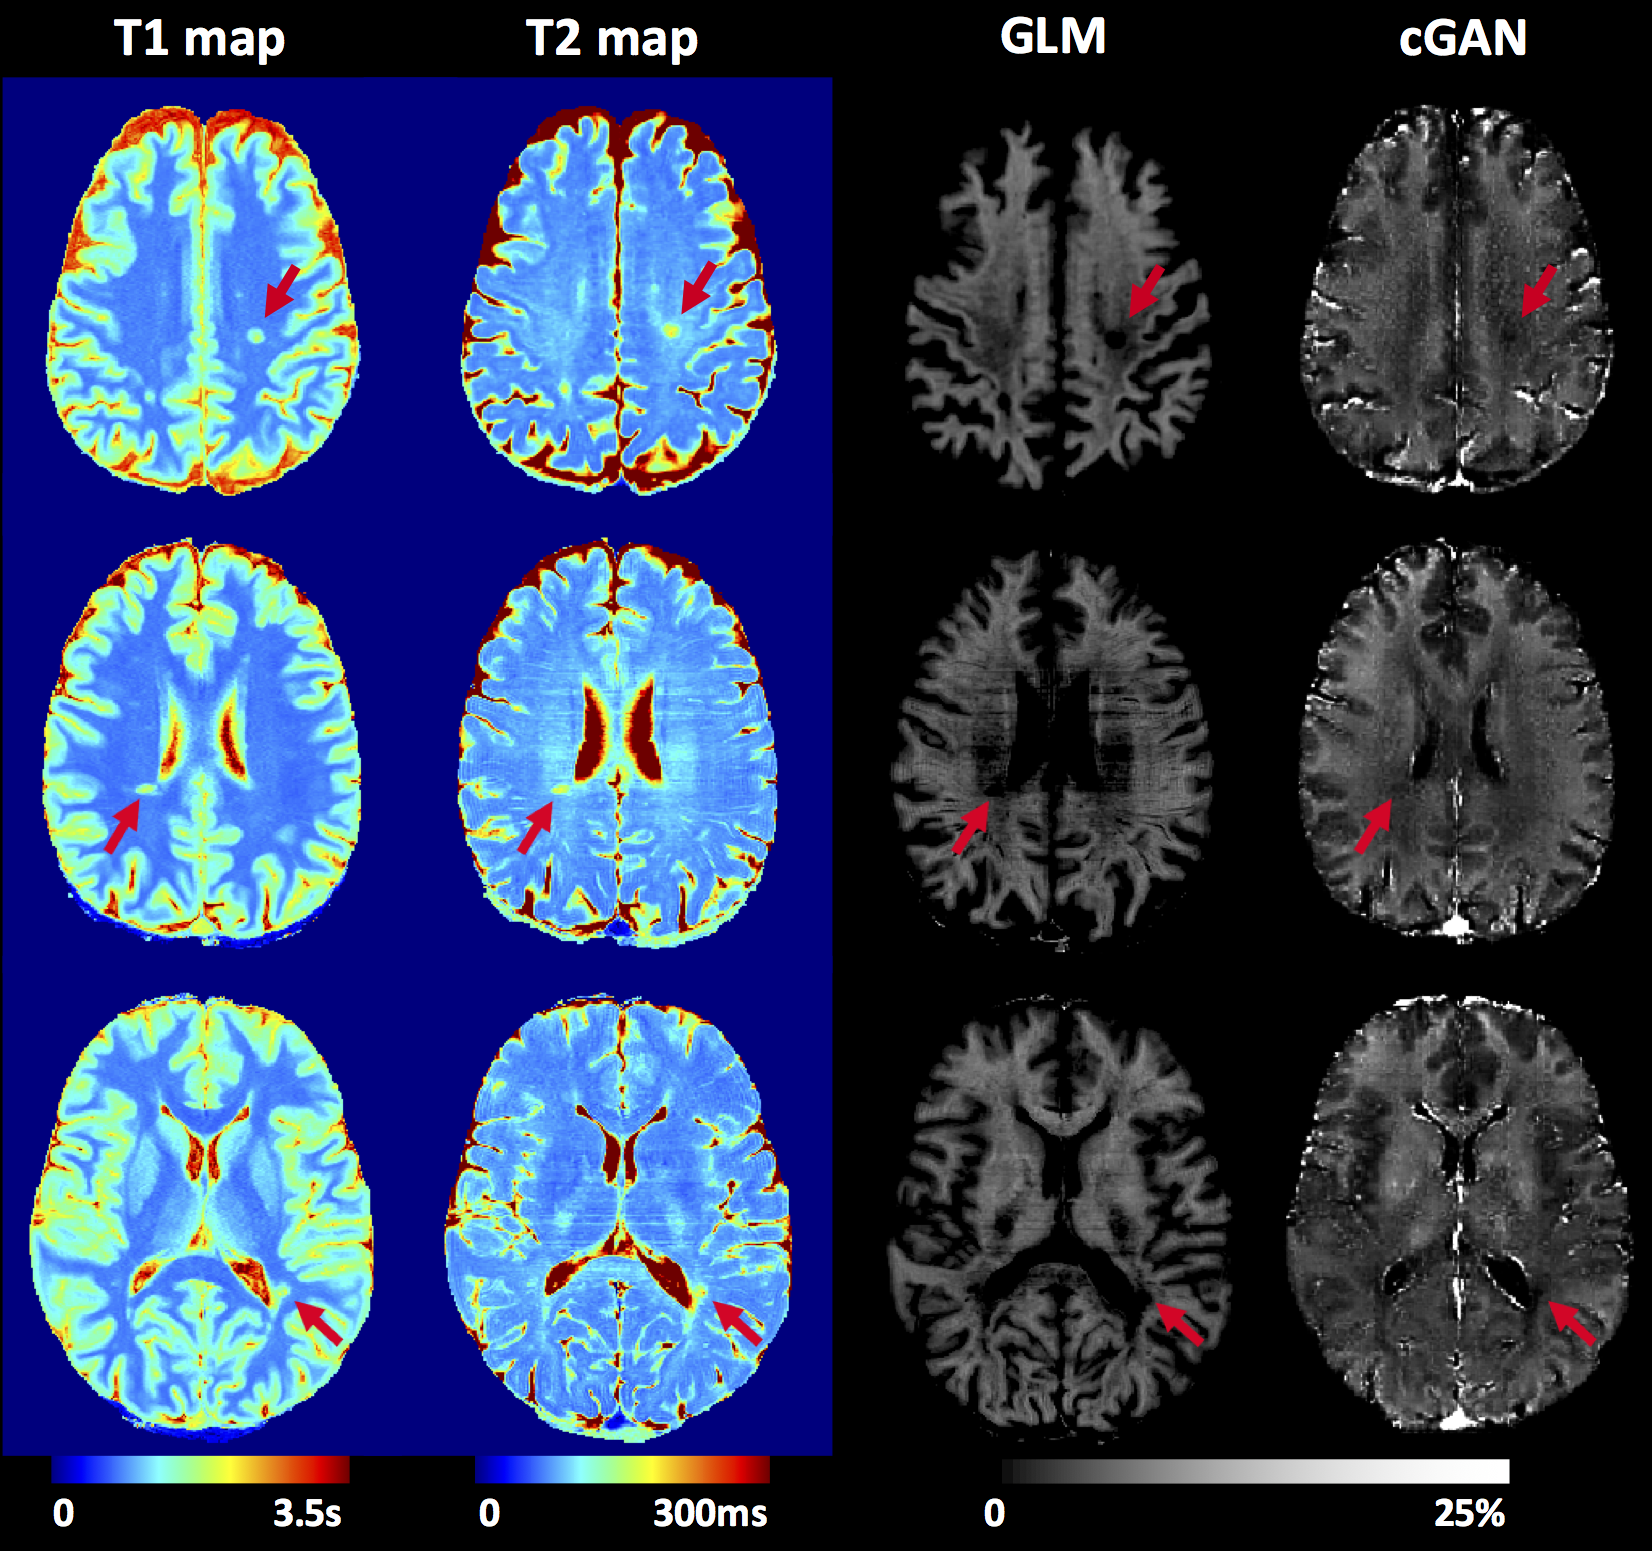
A decrease in myelin content was visible in the lesions of the MS patients (Figure 4).
Discussion
The feasibility of a data-driven approach for deriving brain MWF from T1 and T2 maps was demonstrated within a dataset of healthy volunteers, with preliminary results in MS patients. In 6:24$$$\,$$$minutes, the employed protocol for brain relaxometry may thus provide whole-brain MWF maps along with T1-/T2 maps and, optionally, simulated “clinical” contrasts.
The capability of modelling non-linearities in the data and the spatial awareness of the cGAN probably explains the better performance in comparison to the GLM. However, other regression-based methods that can model non-linearity13 should be investigated in the future.
Notably, although patient data was not used for training, in the MS cases a reduction of myelin content was observed in regions where myelin degradation is expected6.
Conclusion
Two modelling approaches, GLM and cGAN, were investigated for deriving MWF maps from relaxometry data. The employed protocol for fast and whole-brain relaxometry in combination with machine learning thereby provided maps which showed high correlation with the reference; this could have the potential to replace time-consuming MESE acquisitions.Acknowledgements
No acknowledgement found.References
1. Mackay A, Whittall K, Adler J, Li D, Paty D, Graeb D. In vivo visualization of myelin water in brain by magnetic resonance. Magn Reson Med. 1994;31(6):673-677.
2. Alonso-Ortiz E, Levesque IR, Pike GB. MRI-based myelin water imaging: A technical review. Magn Reson Med. 2015;73(1):70-81.
3. Warntjes M, Engström M, Tisell A, Lundberg P. Modeling the presence of myelin and edema in the brain based on multi-parametric quantitative MRI. Front Neurol. 2016;7:16.
4. Marques JP, Kober T, Krueger G, van der Zwaag W, Van de Moortele P-F, Gruetter R. MP2RAGE, a self bias-field corrected sequence for improved segmentation and T1-mapping at high field. Neuroimage. 2010;49(2):1271-1281.
5. Hilbert T, Sumpf TJ, Weiland E, et al. Accelerated T2 mapping combining parallel MRI and model‐based reconstruction: GRAPPATINI. J Magn Reson Imaging. 2018;48:359-368.
6. Reich DS, Lucchinetti CF, Calabresi PA. Multiple Sclerosis. N Engl J Med. 2018;378(2):169-180.
7. Hennig J. Multiecho imaging sequences with low refocusing flip angles. J Magn Reson. 1988;78(3):397-407.
8. Weigel M. Extended phase graphs: Dephasing, RF pulses, and echoes - Pure and simple. J Magn Reson Imaging. 2015;41(2):266-295.
9. Whittall KP, MacKay AL. Quantitative interpretation of NMR relaxation data. J Magn Reson. 1989;84(1):134-152.
10. Schmitter D, Roche A, Maréchal B, et al. An evaluation of volume-based morphometry for prediction of mild cognitive impairment and Alzheimer’s disease. NeuroImage Clin. 2015;7:7-17.
11. Klein S, Staring M, Murphy K, Viergever MA, Pluim JPW. Elastix: a toolbox for intensity-based medical image registration. IEEE Trans Med Imaging. 2010;29(1):196-205.
12. Isola P, Zhu J-Y, Zhou T, Efros AA, Research BA. Image-to-Image Translation with Conditional Adversarial Networks. arXiv Prepr. 2017.
13. Nataraj G, Nielsen JF, Scott C, Fessler JA. Dictionary-Free MRI PERK: Parameter Estimation via Regression with Kernels. IEEE Trans Med Imaging. 2018;37(9):2103-2114.
Figures