0667
Automated whole-body adipose tissue segmentation in T1-weighted fast spin echo imaging in a cohort of subjects at increased risk for type 2 diabetesThomas Kuestner1,2,3, Martin Schwartz2,3, Yipin Zhu3, Petros Martirosian2, Bin Yang3, Sergios Gatidis2, Jürgen Machann2, and Fritz Schick2
1King's College London, London, United Kingdom, 2Department of Radiology, University Hospital Tübingen, Tübingen, Germany, 3Institute of Signal Processing and System Theory, University of Stuttgart, Stuttgart, Germany
Synopsis
Quantification and localization of adipose tissues in whole-body T1-weighted MR images is of high interest to examine metabolic conditions. For correct identification and phenotyping of subjects at increased risk for metabolic diseases, reliable automatic segmentation of adipose tissue into subcutaneous adipose tissue and visceral adipose tissue is required. Full manual tissue delineation is a time-and cost-intensive task which is not advisable especially in cohort studies. We propose a 3D convolutional neural network to perform automated adipose tissue segmentation from T1-weighted whole-body fast spin echo images in a fast and robust way with reliable separation of visceral and subcutaneous fat masses.
Introduction
Identification of distribution and type of adipose tissue (AT) in the human body plays an important role in the pathogenesis of metabolic diseases1. The comparison of AT distribution in subgroups with different anthropometric parameters and metabolic conditions is of interest in order to identify and quantify high-risk subjects as well as to establish patient-specific treatments. In order to determine the risk of diabetes, the spatial distribution and quantity of subcutaneous adipose tissue (SCAT) and visceral adipose tissue (VAT) gives a good indicator2. Especially in large cohort studies, manual tissue delineation (labeling) demands time- and cost-intensive efforts by clinical experts which is not feasible. Therefore, a reliable and automatic assessment is of great interest. Furthermore, the acquired MR images may suffer under magnetic field inhomogeneity artifacts which originate from field strength dependency due to bias-field non-uniformity resulting in varying image intensity. These artifacts are especially prominent in systems with field strengths >1.5T. Thus, correct tissue classification can be hampered and classical segmentation algorithms are misguided by this intensity variation. In order to overcome the limitation of previously described approaches for this task3,4,5, i.e. intensity and boundary based methods, we propose the usage of a 3D convolutional neural network (CNN) for AT segmentation and determination of whole-body AT distribution. We utilize our previously proposed DCNet6,7 and extend it by merge-and-run blocks to capture more multi-resolutional features simultaneously for accurate whole-body AT classification. Once trained the network can estimate the AT distribution markedly faster than previously described methods3,4,5 saving time and costs.Material and Methods
Anisotropic 2D transverse T1w FSE whole-body data sets1
were acquired in a multi-center study on several different 1.5T (Siemens MAGNETOM
Sonata Vision and Avanto) and 3T MR systems (Siemens MAGNETOM Prisma and Vida)
covering the entire body in prone stretched position and allowing fast
whole-body coverage. All data sets were semi-automatically labeled in four
classes: background (BG), lean tissue (LT), SCAT and VAT. A classical boundary
and intensity based approach3 was used for this and afterwards, all
segmentation masks were inspected and corrected manually by skilled experts.
The
proposed neural network is based on our 3D DCNet approach6,7 which
consists of an encoding and decoding branch with convolution and deconvolution
layers for feature map down-/upscaling in the respective branches as shown in
Fig. 1. Each branch consists of four stages. Shortcut connections between
branches and inside stages forward residual information. In contrast to the
previous DCNet, each stage consists of merge-and-run mapping blocks8.
Each merge-and-run mapping block consists of parallel branches with two 3D
convolutions, rectified linear unit activation and batch normalization. This
assembles several residual branches in parallel by adding the average of the
input branches to the subsequent residual branch, and thus directly leading to
a reduced network depth. The receptive field of the merge-and-run blocks was
globally enhanced by adding global residual branches to the local residual
paths by applying dilated convolutional kernels. This allows dealing with the
single-channel input in a robust way and enables a wider multi-resolutional
receptive field whilst also avoiding pooling layers. Input images were cropped
from 256×178×98-120 to 32×32×32 overlapping blocks. The output into the four
classes (background, lean tissue, SCAT, VAT) is generated by a finalizing layer
with softmax activation function. Network weights were optimized by RMSprop
with multi-class Focal Loss9 and multi-metric (true-positive, recall
and Jaccard index), batch-size 48, 60 epochs. Out of 2000 subjects the neural
network was trained on 300 randomly selected subjects (1.5T: 150, 3T: 150) with
80 validation and 306 test subjects (1.5T: 100, 3T: 206). Different training cases
were conducted to evaluate the influence of intensity inhomogeneities on the classification
result (Tab. 1).Results and Discussion
Fig. 2 and 3 show exemplary
results of the CNN segmentation masks color-coded overlaid to the MR image as
well as the obtained recall per class and accuracies over all test subjects. Visual
inspections of the segmentation output reveal good agreement to the manual
labeled ground truth. Estimation is more robust to intensity inhomogeneities if
3T data is considered in training. Training of the CNN required 25h whereas
only 5-7s are needed for label prediction after data set loading – compared to
15min in the classical boundary and intensity based approach. AT distribution
over the slices shows good agreement with ground truth. Fig. 4 depicts gender-specific
tissue distributions in head-feet direction for all male and female subjects.Conclusion
Automatic, robust and fast AT segmentation together with standardized topography mapping is feasible in whole-body T1-weighted image data sets by convolutional neural networks.Acknowledgements
No acknowledgement found.References
1. Machann J, Thamer C, Schnoedt B, Haap M, Haring HU, Claussen CD, Stumvoll M, Fritsche A, Schick F. Standardized assessment of whole body adipose tissue topography by MRI. Journal of Magnetic Resonance Imaging: An Official Journal of the International Society for Magnetic Resonance in Medicine 2005;21(4):455-462.2. Storz C, Heber SD, Rospleszcz S, Machann J, Sellner S, Nikolaou K, Lorbeer R, Gatidis S, Elser S, Peters A, Schlett CL, Bamberg F. The role of visceral and subcutaneous adipose tissue measurements and their ratio by magnetic resonance imaging in subjects with prediabetes, diabetes and healthy controls from a general population without cardiovascular disease. The British journal of radiology 2018;91(1089):20170808.
3. Würslin C, Machann J, Rempp H, Claussen C, Yang B, Schick F. Topography mapping of whole body adipose tissue using a fully automated and standardized procedure. Journal of Magnetic Resonance Imaging: An Official Journal of the International Society for Magnetic Resonance in Medicine 2010;31(2):430-439.
4. Karlsson A, Rosander J, Romu T, Tallberg J, Grönqvist A, Borga M, Dahlqvist Leinhard O. Automatic and quantitative assessment of regional muscle volume by multi‐atlas segmentation using whole‐body water–fat MRI. Journal of Magnetic Resonance Imaging 2015;41(6):1558-1569.
5. Addeman BT, Kutty S, Perkins TG, Soliman AS, Wiens CN, McCurdy CM, Beaton MD, Hegele RA, McKenzie CA. Validation of volumetric and single‐slice MRI adipose analysis using a novel fully automated segmentation method. Journal of Magnetic Resonance Imaging 2015;41(1):233-241.
6. Küstner T, Müller S, Fischer M, Weiβ J, Nikolaou K, Bamberg F, Yang B, Schick F, Gatidis S. Semantic Organ Segmentation in 3D Whole-Body MR Images. 2018. IEEE. p 3498-3502.
7. Küstner T, Fischer M, Müller S, Gutmann D, Nikolaou K, Bamberg F, Yang B, Schick F, Gatidis S. Automated segmentation of abdominal organs in T1-weighted MR images using a deep learning approach: application on a large epidemiological MR study. Proceedings of the International Society for Magnetic Resonance in Medicine (ISMRM). Paris, France2018.
8. Zhao L, Wang J, Li X, Tu Z, Zeng W. Deep convolutional neural networks with merge-and-run mappings. arXiv preprint arXiv:161107718 2016.
9. Lin T, Goyal P, Girshick R, He K, Dollár P. Focal Loss for Dense Object Detection. 2017 22-29 Oct. 2017. p 2999-3007.
Figures
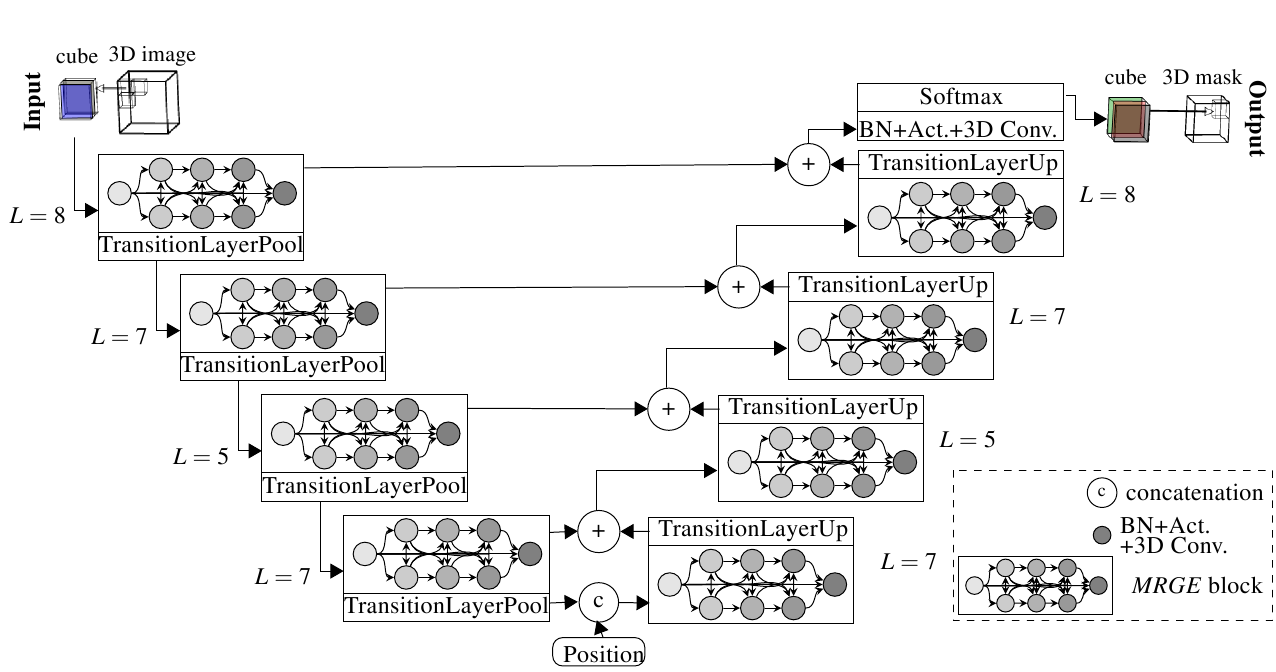
Fig. 1: Proposed DCNet with merge-and-run mapping
blocks for automatic adipose tissue segmentation. It consists of an encoding
(left) and decoding (right) branch. Each stage consists of merge-and-run
mapping blocks which are composed of batch normalization (BN), ReLU activation
function and 3D convolutional layer.

Fig.
2: Eight exemplary slices of a patient scanned on a 1.5T MRI. Labeled ground
truth and predicted segmentation results for networks trained on only 1.5T
patients, 3T patients, transfer learning from 1.5T to 3T and on 1.5T+3T
patients together (background: black, lean tissue: green, SCAT: red, VAT:
yellow). The obtained recall per class and overall accuracy for all 1.5T test
patients are depicted below.

Fig.
3: Eight exemplary slices of a patient scanned on a 3T MRI. Labeled ground
truth and predicted segmentation results for networks trained on only 1.5T
patients, 3T patients, transfer learning from 1.5T to 3T and on 1.5T+3T
patients together (background: black, lean tissue: green, SCAT: red, VAT:
yellow). The obtained recall per class and overall accuracy for all 3T test
patients are depicted below.

Fig. 4: Absolute and relative tissue
distributions in head-feet direction for lean tissue (green), VAT (red) and
SCAT (blue). Average and standard
deviation over all male and female subjects with low and high BMI are
depicted.
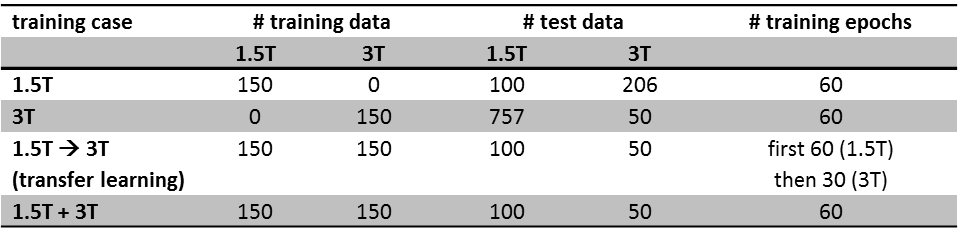
Tab.
1: Training cases to evaluate influence of intensity inhomogeneities. Database
was divided into patients scanned on a 1.5T MRI and 3T MRI.