0656
Validation of diffusion models: a post-mortem MRI and histology study1Center for Brain Imaging Science and Technology, Key Laboratory for Biomedical Engineering of Ministry of Education, College of Biomedical Engineering and Instrumental Science, Zhejiang University, Hangzhou, China, 2China Brain Bank and Department of Neurology in Second Affiliated Hospital, Key Laboratory of Medical Neurobiology of Zhejiang Province, Zhejiang University School of Medicine, Zhejiang University, Hangzhou, China, 3Department of Anatomy and Neurosciences, Amsterdam Neuroscience, Amsterdam UMC, location VUmc, Amsterdam, Netherlands, 4Department of Imaging Sciences, University of Rochester, Rochester, NY, United States
Synopsis
The Diffusion Kurtosis Imaging (DKI) model can successfully characterize non-Gaussian diffusion. In turn, the White Matter Tract Integrity (WMTI) model is proposed to be based on the DKI model to further characterize the intra- and extra-axonal compartments. However, the accuracy with which model parameters reflect the underlying tissue characteristics has not been tested. Here, we compared two MRI model metrics using a unique combined post-mortem MRI and histopathology approach. Preliminary results show that AWF, $$$D_{e,\perp}$$$and MD from MRI correlate strongly with myelin fraction and that $$$D_{e,\parallel}$$$ from MRI correlates strongly with astrocyte fraction.
Background and purpose
For monitoring of disease progression or treatment effects, there is a need for validation of different quantitative non-invasive biomarkers in monitoring microstructure changes. Diffusion Kurtosis Imaging (DKI), an extension of Diffusion Tensor Imaging (DTI), is shown to be accounting for the non-Gaussian effects of DTI1. Building on DKI, the White Matter Tract Integrity (WMTI) model is proposed2 to characterize the intra- and extra-axonal compartments with the metrics of axonal water fraction (AWF), intra-axonal diffusivity ($$$D_a$$$), extra-axonal radial ($$$D_{e,\perp}$$$), and axial diffusivity ($$$D_{e,\parallel}$$$). In this study we evaluated the potential of DKI and WMTI parameters in monitoring tissue microstructure change by comparing with histological examination.Methods
DKI model: the diffusion signal is modeled as:
$$\frac{S(b)}{S(0)}=e^{-bD+\frac{1}{6}b^2D^2K+O(b^3)}$$
The model is extended to characterize the non-Gaussian diffusion pattern by introducing symmetric fourth order diffusion kurtosis tensor.
WMTI model is a model that relates DKI metrics directly to WM microstructure. This model applies to highly aligned fiber bundles and partitions water into two compartments, the intra- and extra-axonal space, with the metrics of AWF, $$$\bf D_a$$$, and $$$\bf D_e$$$ based on the following relationships derived by Fieremans2.$$f=\frac{K_{max}}{K_{max}+3(1-\frac{\sqrt{K_{max}}(D_a-D_{a,min})}{D_1\sqrt{K_1}+D_2\sqrt{K_2}+D_3\sqrt{K_3}})^2}, D_{e,i}=D_i(1+\sqrt{\frac{K_if}{3(1-f)}}), D_{a,i}=D_i(1-\sqrt{\frac{K_i(1-f)}{3f}}) (i=1,2,3)$$ where $$$f$$$ is axon water fraction (AWF), $$$K_{max}$$$ is the maximum kurtosis over all directions, and $$$D_a$$$ is the intra-axonal diffusion coefficient with $$$D_{a,min}$$$ being a lower bound for $$$D_a$$$. $$$D_i$$$, $$$K_i$$$, $$$D_{e,i}$$$, and $$$D_{a,i}$$$ with $$$i=1,2,3$$$ are the overall diffusivity, kurtosis, extra-axonal diffusivity and intra-axonal diffusivity along the axis directions of a chosen reference frame. And the extra-axonal axial $$$D_{e,\parallel}$$$ and radial $$$D_{e,\perp}$$$ diffusivities are then derived from the eigenvalues $$$\lambda_{e,1}$$$, $$$\lambda_{e,2}$$$, and $$$\lambda_{e,3}$$$ of $$$\bf D_e$$$ as $$$D_{e,\parallel}=\lambda_{e,1}$$$ and $$$D_{e,\perp}=\frac{\lambda_{e,2}+\lambda_{e,3}}{2}$$$. The intra-axonal diffusivity $$$D_a$$$ is calculated as $$$D_a=tr(\bf D_a$$$$$$)$$$.
Materials: A formalin fixed single hemisphere brain of a 62-year-old male patient with schizophrenia was obtained from China Brain Bank (Zhejiang University School of Medicine).
MRI: dMRI data was acquired on a 3T MAGNETON Prisma (Siemens Healthcare, Erlangen, Germany), b values of 1000, 2000, 4000, 6000, 8000, and 10000 $$$\tt {s/mm^2}$$$ over 30 gradient directions, with 18 non-diffusion-weighted data set acquired after every 10 different-weighted data sets, and an isotropic resolution of 1.8 mm. DKI-derived mean diffusivity (MD) and mean kurtosis (MK) were calculated using the DKE software while WMTI-derived metrics were calculated in MATLAB.
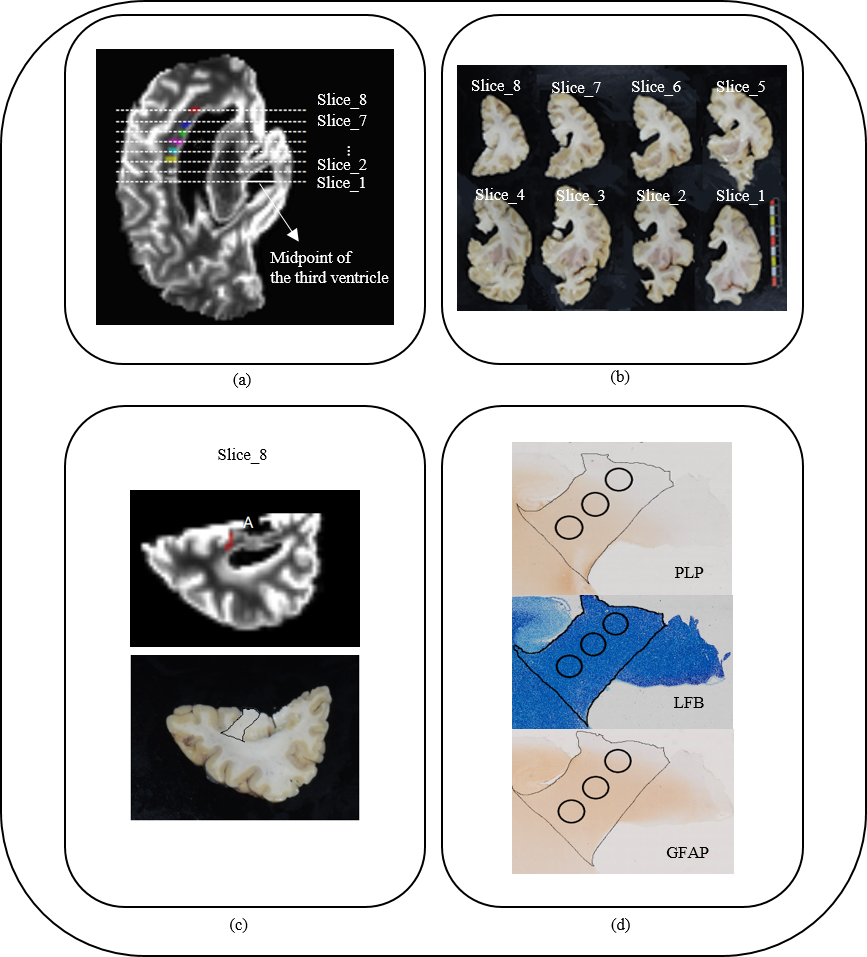
Histology: After MRI, the brain was cut into 5 mm thick coronal slices using a 5 mm deep cutting panel from midpoint of the third ventricle to the anterior shown in Figure. 1(a). Then the tissue blocks were dissected from corpus callosum and cut into 6 µm thick sections for immunohistochemistry. The tissue sections were stained with antibodies against myelin proteo-lipid protein (PLP; AT11024; SIGMA; 1:200), and glial fibrillary acidic protein (GFAP; AB5804; MILLIPORE; 1:1000) for astrocytes. Also Luxol fast blue (LFB) stains were used for myelin. Digitization of the stained sections was performed on an OLYMPUS VS120 (Japan) using x10 magnifying objective, leading to a resolution of 0.69 µm/pix. Myelin fraction and astrocyte fraction in corpus callosum were measured in PLP-stained/LFB stained and GFAP-stained sections using ImageJ. Staining signal above threshold levels were compared between the ROI on each slice of the brain.
Statistical analysis: For each slice, correlations between MR measures (MD, MK, etc) and histological measures (myelin and astrocyte area fraction) were evaluated using one tailed Spearman's correlation coefficient implemented in SPSS.
Results
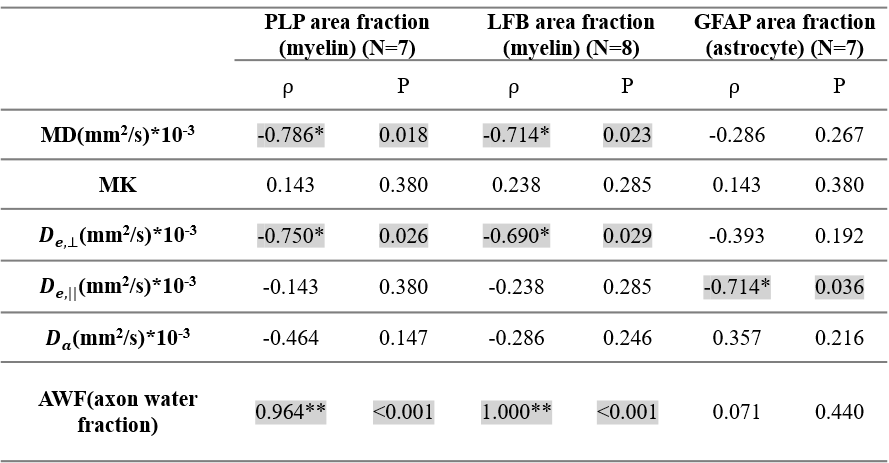
Figure 2 provides the results of the statistical analysis. WMTI-derived AWF showed strong significant correlations with myelin fraction of either PLP ($$$\rho$$$=0.964, P<0.001) or LFB ($$$\rho$$$=1.000, P<0.001). Increased DKI-derived MD and WMTI-derived $$$D_{e,\perp}$$$ also had significant correlations with reduced myelin fraction (MD: $$$\rho$$$=-0.786, P=0.018 for PLP and $$$\rho$$$=-0.714, P=0.023 for LFB; $$$D_{e,\perp}$$$ : $$$\rho$$$=-0.750, P=0.026 for PLP and $$$\rho$$$=-0.690, P=0.029 for LFB). WMTI-derived $$$D_{e,\parallel}$$$ showed a negative correlation with astrocyte fraction ($$$\rho$$$=-0.714, P=0.036).Discussion and conclusion
DKI-
and WMTI-derived metrics were compared to histological measures in an ex vivo
human brain sample. Our results provide evidence for decreased AWF and
increased MD and $$$D_{e,\perp}$$$, which
has been proposed as a specific marker of demyelination3-5. The $$$D_{e,\parallel}$$$ of
WMTI model has a significant negative correlation with astrocyte staining in
histology. The results provide evidence of AWF, MD and $$$D_{e,\perp}$$$ as promising
metrics for detecting demyelination and $$$D_{e,\parallel}$$$ for gliosis
process. When confirmed in a larger cohort with different pathologies, WMTI
measures may provide an accurate detection of demyelination and gliosis, a
valuable biomarker for some neurological disease.Acknowledgements
This work was supported by National Key R&D Program of China (2017YFC0909200), NSFC (81871428, 91632109) and Shanghai Key Laboratory of Psychotic Disorders(13dz2260500).References
- Kiselev V G, Il'Yasov K A, et al. Is the “biexponential diffusion” biexponential?. Magnetic Resonance in Medicine. 2007; 57(3): 464-469.
- Fieremans, E., Jensen, J.H., Helpern, J.A, et al. White matter characterization with diffusional kurtosis imaging. NeuroImage. 2011; 58: 177–188.
- Fieremans E, Benitez A, Jensen J H, et al. Novel White Matter Tract Integrity Metrics Sensitive to Alzheimer Disease Progression. Ajnr American Journal of Neuroradiology. 2013; 34(11): 2105-2112.
- Benitez A, Fieremans E, Jensen J H, et al. White matter tract integrity metrics reflect the vulnerability of late-myelinating tracts in Alzheimer's disease. Neuroimage Clinical. 2014; 4: 64-71.
- Jelescu I O, Zurek M, Winters K V, et al. In vivo quantification of demyelination and recovery using compartment-specific diffusion MRI metrics validated by electron microscopy. Neuroimage. 2016; 132: 104-114.
Figures