0655
The two-compartment diffusion “standard model” misestimates microscopic anisotropy in-vivo1Champalimaud Neuroscience Programme, Champalimaud Centre for the Unknown, Lisbon, Portugal, 2Center of Functionally Integrative Neuroscience (CFIN) and MINDLab, Clinical Institute, Aarhus University, Aarhus, Denmark, 3Department of Physics and Astronomy, Aarhus University, Aarhus, Denmark
Synopsis
Several microstructural models have been proposed to increase the specificity of diffusion MRI. However, improper model assumptions can compromise the accuracy of model estimates. Here, we compared model-independent metrics extracted from double diffusion encoding (DDE) with the metrics arising from the current (two-compartment) diffusion “standard model” (SM) in in-vivo rat brains. Our results revealed that SM produces overestimated microscopic anisotropy for both white and grey matter. These findings question the validity of SM and calls for future developments of more accurate models.
Introduction
Diffusion MRI (dMRI) is sensitive to microstructural tissue properties that are much smaller than the MRI voxel size1. Several microstructural models have been proposed to increase the specificity of single-diffusion encoding (SDE) acquisitions2-4; however, while these can produce very appealing maps, improper model assumptions and constraints can compromise the accuracy of model estimates4-5. Fortunately, advanced diffusion MRI pulse sequences can be independently employed to extract specific measures decoupled from detrimental mesoscopic effects such as orientation dispersion5-11, thereby independently mapping selected microstructural features. In turn, these can be used to validate microstructural models12-14. For instance, Double Diffusion Encoding (DDE) very recently revealed that constrained two-component SM model fitting produces misestimation of microscopic fractional anisotropy (μFA) ex-vivo14. A fair criticism to this study suggests that perhaps fixation plays a crucial role in those findings. Here, we assess the validity of the more general two-compartment SM2,4 in living rats.Theory
DDE μFA measures: At long mixing time, the microscopic anisotropy $$$\left \langle V_\lambda{(\mathbf{D}_i))} \right \rangle$$$ can be estimated from “powder”-averaged DDE signals acquired for parallel and perpendicular pairs of diffusion encoding gradients ($$$S_\parallel$$$ and $$$S_\perp$$$):$$\log{S_\parallel/S_\perp}=\frac{3}{5}\left \langle V_\lambda{(\mathbf{D}_i))} \right \rangle b^2+O(b^3)\,\,\,(1)$$where $$$b$$$ is the total b-value in the two diffusion encodings. $$$\left \langle V_\lambda{(\mathbf{D}_i))} \right \rangle$$$ can be then used to compute8-10 from: $$\mu FA=\sqrt{\frac{3}{2}\frac{\left \langle V_\lambda{(\mathbf{D}_i))} \right \rangle}{\left \langle V_\lambda{(\mathbf{D}_i))} \right \rangle+MD^2}}\,\,\,\,\,(2)$$where $$$MD$$$ is the mean diffusivity.
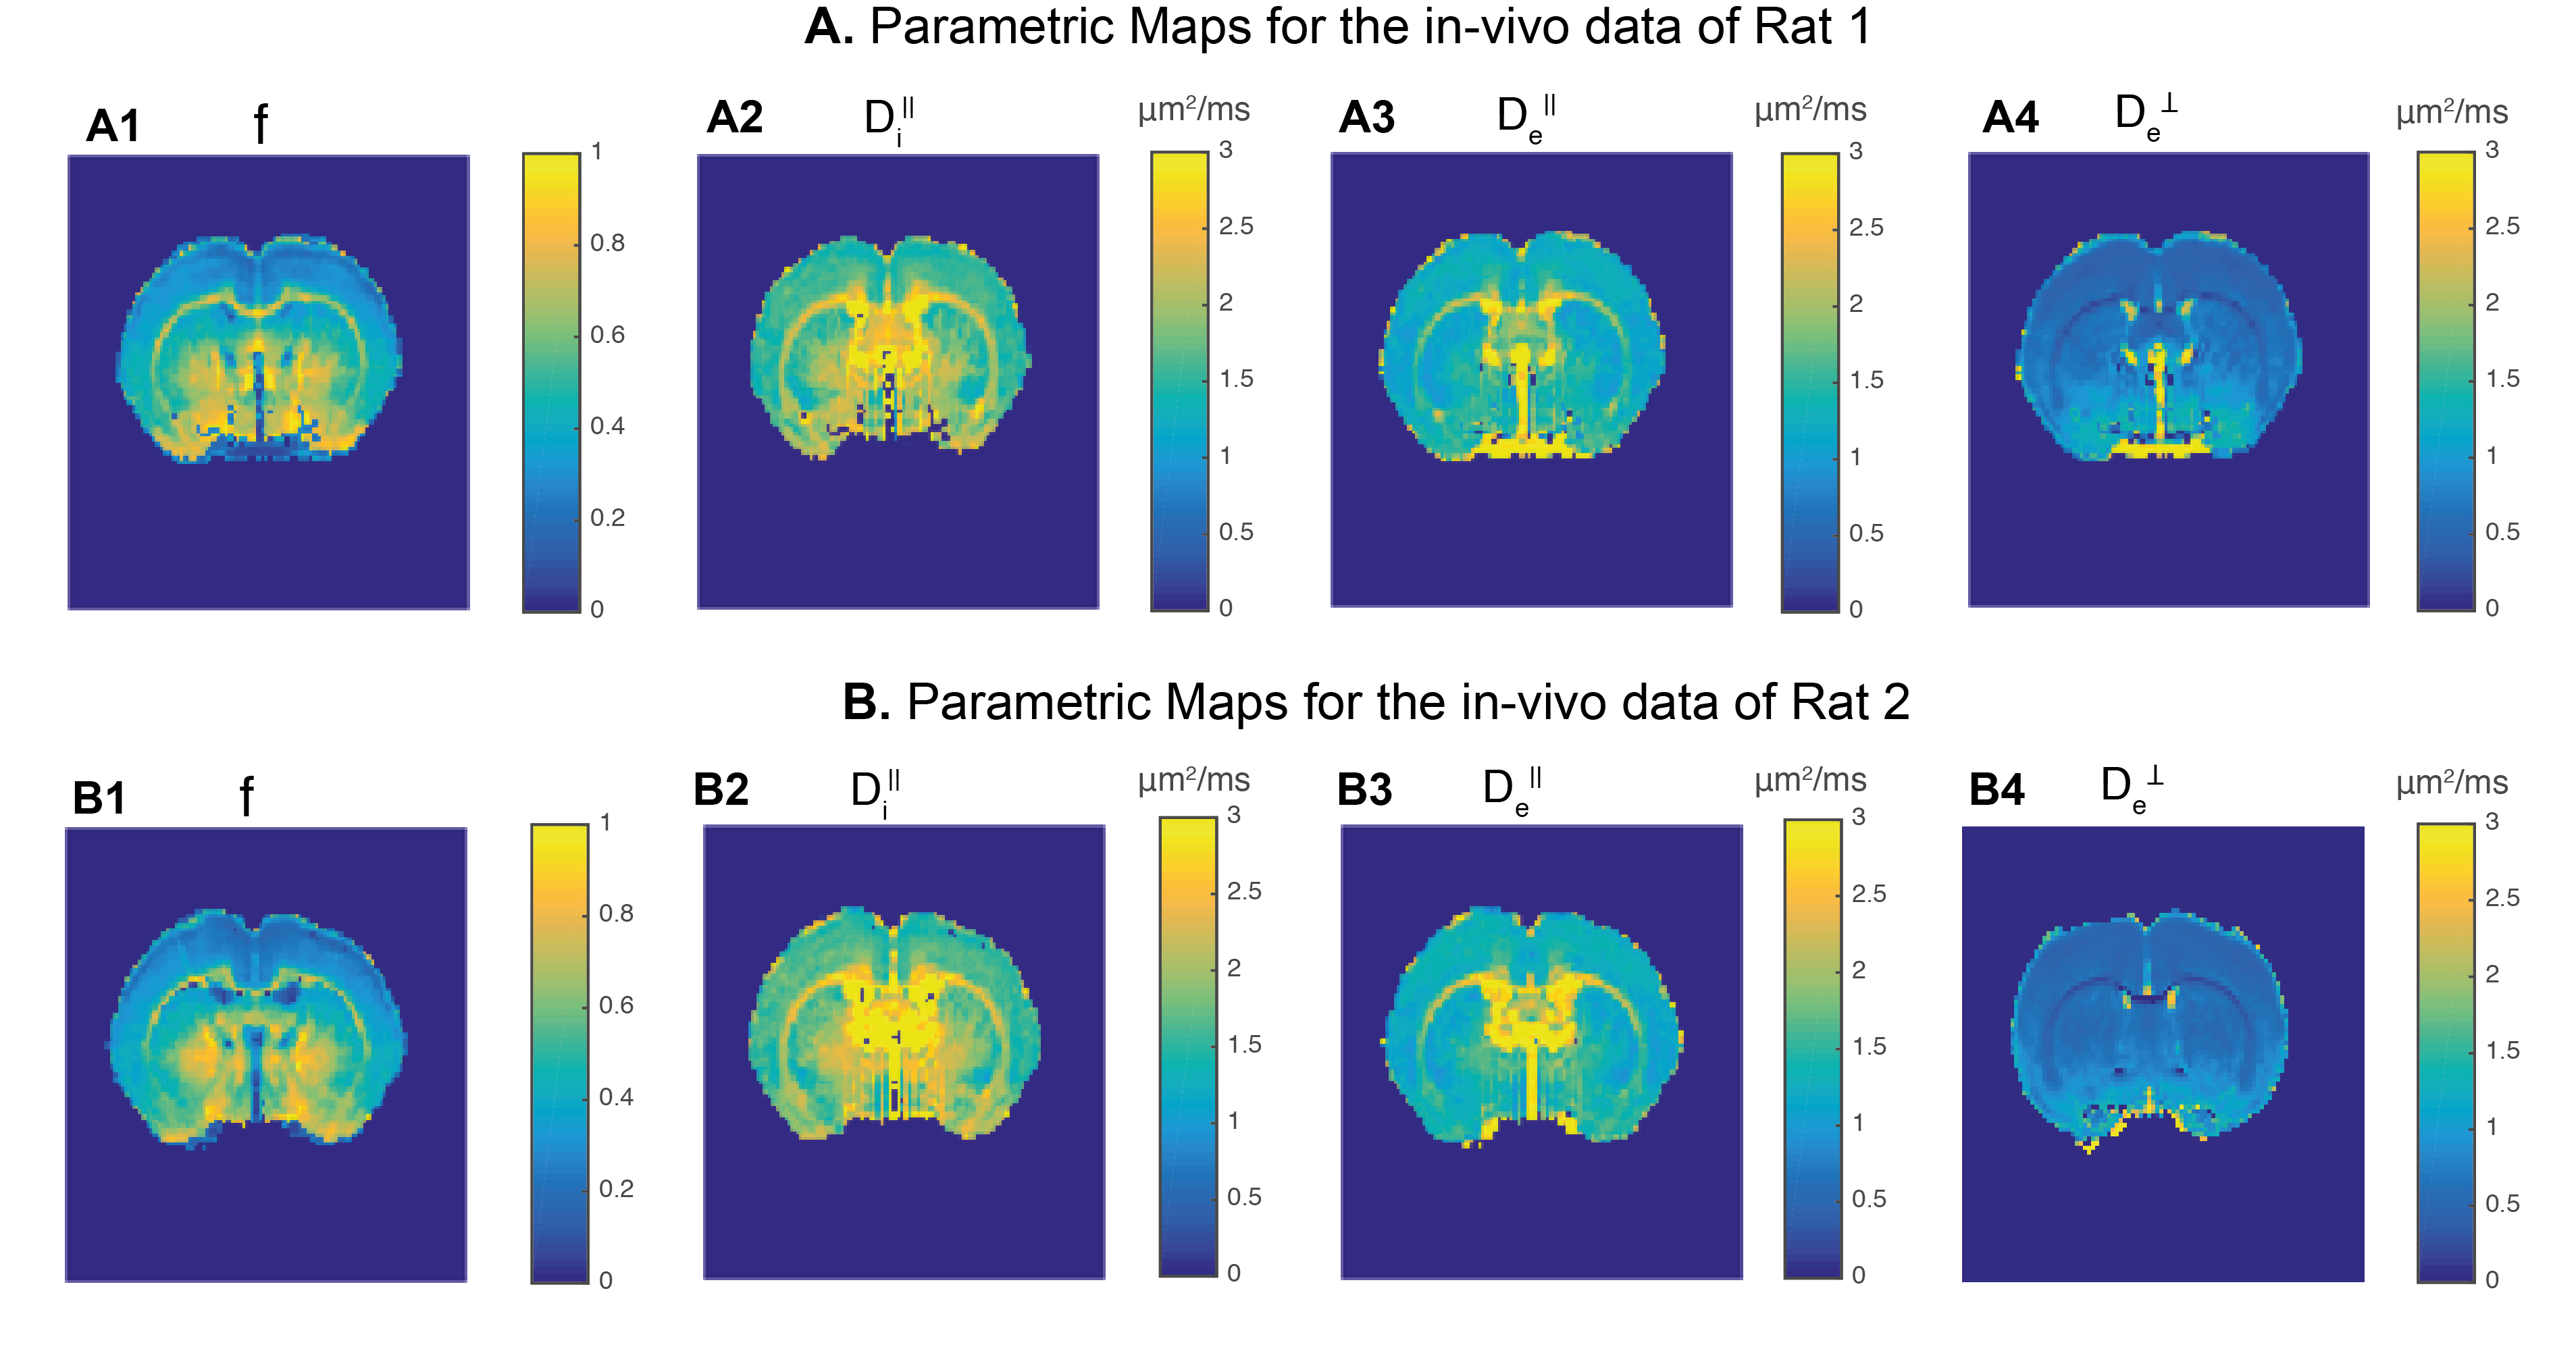
Two-compartment “standard” model: The two-component SM consists of two Gaussian diffusion components2,4: $$S_{SM}(b,\hat{n})=\int d\hat{r}ODF(\hat{r})K(b,\hat{n}\cdot\hat{r})\;\;\;\;\left(3\right)$$ and$$K\left(b,\xi\right)=fe^{-bD_i^\parallel\xi^2}+(1-f)e^{-bD_i^\parallel -b\left(D_e^\parallel D_e^\perp\right)\xi^2}\,\,\,\,\,(4)$$where $$$ODF$$$ is the fiber orientation distribution function (here represented up to the sixth order in spherical decomposition), $$$K$$$ is a kernel containing the following rotationally invariant parameters: 1) the intra-axonal volume fraction $$$f$$$; 2) the axial intra-cellular diffusivity $$$D_i^\parallel$$$; 3) the axial extra-cellular diffusivity $$$D_e^\parallel$$$; and 4) the axial intra-cellular diffusivity $$$D_i^\perp$$$ (intra-cellular radial diffusivity is set to 0, according to the narrow diameter assumption). After estimating all parameters from Eqs. 3-4, can be derived from SM (μ$$$FA^{SM}$$$) using Eq.2.
Methods
All animal experiments were pre-approved by the ethics committee operating under EU law (European Directive 2010/63). Data was acquired on N=2 female Long Evans Rats (11 weeks) on a 9.4 T Bruker Biospec MRI scanner equipped with an 86 mm quadrature coil for transmission and 4-element array cryocoil for reception.
SDE: Data were acquired along 60 gradient directions for nine evenly sampled b-values from 0 to 9 ms/μm2 (Δ/δ=15/5ms).
DDE: Data were acquired for five b-values (1, 1.5, 2, 3, and 4 ms/μm2, Δ=τ/δ=15/5ms). For each DDE b-value, directions are sampled according to the 5-design (12 parallel + orthogonal DDE acquisitions)10. Additionally, the number of DDE parallel acquisitions was increased by acquiring 45 parallel pairs of diffusion-gradient directions. Other acquisition parameters were as following: TR/TE=1500/65ms, 4 coronal slices, resolution=0.1×0.1×0.8mm, #averages=2.
Data processing: Both SDE and DDE data underwent the same preprocessing steps: 1)Marchenko-Pastur-PCA denoising (10x10 window)15, 2)sub-pixel image registration for data alignment16; 3)Gibbs-artefact suppresion17. SM parameters were fitted from Eqs 3-4 using a non-linear procedure which was repeated for different starting points. The lowest sum of residuals was used to select the final set of parameters, which were then and converted to μFA (Eq.2). μFA estimates from DDE are extracted from Eqs.1-2 (considering the higher order term correction11).
Results
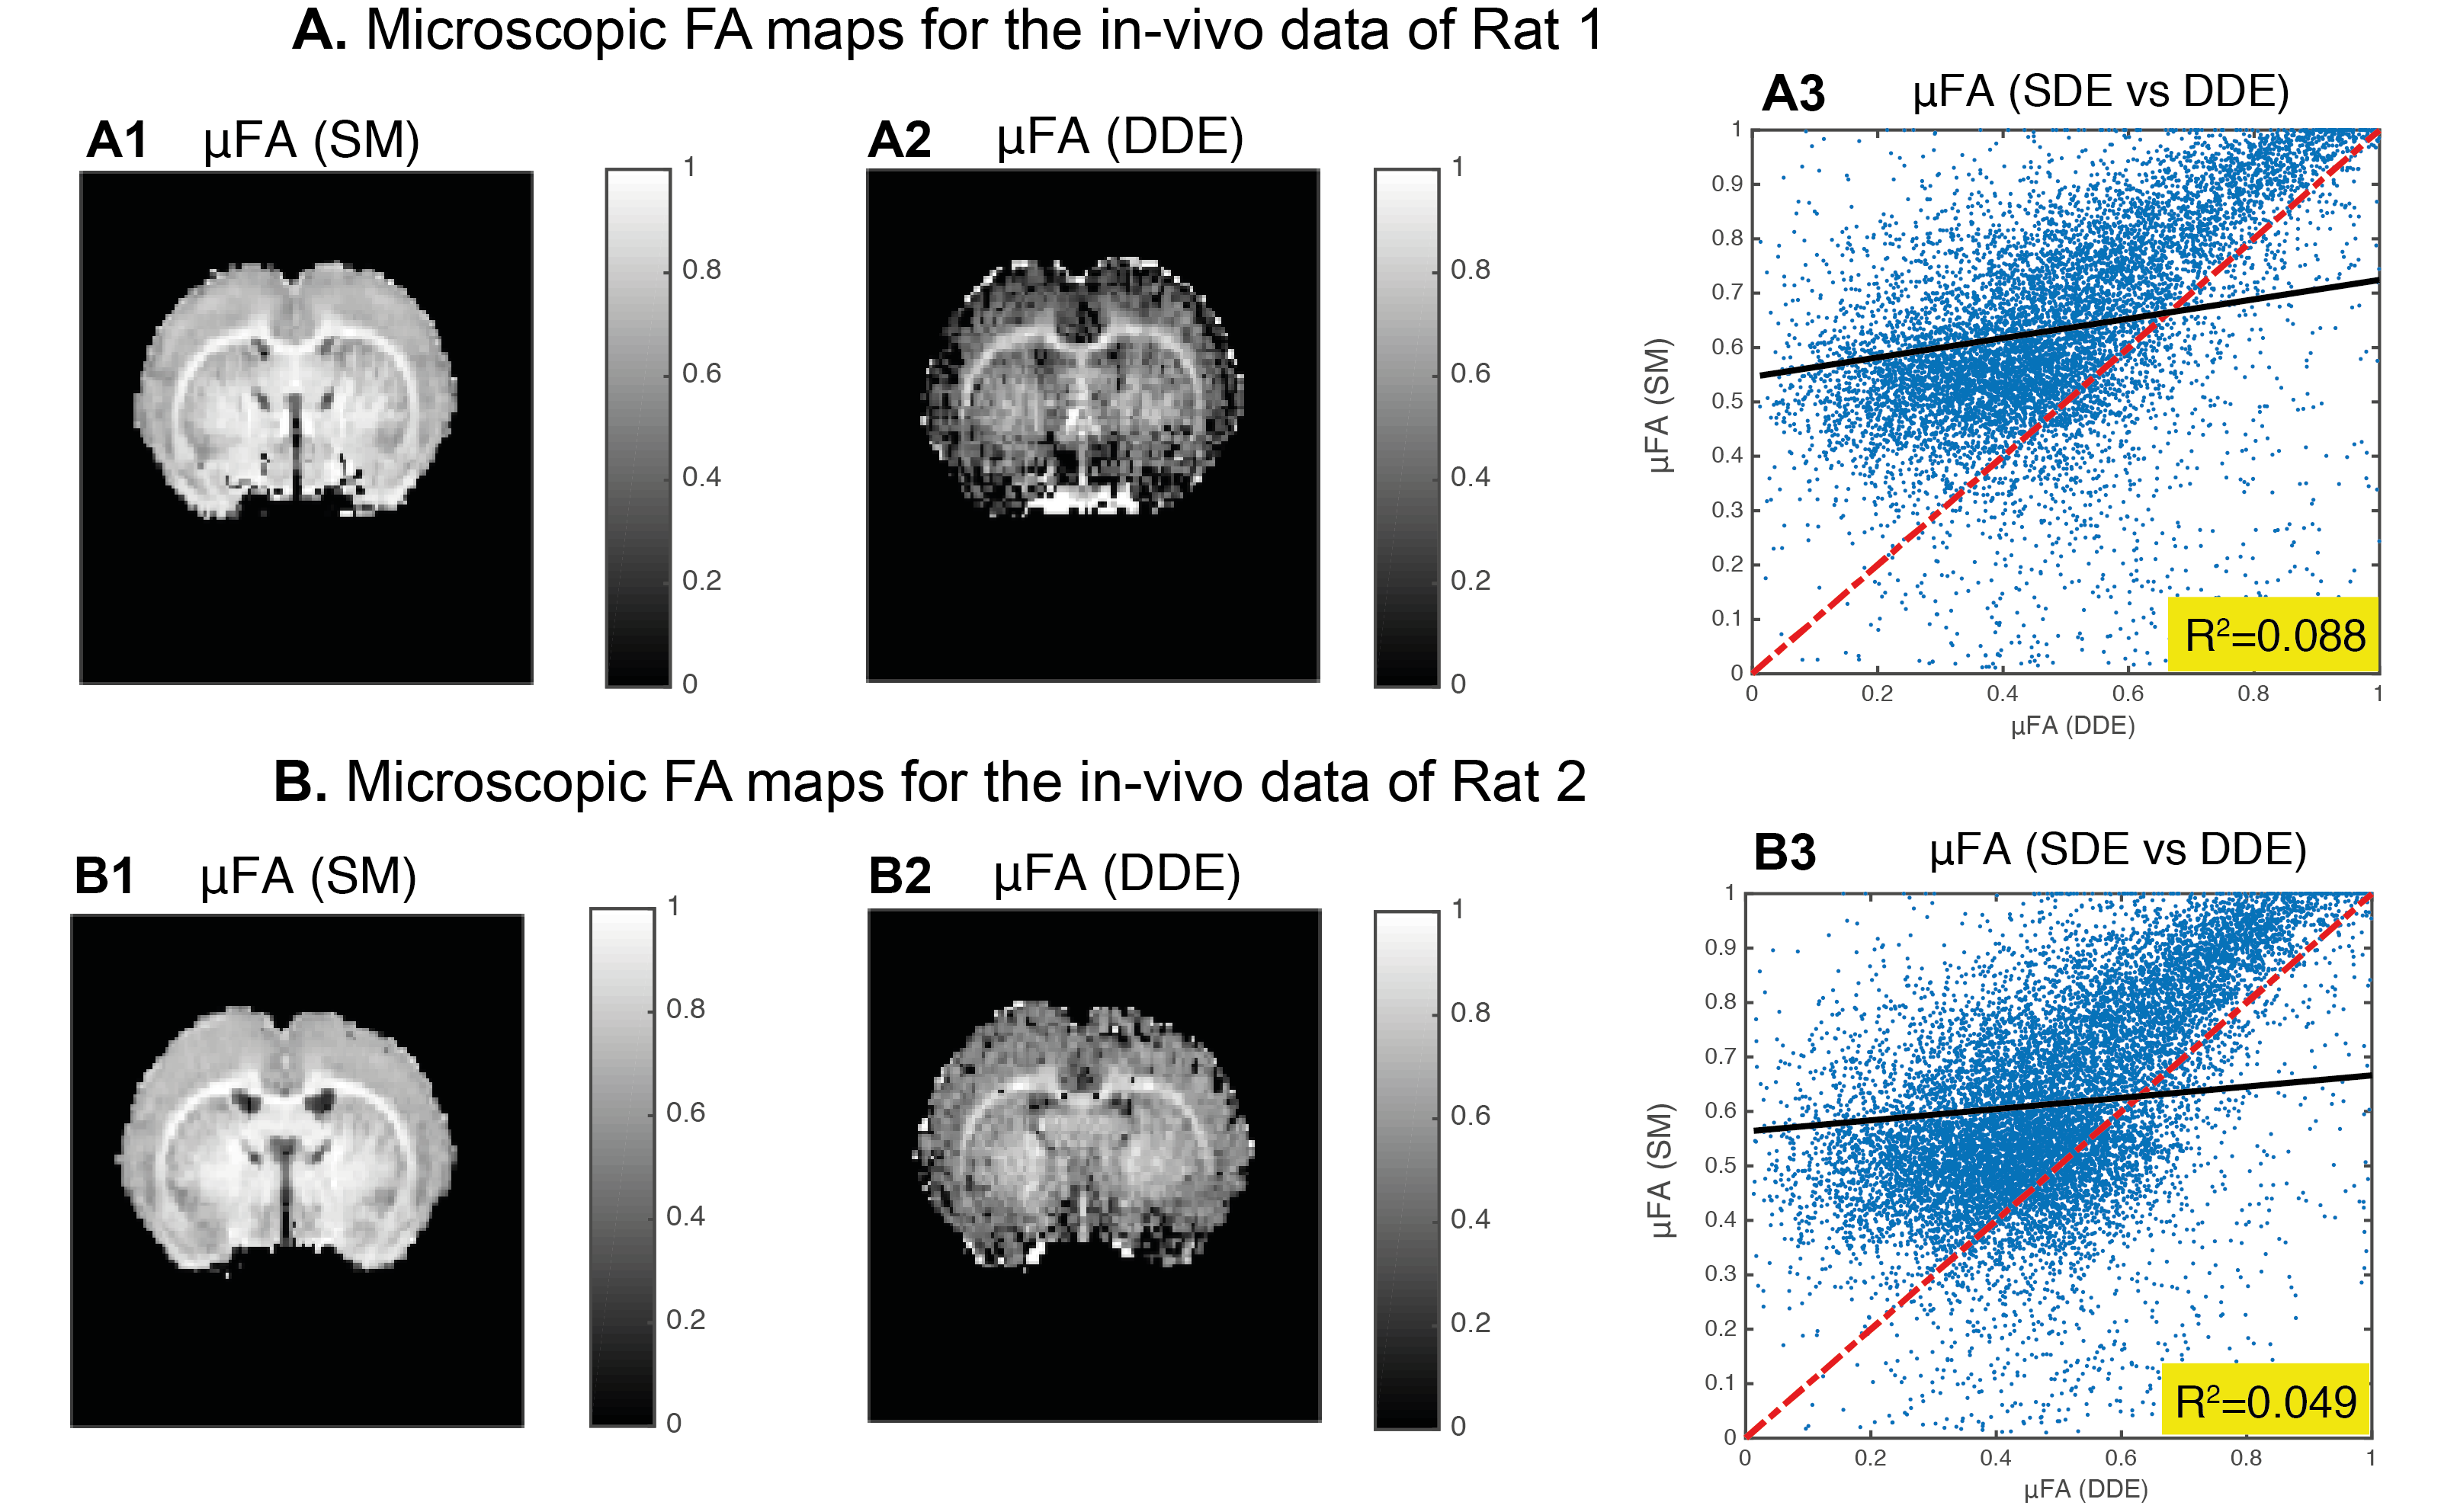
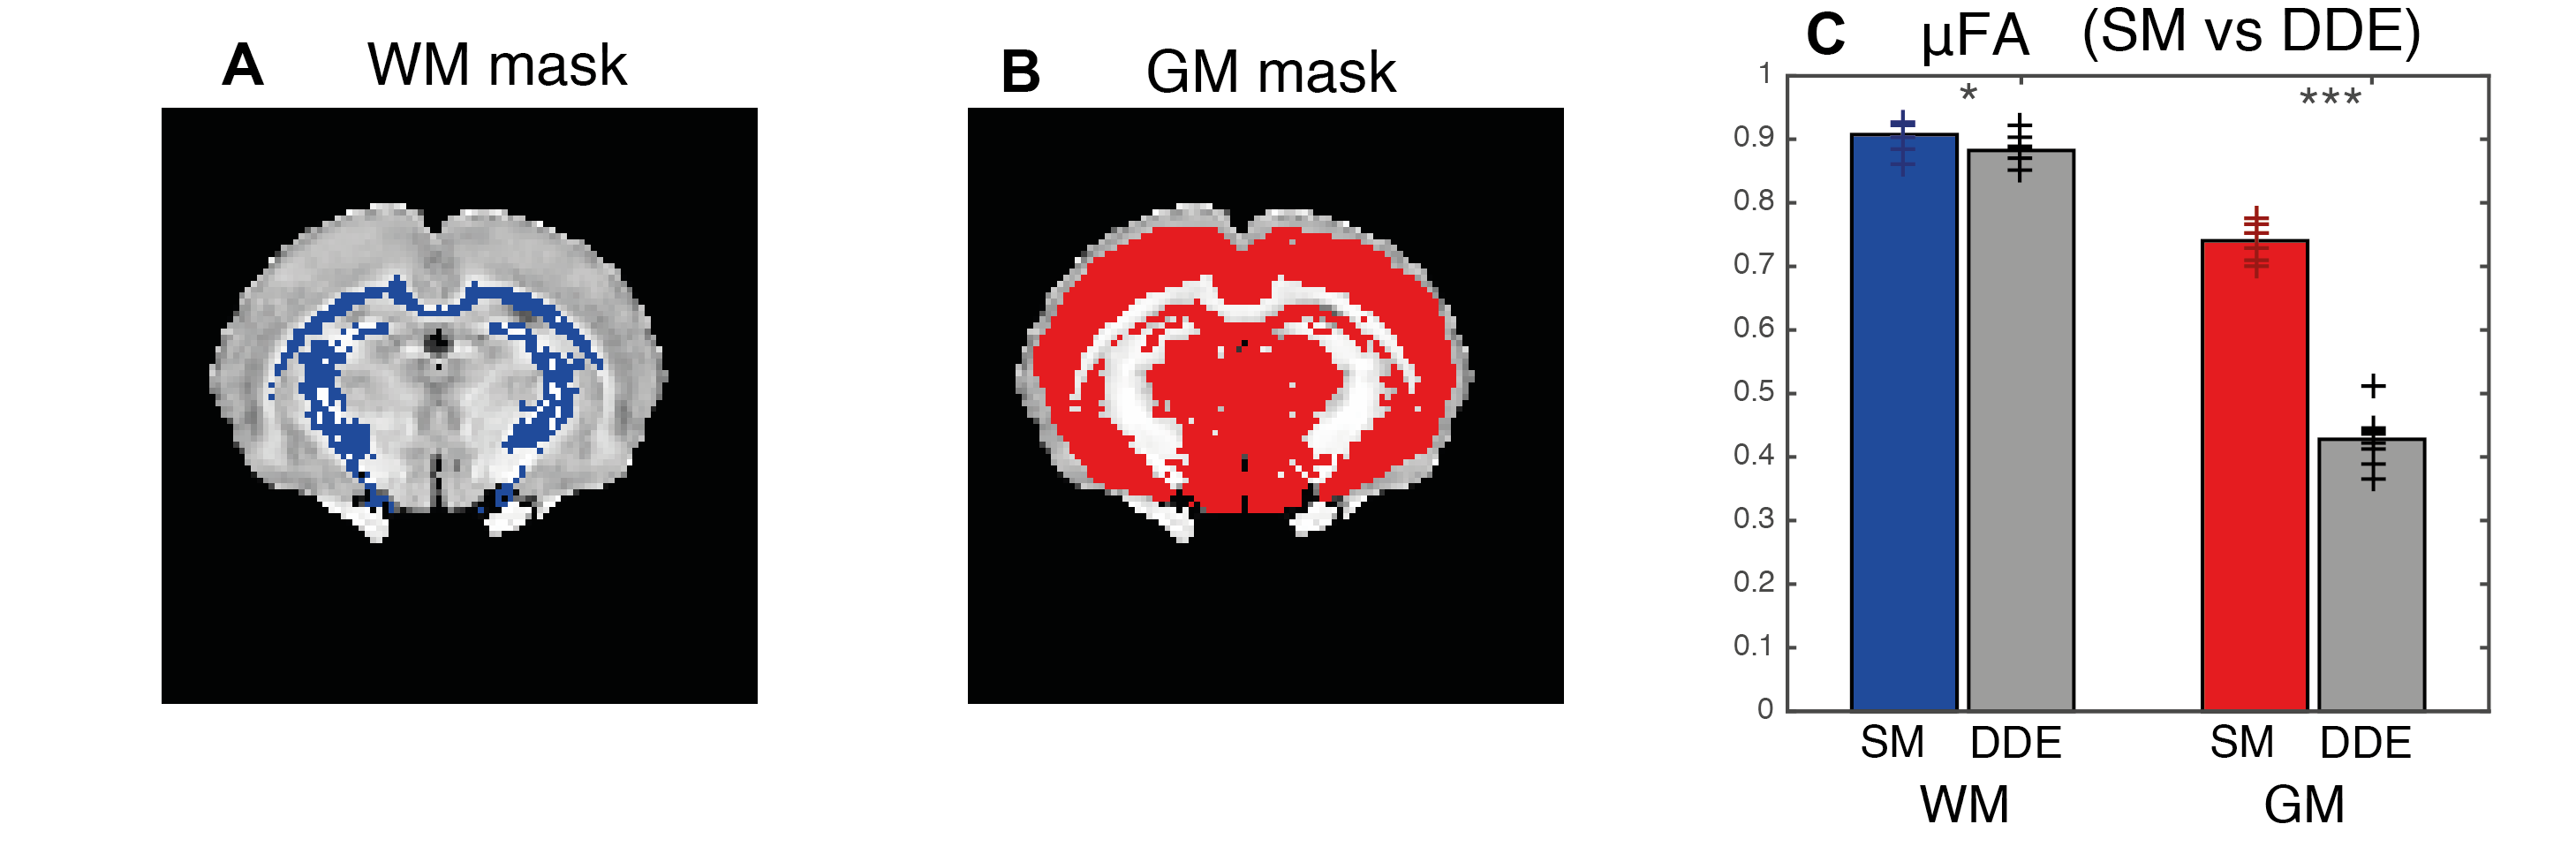
Before pre-processing the SNR of the b=0 images was estimated to be ~40 for both DDE and SDE data. For a representative slice, Fig. 1 presents SM parameter estimates for both rats. µ$$$FA^{SM}$$$ is compared to its DDE counterparts in Fig. 2. To assess the estimates in higher SNR regimes (decreasing noise cofounds), Fig. 3 shows averaged μFA for white and grey-matter ROIs of individual slices. Averaged µ$$$FA^{SM}$$$ estimates were significantly higher than their DDE counterparts (for white and grey-matter p-values =1.8e-2 and 2.5e-6, pairwise t-test).
Discussion
The 2-component SM has been quite extensively employed, but its underpinnings were not thoroughly validated. Comparisons of SM metrics against their counterparts derived using model-free methods such as DDE has previously been presented for ex-vivo data14, suggesting that SM is incomplete. Here, we extended the analysis to in-vivo experiments not confined to powder-averaged (L=0) SM fitting, and found that µ$$$FA^{SM}$$$ was overestimated, in agreement with the previous ex-vivo studies14. The DDE acquisitions assume that experiments are in the long mixing time regime, which was indeed observed here independently (data not shown). Therefore, ignoring exchange, DDE can serve as a ground truth. Our results do not point out the “culprit” for the differences between DDE and SM; still, our findings call for more advanced biophysical modelling.Conclusion
DDE-based measurements revealed that the “standard” two-compartments model overestimates . Since µFA is produced model-free using DDE, better models need to be derived to describe diffusion in the brain.Acknowledgements
This study was funded by the European Research Council (ERC) (agreement No. 679058).References
1. Le Bihan D, Johansen-Berg H. Diffusion MRI at 25: Exploring brain tissue structure and function. Neuroimage 2012; 61: 324-341. doi: 10.1016/j.neuroimage.2011.11.006.
2. Jespersen SN, Kroenke CD, Østergaard L, et al. Modeling dendrite density from magnetic resonance diffusion measurements. Neuroimage 2007; 34: 1473–1486. doi:10.1016/j.neuroimage.2006.10.037.
3. Nilsson M, van Westen D, Ståhlberg F, et al. The role of tissue microstructure and water exchange in biophysical modeling of diffusion in white matter. MAGMA 2013; 26(4): 345-70. doi: 10.1007/s10334-013-0371-x.
4. Novikov DS, Kiselev VG, Jespersen SN. On modeling. Magn. Reson. Med. 2018; 79(6):3172-3193. doi: 10.1002/mrm.27101.
5. Novikov DS, Veraart J, Jelescu IO, Fieremans E. Rotationally-invariant mapping of scalar and orientational metrics of neuronal microstructure with diffusion MRI. Neuroimge 2018; 174: 518-538. doi: 10.1016/j.neuroimage.2018.03.006
6. Mitra PP. Multiple wave-vector extensions of the NMR pulsed-field-gradient spin-echo diffusion measurement. Phys Rev B Condens Matter 1995; 51(21): 15074-15078.
7. Lasič S, Szczepankiewicz F, Eriksson S, et al. Microanisotropy imaging: quantification of microscopic diffusion anisotropy and orientational order parameter by diffusion MRI with magic-angle spinning of the q-vector. Front. Phys. 2014; 2: doi: 10.3389/fphy.2014.00011
8. Szczepankiewicz F, Lasič S, van Westen D, et al. Quantification of microscopic diffusion anisotropy disentangles effects of orientation dispersion from microstructure: applications in healthy volunteers and in brain tumors. Neuroimage 2015; 104: 241-252. doi: 10.1016/j.neuroimage.2014.09.057.
9. Westin CF, Knutsson H, Pasternak O, et al. Q-space trajectory imaging for multidimensional diffusion MRI of the human brain. Neuroimage 2016; 135: 345-362.
10. Jespersen SN, Lundell H, Sønderby CK, Dyrby TB. Orientationally invariant metrics of apparent compartment eccentricity from double pulsed field gradient diffusion experiments. NMR Biomed. 2013; 26(12):1647-62. doi: 10.1002/nbm.2999.
11. Ianuş A, Jespersen SN, Duarte TS, et al. Accurate estimation of microscopic diffusion anisotropy and its time dependence in the mouse brain. NeuroImage 2018; 183, 934-949. doi: 10.1016/j.neuroimage.2018.08.034
12 Lampinen B, Szczepankiewicz F, Mårtensson, J et al. Neurite density imaging versus imaging of microscopic anisotropy in diffusion MRI: A model comparison using spherical tensor encoding. Neuroimage 2017; 147: 517-531. doi: 10.1016/j.neuroimage.2016.11.053.
13. Henriques RN, Shemesh N. Validity Regimes of the Spherical Mean Technique. Proceeding of the Joint annual meeting ISMRM-ESMRMB 2018; 0892.
14. Henriques RN, Jespersen SN, Shemesh N. Microscopic anisotropy misestimation in spherical-mean Single Diffusion Encoding MRI. Magn. Reson. Med. (in preparation) doi: 10.1002/mrm.27606
15. Veraart J, Novikov DS, Christiaens D, Ades-Aron B, Sijbers J, Fieremans E. Denoising of diffusion MRI using random matrix theory. Neuroimage 2016; 146: 394-406. doi: 0.1016/j.neuroimage.2016.08.016.
16. Gulzar-Sicairos M, Thurman ST, Fienup JR. 2008. Efficient subpixel image registration algorithms. Opt Lett. 15; 33(2):156-8. doi:10.1364/OL.33.000156.
17. Kellner E, Dhital B, Kiselev VG, Reisert M. Gibbs-ringing artefact removal based on local subvoxel-shifts. Magn. Reson. Med. 2016; 76(5): 1574-1581. doi: 10.1002/mrm.26054
Figures