0654
CHENONCEAU: towards a novel mesoscopic (100/200µm) post mortem human brain MRI atlas at 11.7T1UNIRS, CEA/DRF/Neurospin, Gif-sur-Yvette, France, 2Université Paris Saclay, Orsay, France, 3FLI/Noeud Paris-Sud, Orsay, France, 4UNATI, CEA/DRF/Neurospin, Gif-sur-Yvette, France, 5http://cati-neuroimaging.com/, Gif-sur-Yvette, France, 6INSERM UMR 1253 iBrain, Université de Tours, Tours, France
Synopsis
Ultra-high field MRI combined with strong gradients gives access to ex-vivo anatomical and diffusion MRI datasets at the mesoscopic scale. This
Introduction
Actual human brain atlases rely either on optical microscopy at a microscopic scale[1, 2, 3, 4], or on in-vivo MRI at a millimeter scale[5, 6]. The development of ultra-high field MRI (UHF-MRI) motivates the creation of novel ex-vivo atlases targetting a few hundreds micrometers (100-200µm). Reaching this mesoscopic scale using diffusion UHF-MRI is not achievable in-vivo on clinical systems[7] due to limited gradient strengths, which is not the case with UHF preclinical systems, equipped with ten-fold stronger gradients. The purpose of this work is to create a unique mesoscopic MRI atlas of the human left hemisphere, including anatomical and diffusion-weighted images at 100µm and 200µm respectively, to explore its structure, connectivity and microstructure using suitable advanced biophysical models.Material and methods
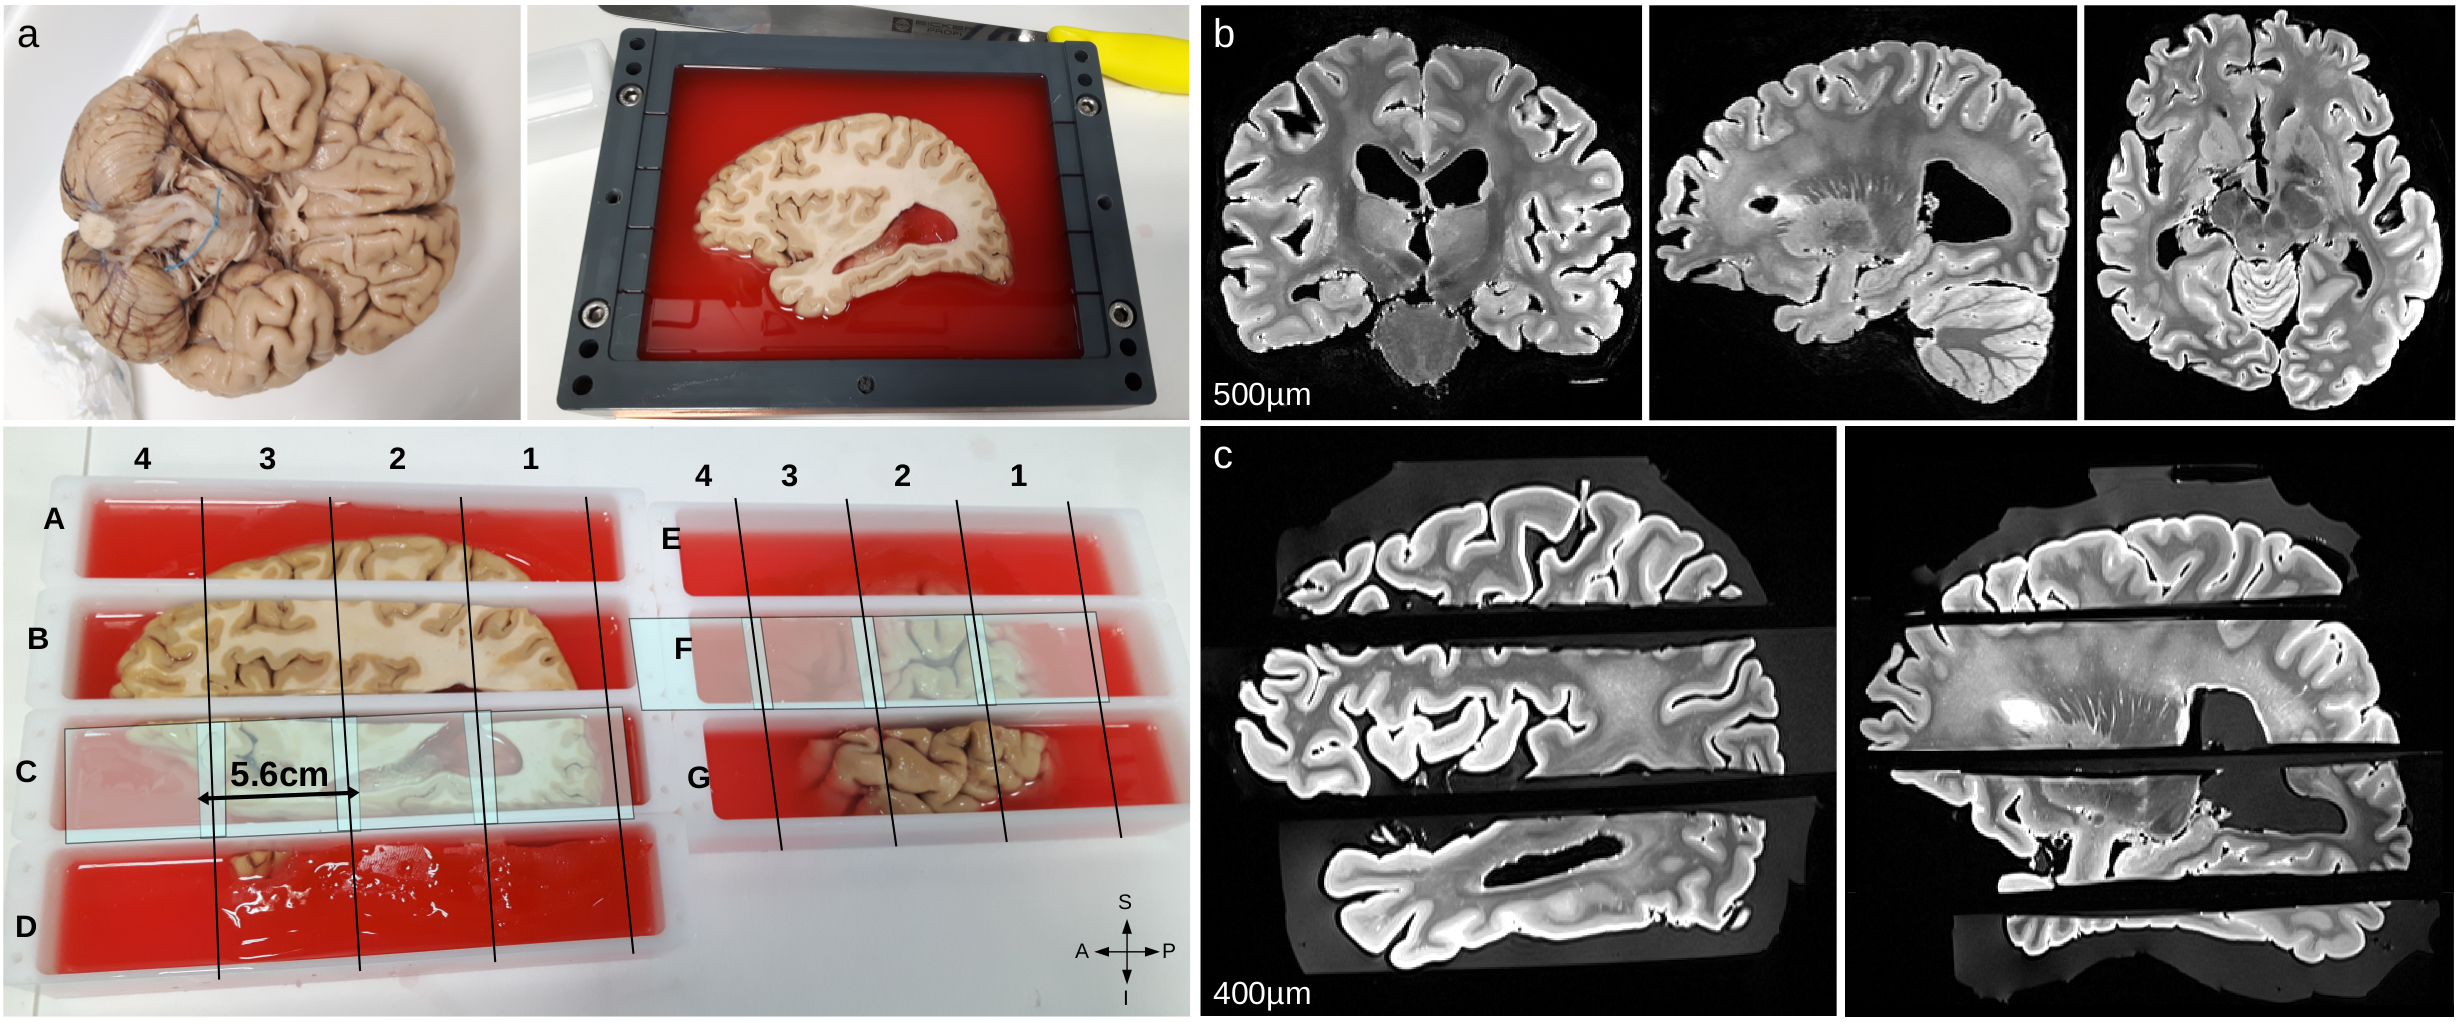
Acquisition- The two hemispheres of a formalin-fixed post-mortem human brain sample were cut into seven blocks. The entire specimen was scanned before and after cutting on a 3T clinical system using T2-SPACE sequences with an isotropic resolution of 500µm (Fig1.b) and 400µm (Fig1.c) respectively, providing two blockface images facilitating the final registration. The 11.7T acquisition protocol included T2-weighted anatomical scans with the following parameters: isotropic resolution=100/150µm, TE=20/16ms, TR=500/6600ms, and diffusion-weighted (DW) 3D-segmented EPI sequences: 200µm isotropic, TE/TR=24.3/250ms, δ/Δ=5/12.3ms, b=1500/4500/8000s/mm2, 25/60/90directions, G=289/500/666mT/m, 30segments. This protocol was designed to scan each block (20cm long) into four sessions (107h each) for a total scan duration of 2996h per hemisphere.
Preprocessing- DW images were filtered using a non-local means filter algorithm[8], resulting in a final SNR of 125, 81 and 69 respectively for b=1500/4500/8000s/mm2.
Reconstruction of the left hemisphere- Affine transformations were used to register each block on the entire blockface image acquired at 3T, which facilitated the initialization for the diffeomorphic registration of individual FOV acquired at 11.7T. A dedicated pipeline was developed to match and integrate all the FOV acquired at 11.7T into two 100/150µm anatomical datasets (42/12GBytes) and one 200µm HYDI dataset (891GBytes) corresponding to the entire left hemisphere.
Connectivity- The HYDI dataset was used to compute Probability Density Functions (PDF) stemming from MAP-MRI model[9] as well as their inherited Orientation Distribution Functions. Conventional quantitative maps stemming from the tensor model (FA, MD, CED maps) were also reconstructed. To explore the structural connectivity, a global spin-glass fiber tracking algorithm[10] was used with the following parameters: 1 spin glass per voxel, connection likelihood 0.5, curvature threshold 30°, internal energy weight 30, allowing to reconstruct a dense connectogram.
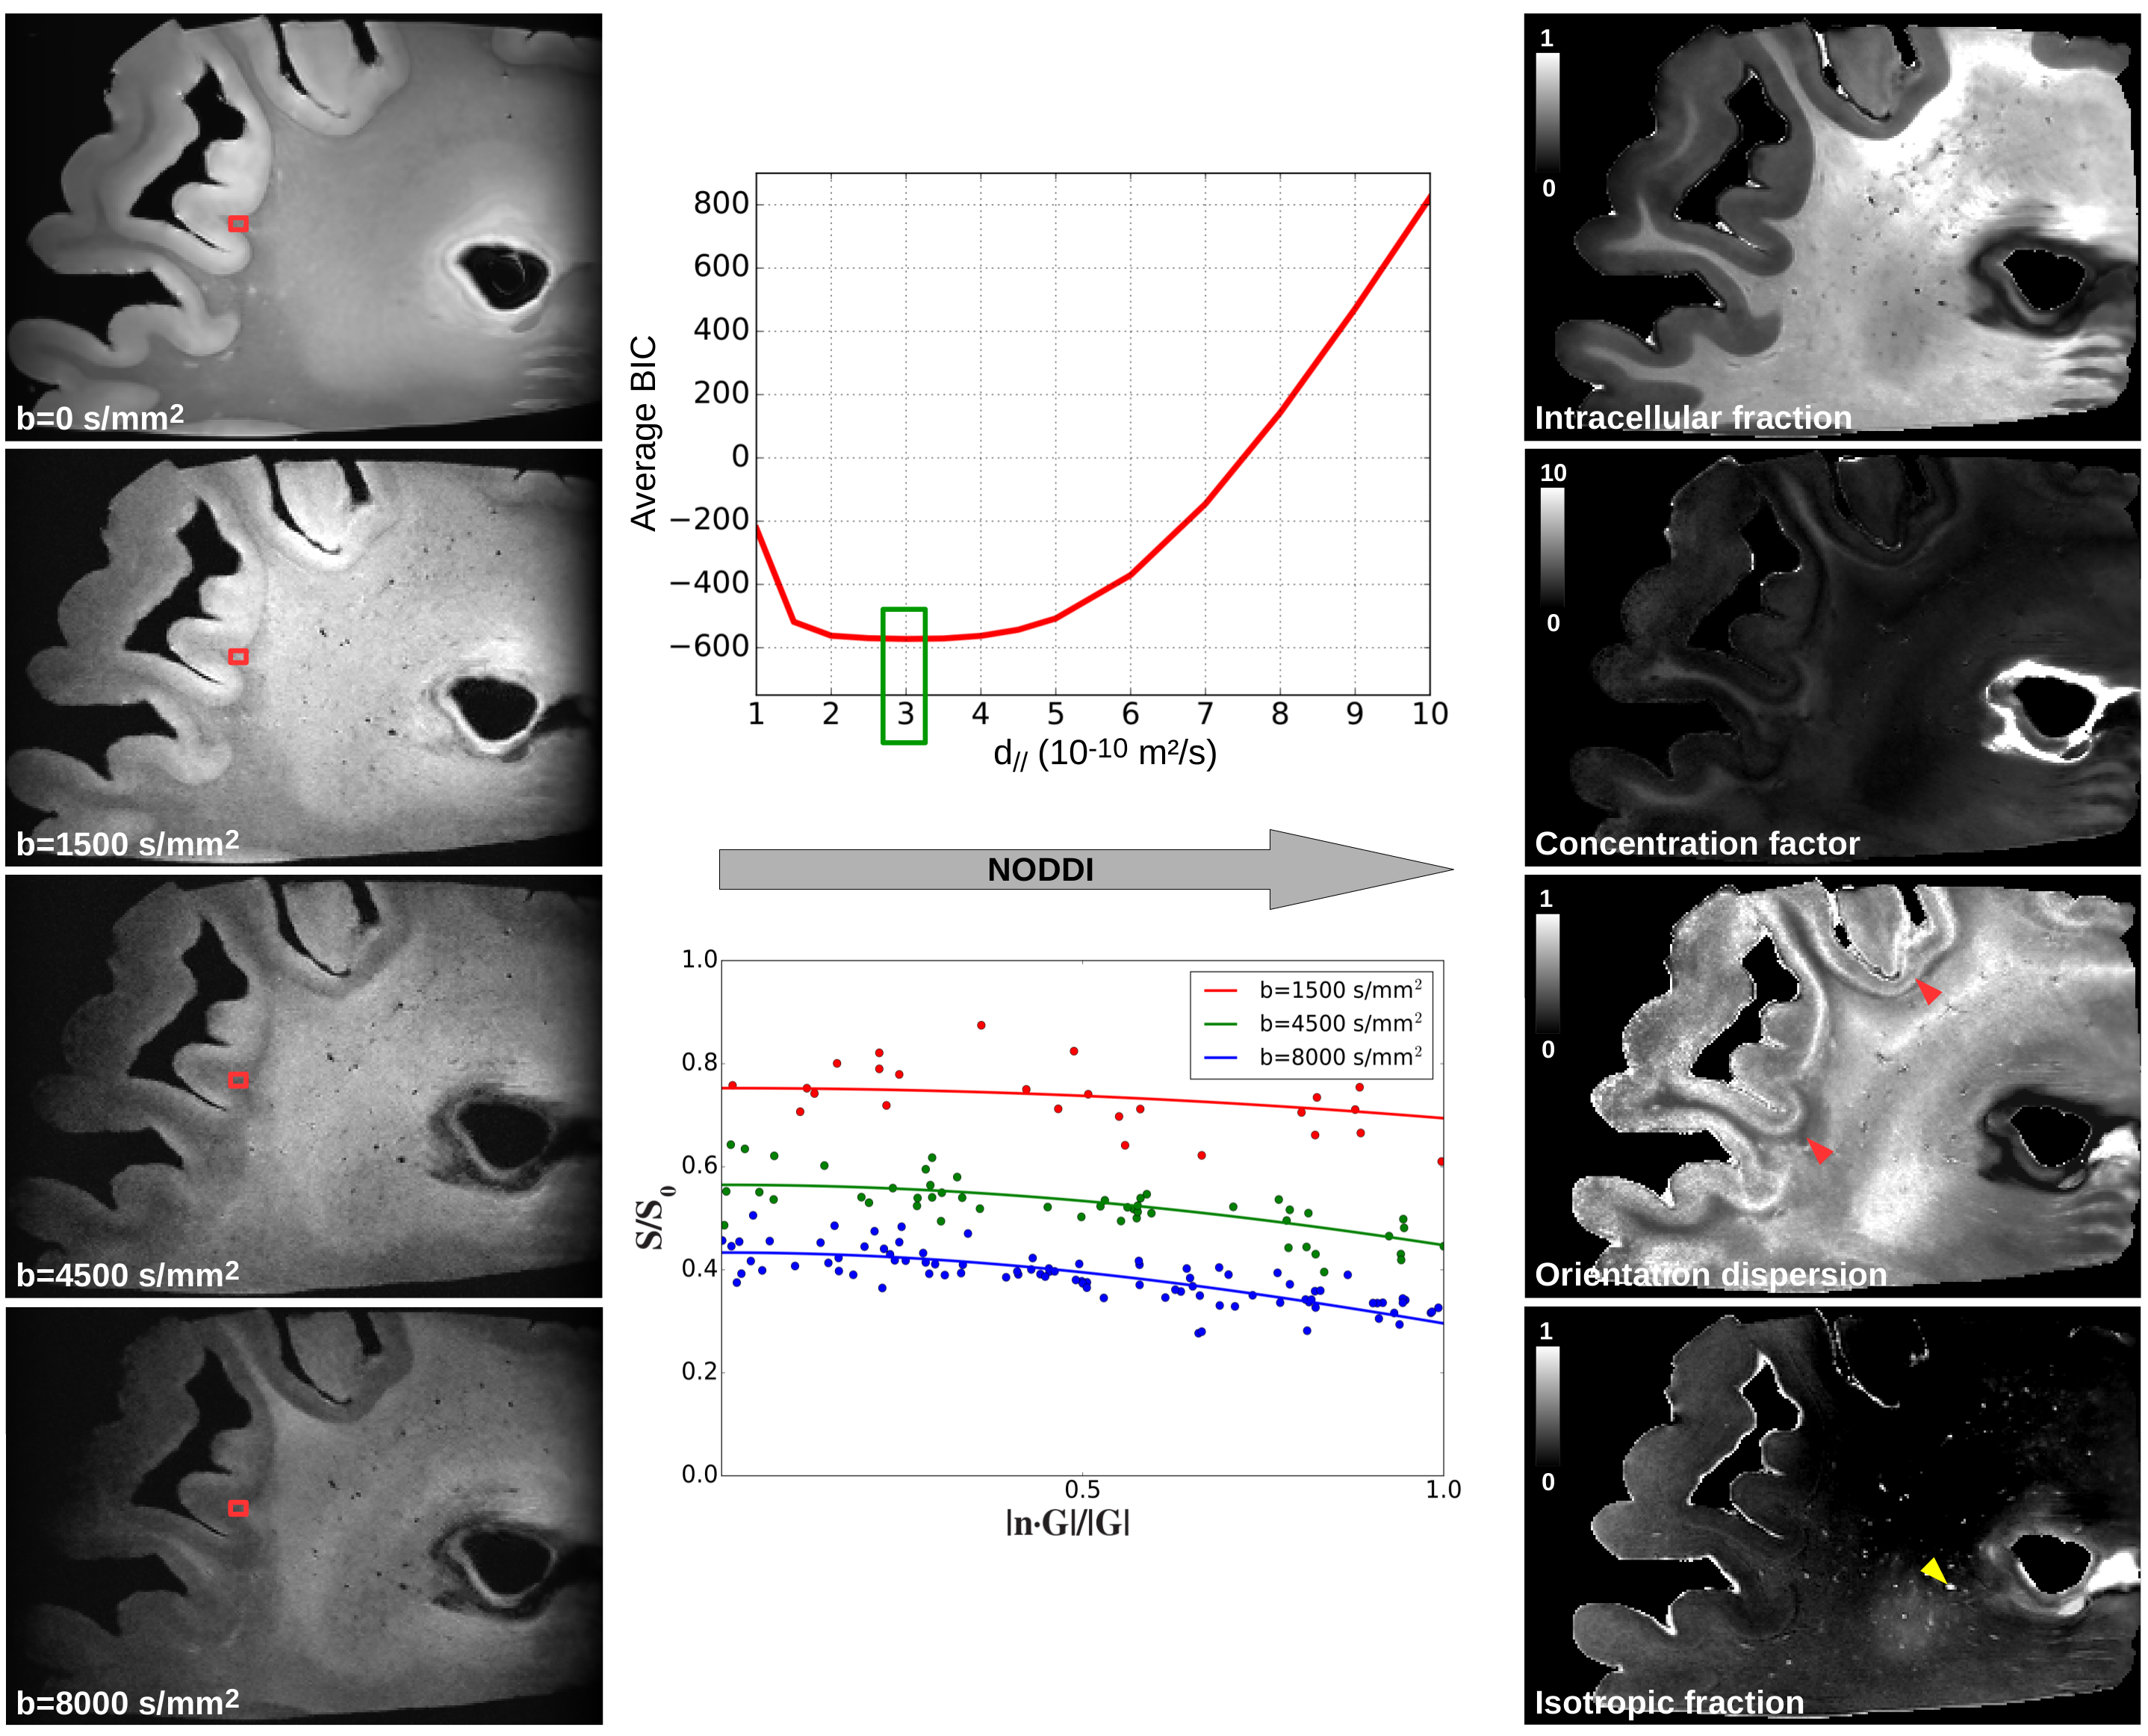
Microstructure mapping- The HYDI dataset was used to infer NODDI[11] quantitative maps, fixing the local principal direction estimated from the jointly estimated DTI model and the diffusivities to d//=3.10-10m2/s (value giving the lowest Bayesian Information Criterion, Fig.5) and diso=2.10-9m2/s.
Results and discussion
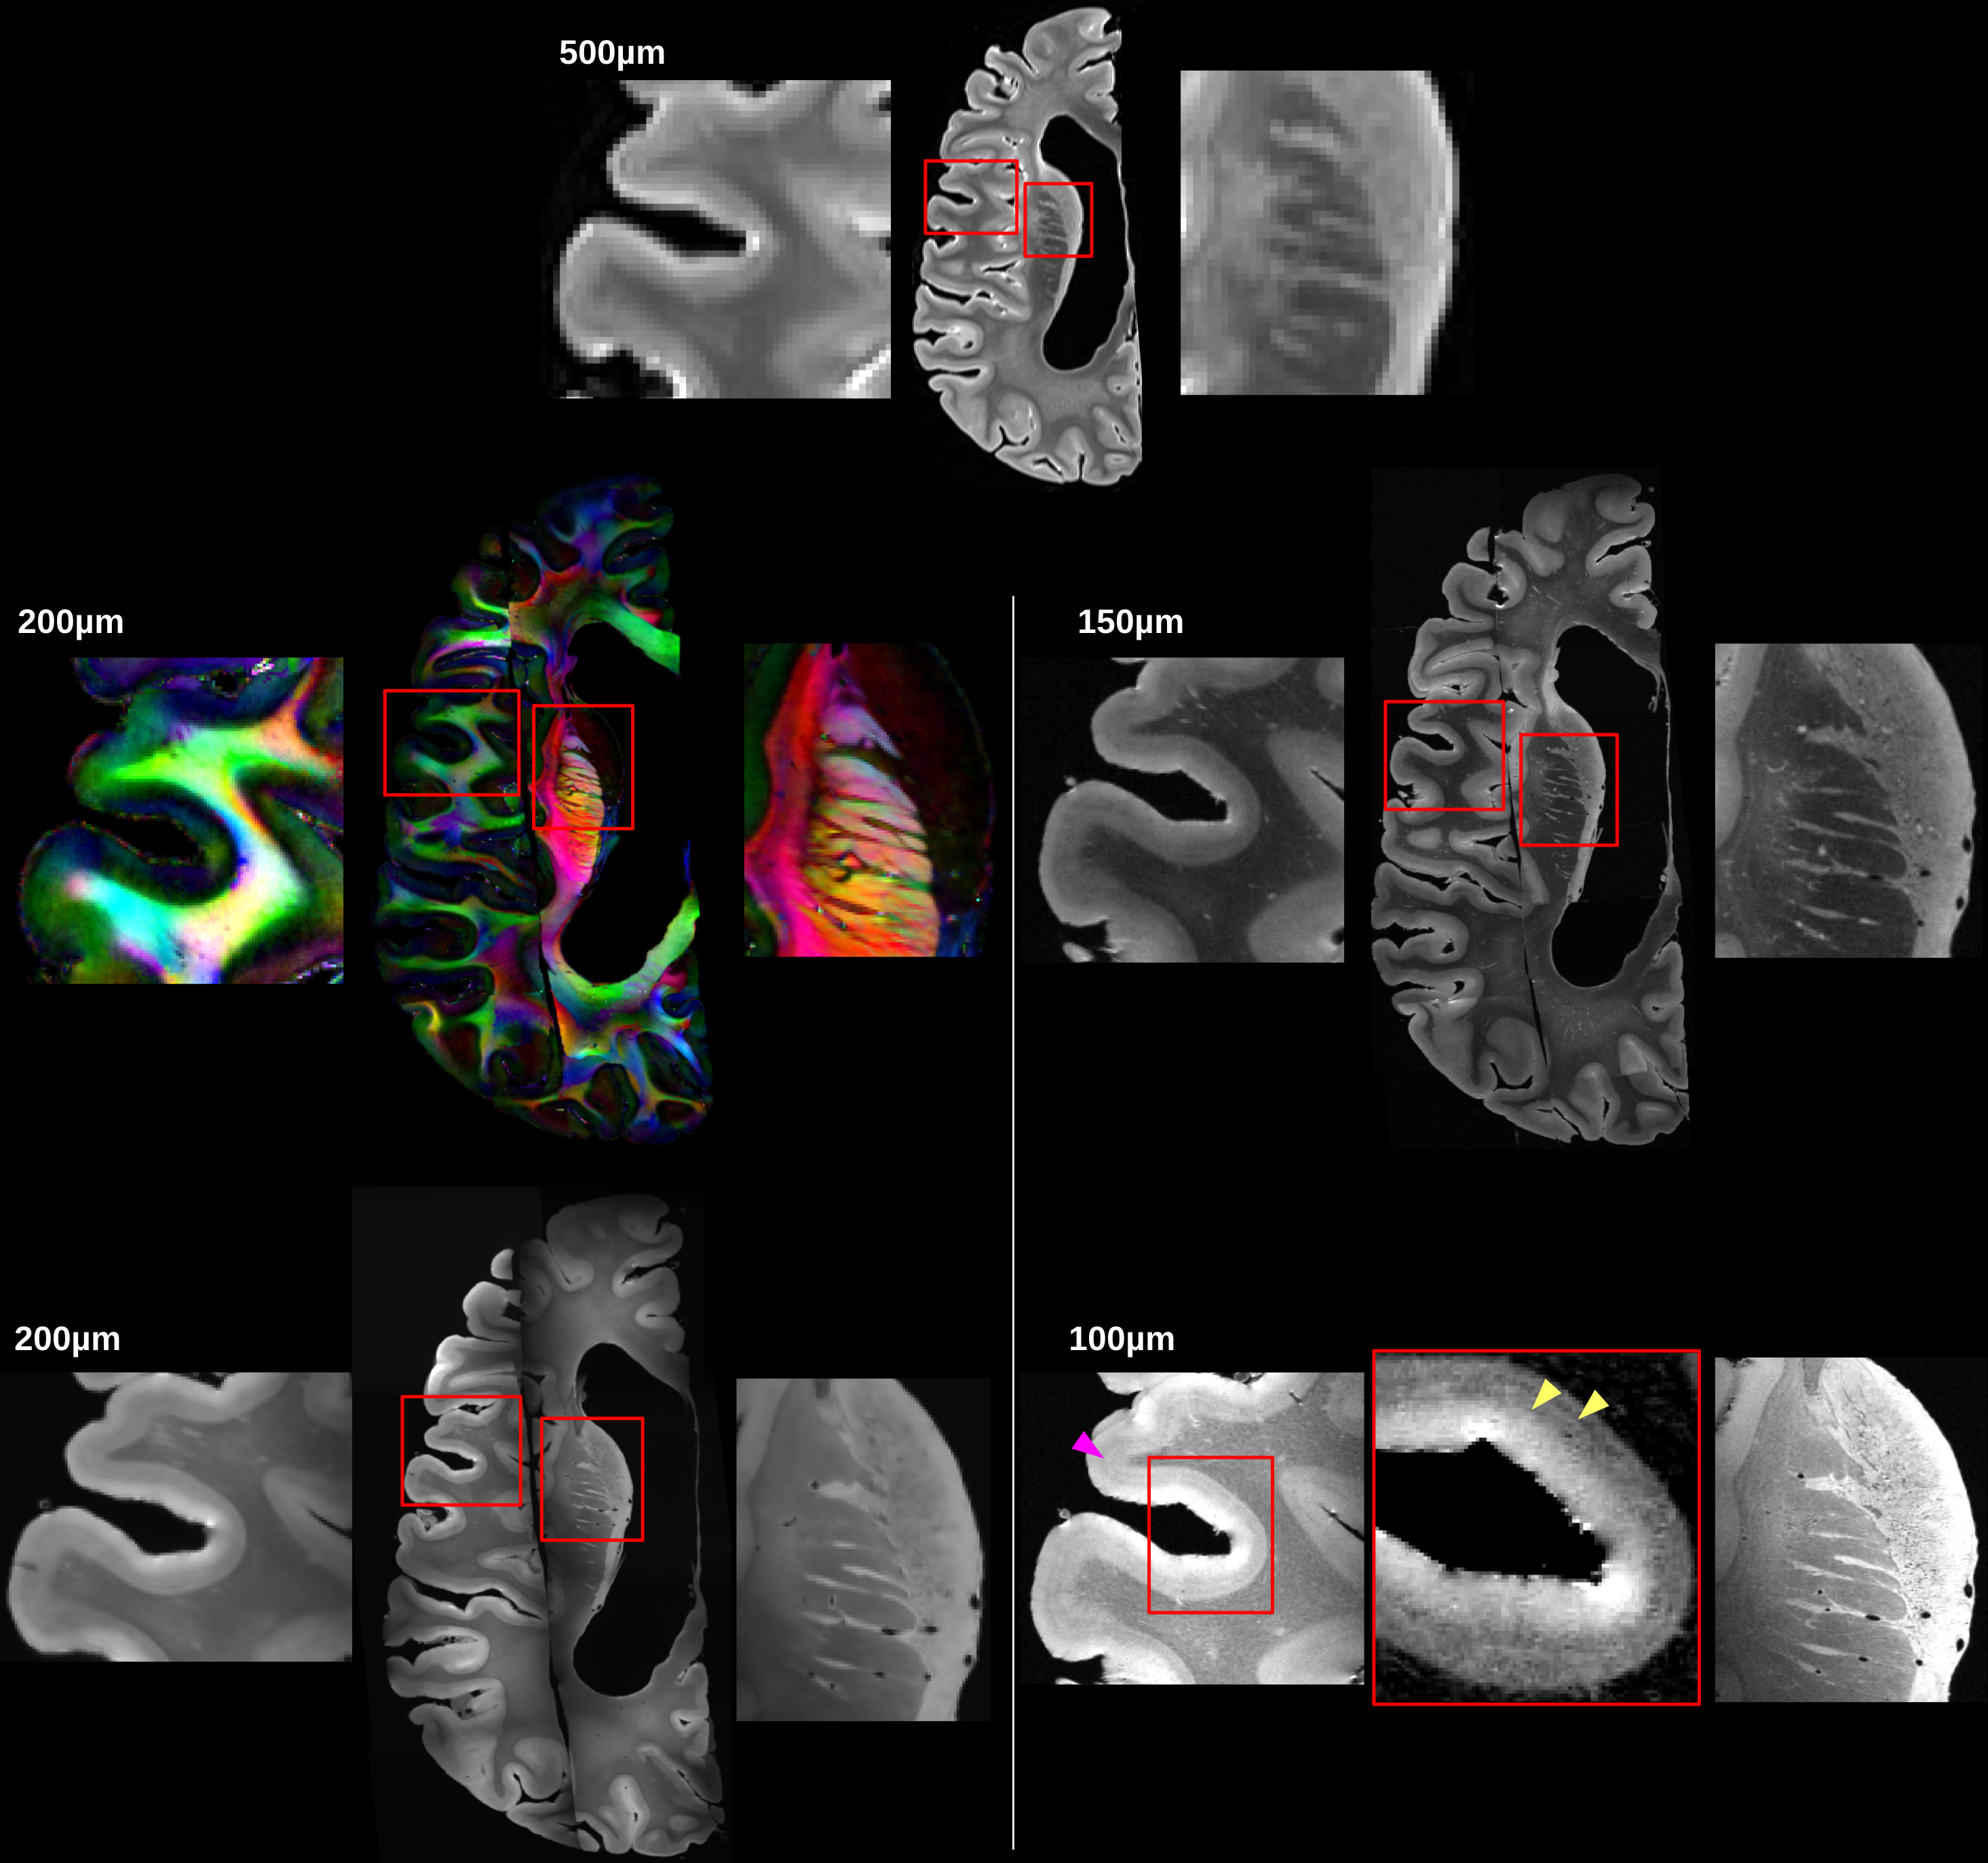
Figure2 shows the reconstructed left hemisphere, at 200, 150 and 100µm isotropic. These images are compared with the anatomical scan obtained at 3T with a spatial resolution of 500µm. The improved resolution reveals the lines of Baillarger in the cortical ribbon, in particular at 100µm (pink arrow), and details of deep nuclei.
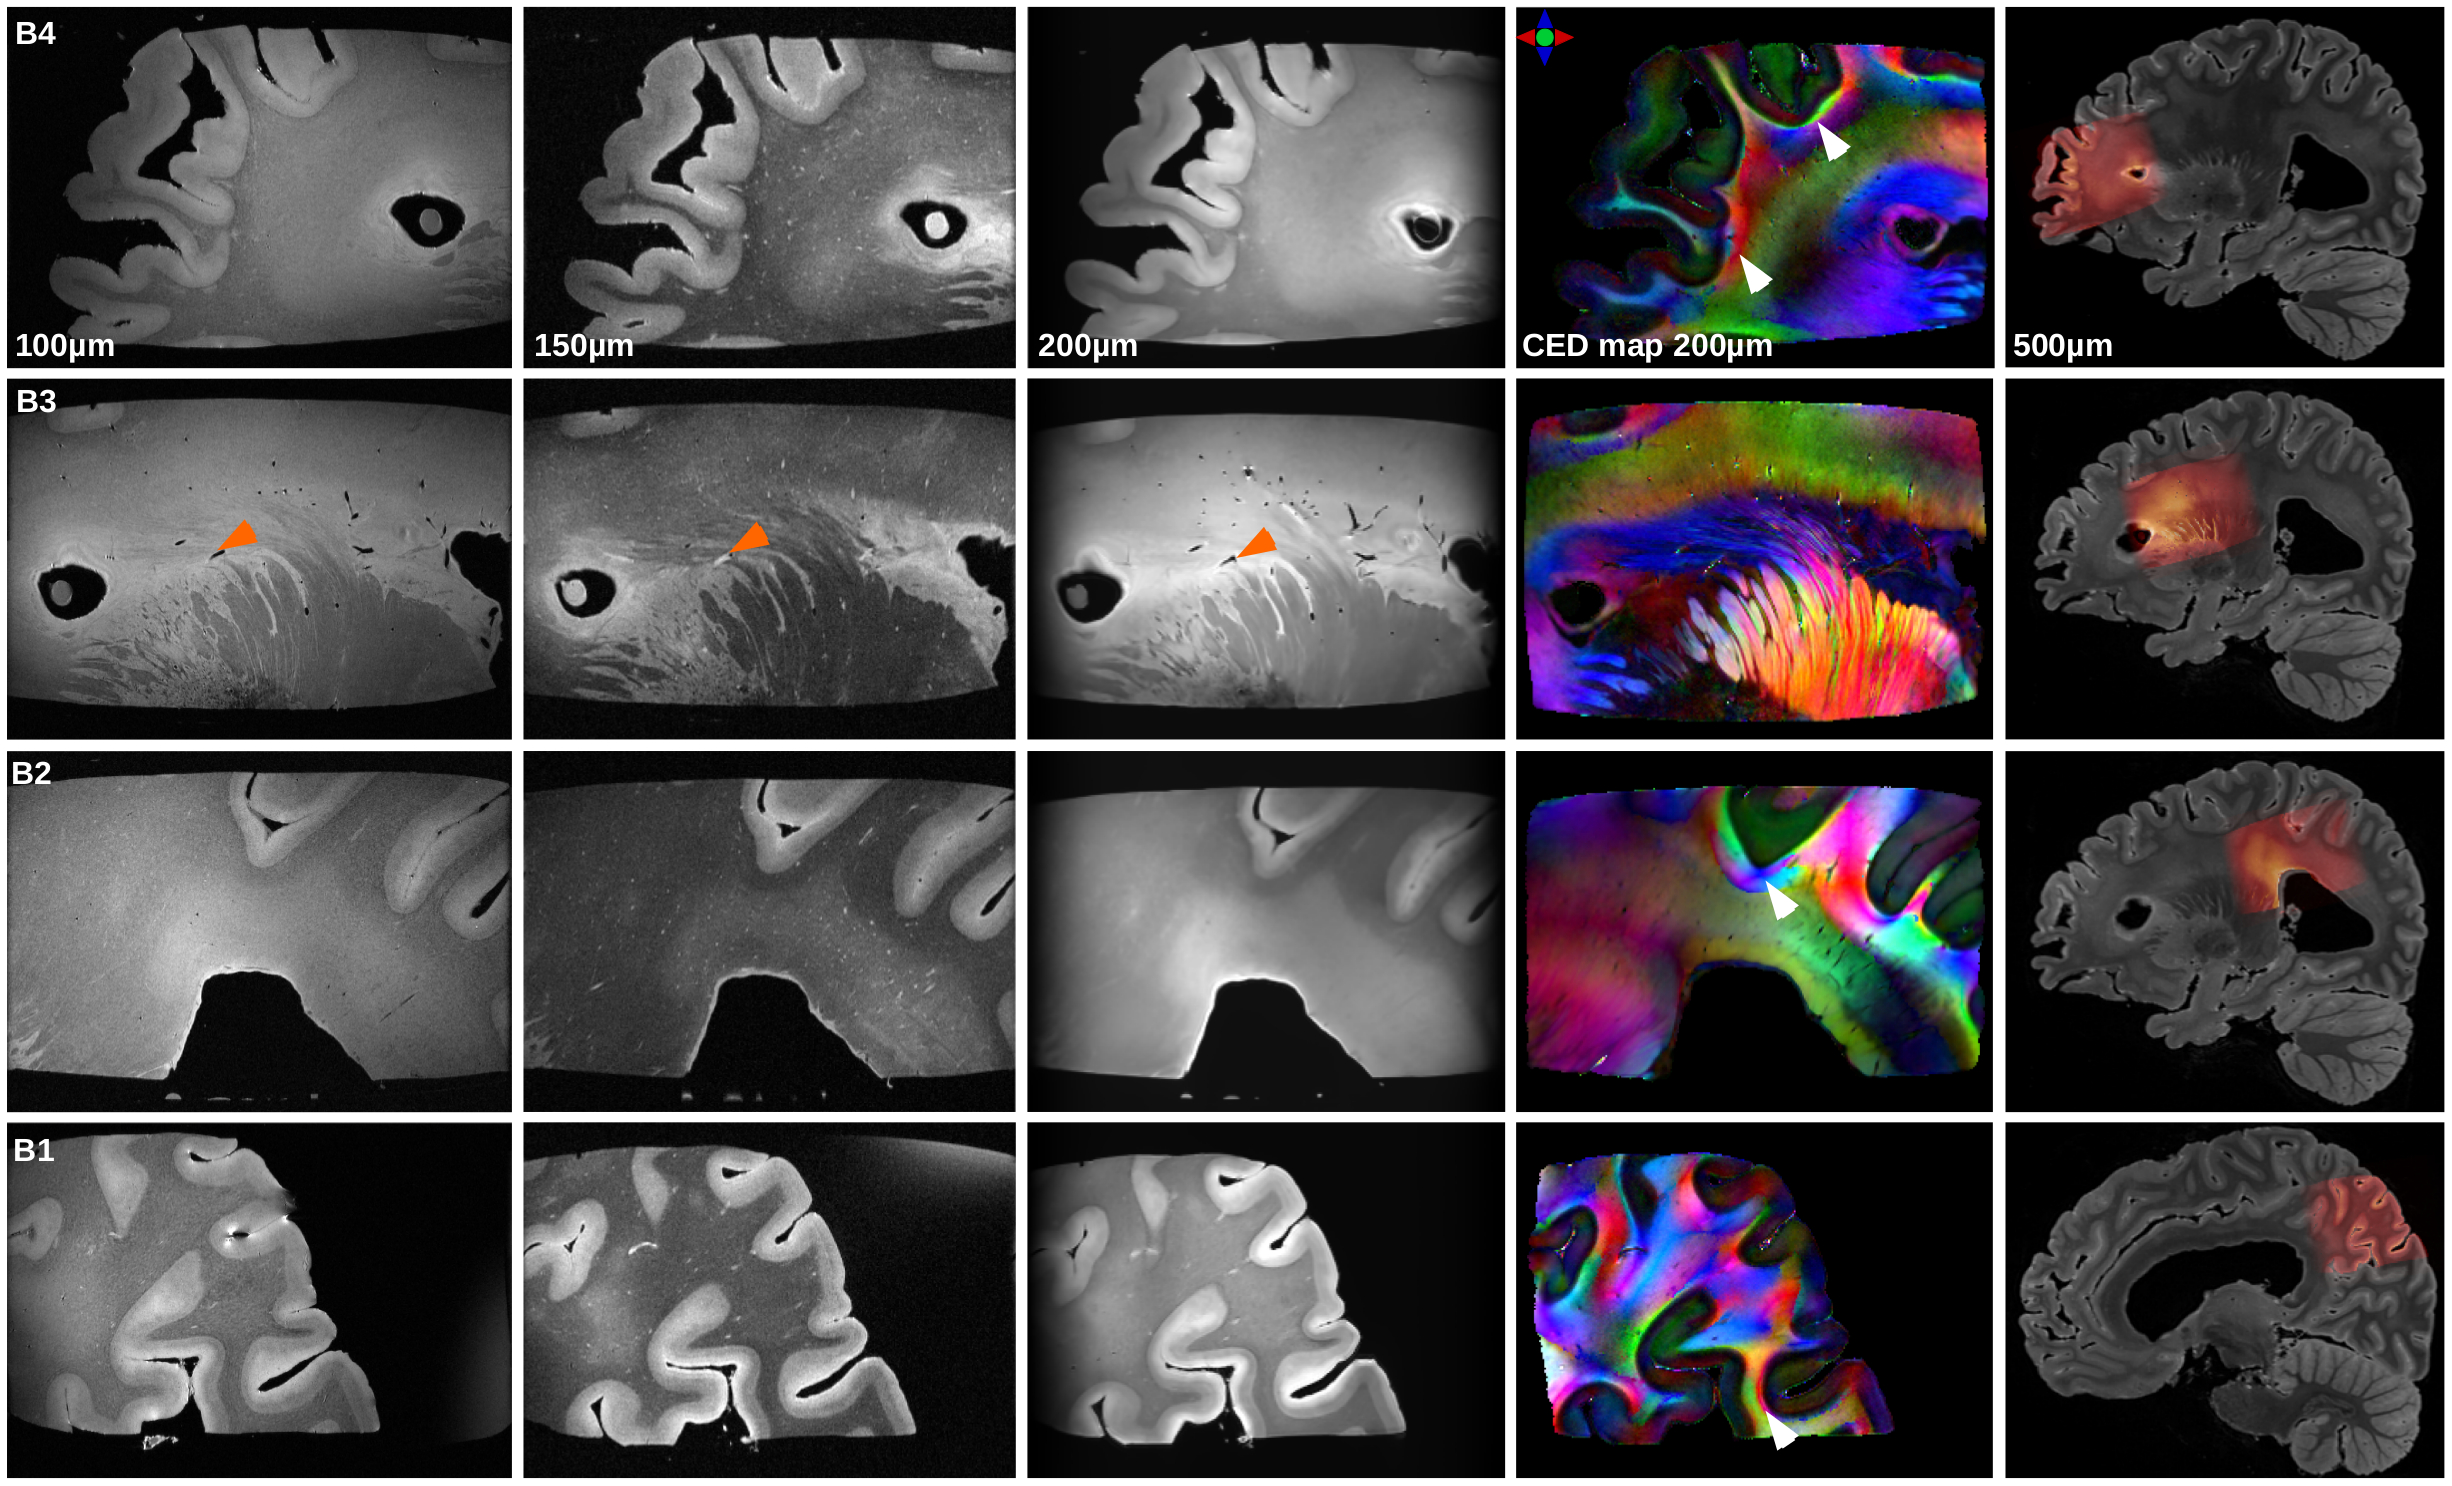
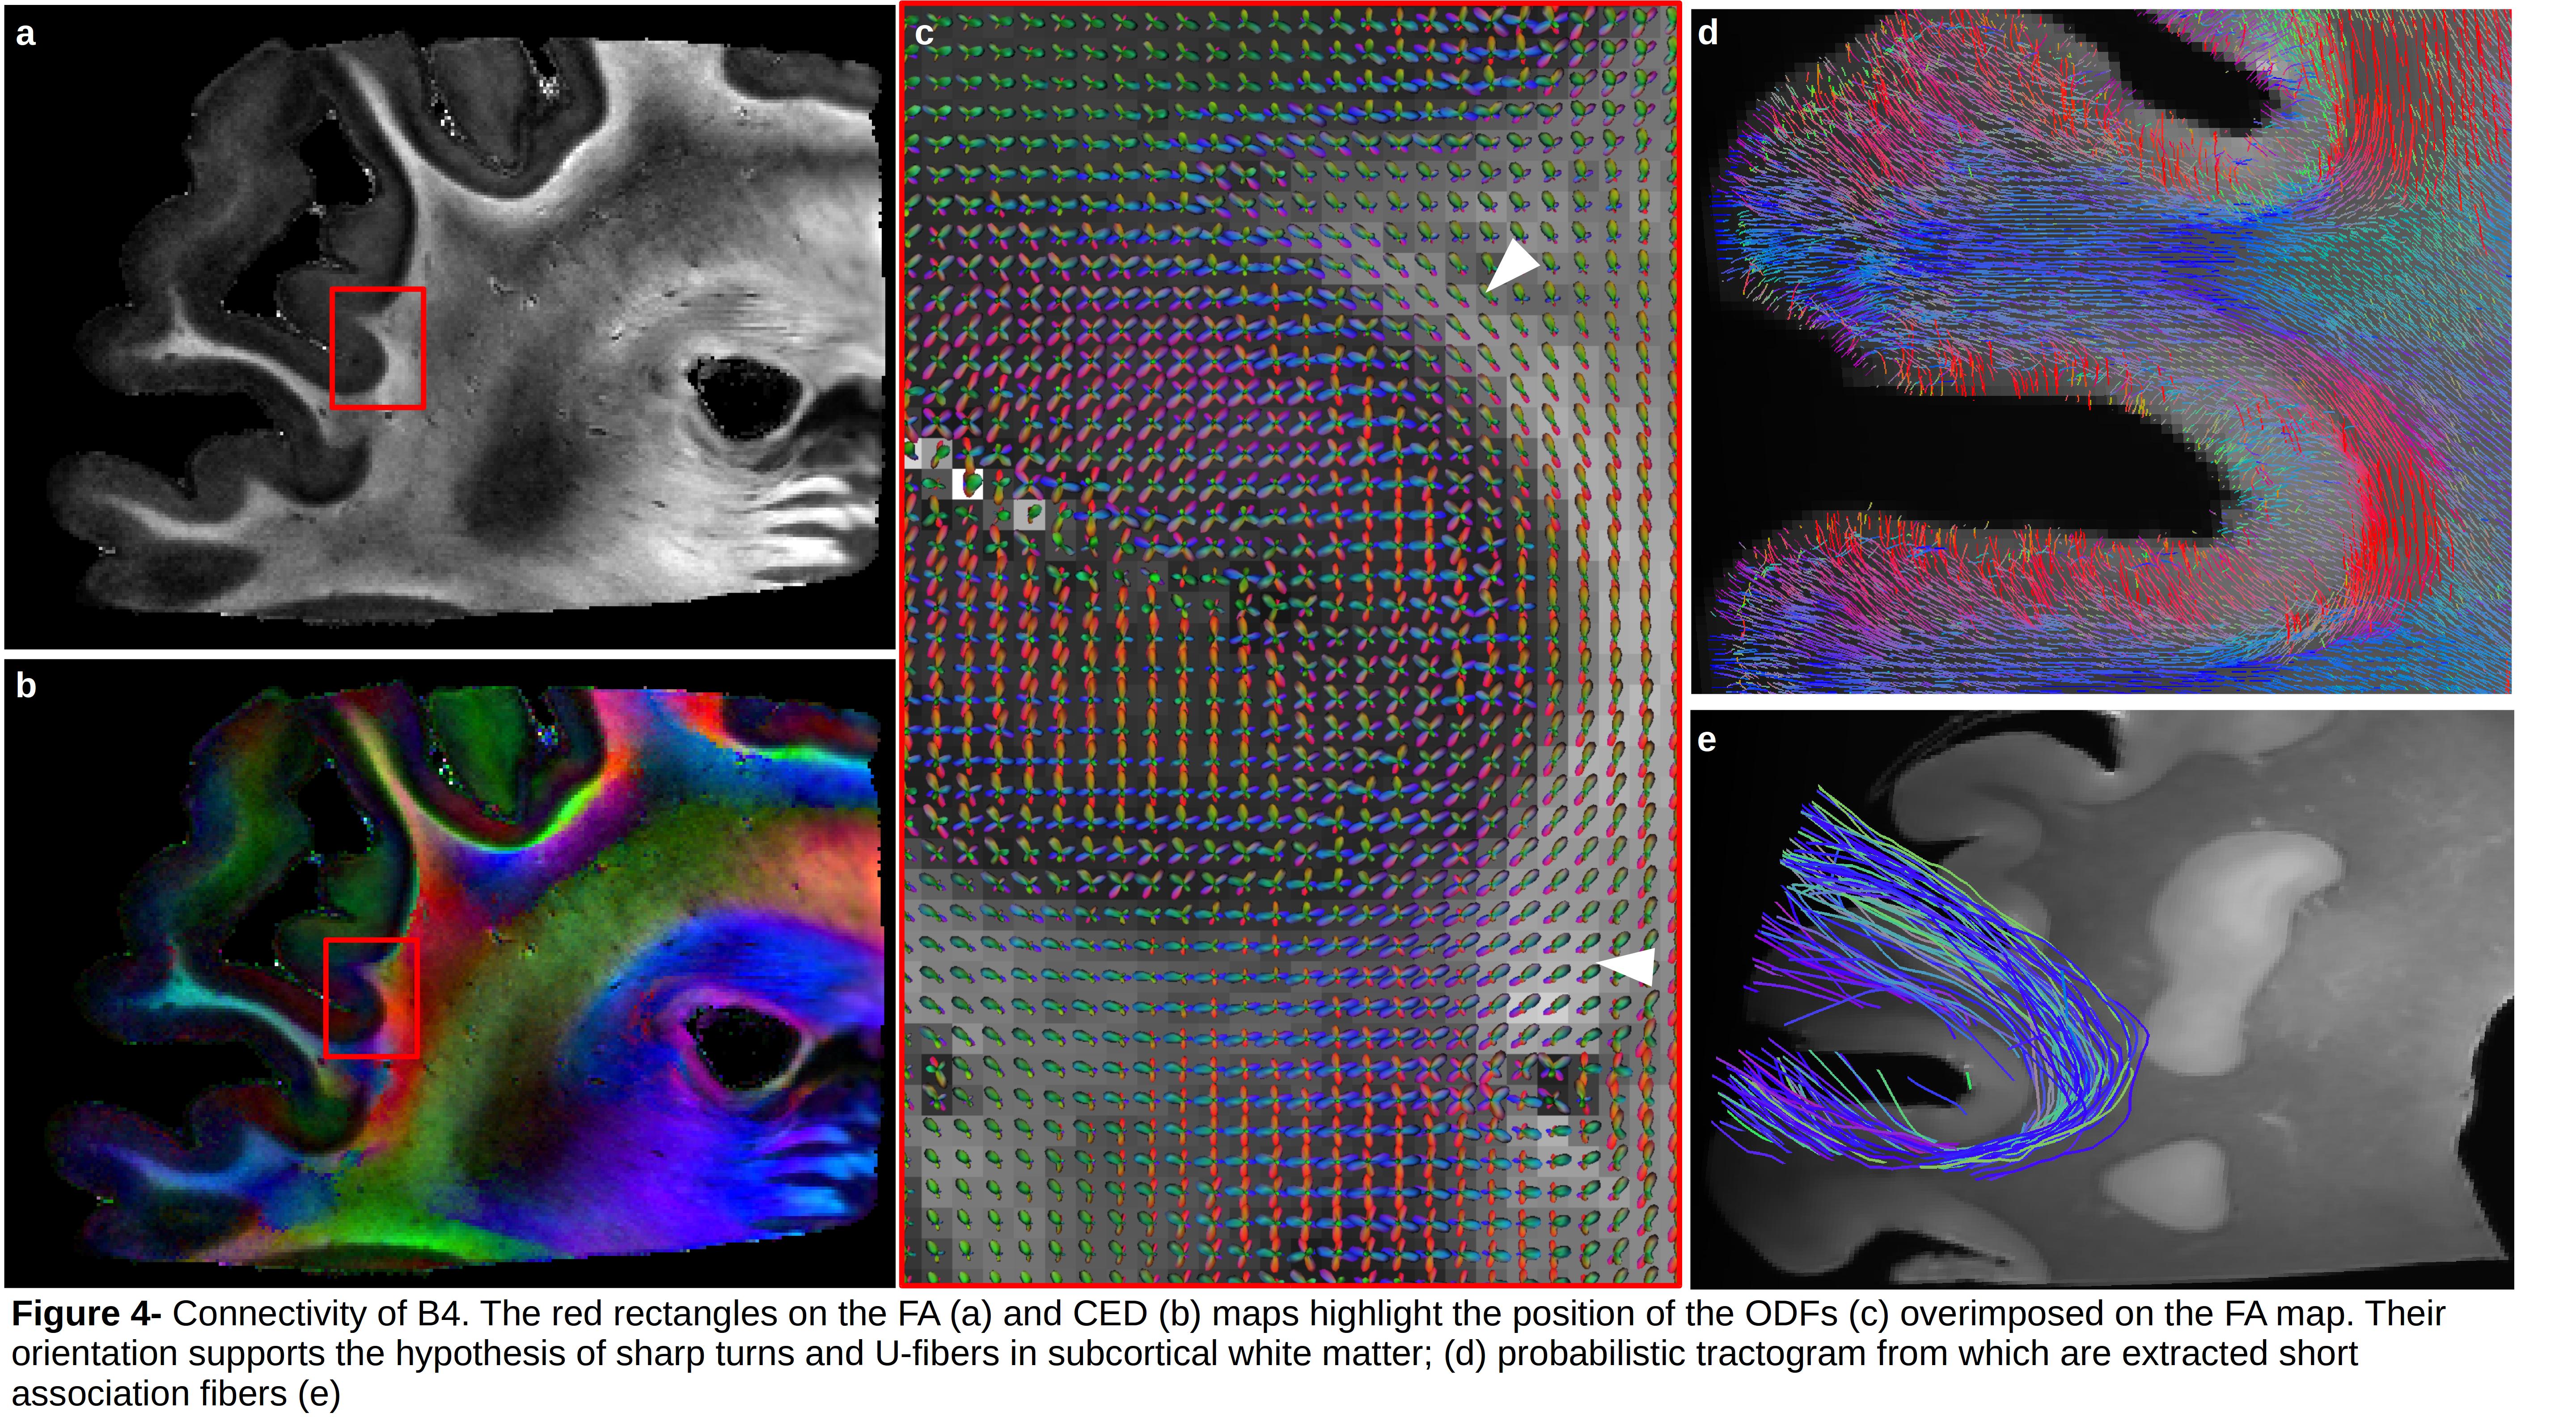
Figure3 depicts the anatomical scans of the four FOVs of block B, CED maps and each FOV superimposed on the blockface image acquired at 3T. White arrowheads highlight subcortical bundles visible on the CED maps, and orange arrowheads show the vasculature that appears black on the image at 100μm and 200μm, and white at 150μm. Figure4 presents the ODF field of B4 superimposed on the FA map. ODFs’ shape supports the hypothesis of sharp turns and U-fibers in subcortical white matter (white arrowheads). Moreover, ODFs inside the cortical ribbon are consistent with the existence of fibers running radial and tangential to the pial surface. Figure4.d depicts the reconstructed tractogram overimposed on B4, from which it is possible to extract short association fibers (Fig4.e).
Figure5 shows NODDI quantitative maps of B4, with the intracellular volume fraction, the concentration factor, the orientation dispersion (OD) and the isotropic fraction. Low OD values under the cortex reveal the presence of U-fibers.
Conclusion
This work providing new anatomical and HYDI datasets at mesoscopic resolutions on an entire human left hemisphere bridges the gap between studies carried out on preclinical systems, investigating very small samples at high-resolution, and studies carried out on clinical systems, scanning larger samples up to an entire brain but with a poor resolution. Such unique dataset open the way to investigate not only the smallest brain structures invisible at lower resolution, but also the fine sub-cortical and inner-structure connectivity as well as the white matter microstructure and cortex cytoarchitecture, thus paving the way, after the acquisition of the right hemipshere, to the construction of a mesoscopic 11.7T human brain MRI atlas.Acknowledgements
This project has received funding from the European Union’s Horizon 2020 Research and Innovation Programme under Grant Agreement No. 785907 (HBP SGA2)References
1. https://bigbrain.loris.ca/main.php
2. Vogt, Cécile. "Allgemeinere ergebnisse unserer hirnforschung." J Psychol Neurol (Leipz) 25 (1919): 279-461.
3. Brodmann, Korbinian. Vergleichende Lokalisationslehre der Grosshirnrinde in ihren Prinzipien dargestellt auf Grund des Zellenbaues. Barth, 1909
4. Zilles, Karl, and Katrin Amunts. "Centenary of Brodmann's map—conception and fate." Nature Reviews Neuroscience 11.2 (2010): 139.
5. Jones, Allan R., Caroline C. Overly, and Susan M. Sunkin. "The Allen brain atlas: 5 years and beyond." Nature Reviews Neuroscience 10.11 (2009): 821
6. Maldjian, Joseph A., et al. "An automated method for neuroanatomic and cytoarchitectonic atlas-based interrogation of fMRI data sets." Neuroimage 19.3 (2003): 1233-1239.
7. Fritz FJ, Tse DHY, Sengupta S, et al. High resolution diffusion MRI and tractography of post mortem human brains using kT‐dSTEAM at 9.4T, Organization for Human Brain Mapping 2017, Vancouver, BC, Canada 4. Zhang, Hui, et al. "NODDI: practical in vivo neurite orientation dispersion and density imaging of the human brain." Neuroimage 61.4 (2012): 1000-1016
8. Buades, Antoni, Bartomeu Coll, and Jean-Michel Morel. "Non-local means denoising." Image Processing On Line 1 (2011): 208-212.
9. Özarslan, Evren, et al. "Mean apparent propagator (MAP) MRI: a novel diffusion imaging method for mapping tissue microstructure." NeuroImage 78 (2013): 16-32
10. Teillac A. et al. "A Novel Anatomically-Constrained Global Tractography Approach to Monitor Sharp Turns in Gyri". In: Descoteaux M., Maier-Hein L., Franz A., Jannin P., Collins D., Duchesne S. (eds) Medical Image Computing and Computer Assisted Intervention − MICCAI 2017. MICCAI 2017. Lecture Notes in Computer Science, vol 10433. Springer, Cham
11. Zhang, Hui, et al. "NODDI: practical in vivo neurite orientation dispersion and density imaging of the human brain." Neuroimage 61.4 (2012): 1000-1016.
Figures