0653
The BigMac dataset: ultra-high angular resolution diffusion imaging and multi-contrast microscopy of a whole macaque brain1FMRIB Centre, Wellcome Centre for Integrative Neuroimaging, Nuffield Department of Clinical Neurosciences, University of Oxford, Oxford, United Kingdom, 2CR-UK/MRC Oxford Institute for Radiation Oncology, Department of Oncology, University of Oxford, Oxford, United Kingdom, 3Wellcome Centre for Integrative Neuroimaging, Experimental Psychology, Medical Sciences Division, University of Oxford, Oxford, United Kingdom, 4Department of Anatomy, Donders Institute for Brain, Cognition and Behaviour, Radboud University Medical Center, Nijmegen, Netherlands, 5Nuffield Department of Clinical Neurosciences, University of Oxford, Oxford, United Kingdom
Synopsis
Diffusion MRI has the ability to reveal the complex connectivity of the human brain. However, the link between the diffusion signal and the underlying tissue microstructure remains elusive. To drive diffusion MRI validation, we present BigMac: a unique dataset which combines ultra-high angular resolution diffusion MRI with microscopy throughout an adult macaque brain.
With this dataset we ask how under-sampling q-space biases our reconstruction of the ‘true’ diffusion profile. Our results indicate that the error associated with interpolating under-sampled data decays exponentially with the angular resolution of sampling, and that high angular resolution is necessary to characterise acutely crossing fibres.
Introduction
Diffusion MRI (dMRI) has great potential for studying the complexity of white matter fibre architecture non-invasively. However, because dMRI is an indirect measure of this microstructure, we require validation datasets for two main purposes: (i) to relate dMRI to microscopy data that directly measures the microstructure of interest; and (ii) to relate high-quality dMRI data to more conventional quality data.
We present the Big Macaque (BigMac) dataset which addresses both of these goals. BigMac combines ultra-high angular resolution dMRI (ultra-HARDI) at multiple resolutions and b-values of up to 10,000 s/mm2 with histology and polarised light imaging in a postmortem macaque brain (Figure 1). The same animal was also scanned in vivo. This dMRI dataset will enable us to characterise the MRI signal in great detail. In particular, with 1000 gradient directions in the outer two shells, we retain dense sampling of the diffusion signal on any arbitrary 2D plane (Figure 2), aiding robust dMRI-microscopy data comparison. The BigMac dataset thus provides a platform from which we can interconnect microstructural features with dMRI signals throughout the entire brain.
To demonstrate the potential of ultra-dense orientation sampling, we investigate to what extent the under-sampling of q-space can bias our estimation of the ‘true’ diffusion signal of crossing fibres.
Methods
An overview of the BigMac data acquisition is given in Figure 1 and Table 1. Postmortem dMRI data was acquired at 7T (Agilent, 400mT/m) with up to 1,000 gradient directions at b-values of 4,000, 7,000 and 10,000 s/mm2 and two spatial resolutions (0.6 and 1 mm3). In vivo data was also acquired. Following MRI, the brain was sectioned along the entire rostro-caudal axis, with consecutive slices processed for PLI and histology.
To investigate the information content captured by the ultra-dense sampling of orientations in BigMac, we consider how the number of sampling directions affects the estimation of the ‘true’ underlying diffusion profile, as reflected in the full 1000 directions. BigMac’s ultra-HARDI data (b = 7,000 and 10,000 s/mm2) was divided into subsets of 32, 64, 90, 250, 500 and 750 gradient directions whilst retaining uniform coverage of q-space1. Using inverse-distance weighting, the diffusion profile of each subset was interpolated along the original 1000 directions and compared to the fully-sampled data to generate an error. Here the ‘smoothness’ of the interpolation was related to the minimum solid angle between q-space samples. Figure 3 demonstrates the interpolation of a single white matter voxel. To study the effect of sampling on different fibre configurations, we fit the ball-and-stick model2,3 to identify and categorised two-fibre voxels according to the incident angle between the fibres, $$$\phi$$$. Finally, the error between the measured and interpolated signal was calculated as a function $$$\theta$$$, the angle between the mean fibre orientation and the diffusion gradient.
Results
Figure 4a shows how under-sampled data routinely fails to faithfully reconstruct the ‘true’ diffusion profile, often under- or over-estimating the diffusion signal perpendicular ($$$\theta = 90°$$$) or parallel to the fibre respectively. Figures 4b,c summarise these plots by showing the mean across $$$\theta$$$ of the absolute errors for each category of $$$\phi$$$. The mean absolute error varies approximately exponentially with the angular resolution (4b). For highly sampled data, b = 10,000 s/mm2 begins to outperform b = 7,000 s/mm2 (see inset), suggesting that contrast is more important than SNR in this regime.
Figure 4c shows the error as a function of angle between fibres, suggesting a more accurate reconstruction of the diffusion profile of fibres crossing at $$$\phi = 45-60°$$$. The high error at small $$$\phi$$$ demonstrates that low angular resolution data fails to capture important information in the diffusion signal that likely discerns multiple, highly-aligned fibres from disperse single fibre populations. This $$$\phi$$$ dependence of the error is less marked for high angular resolution data.
In basic simulation, the reconstruction accuracy was not affected by the angular resolution of the data.
Discussion/Conclusion
This study constitutes the first investigation of the BigMac dataset. The results demonstrate that the error associated with reconstructing the diffusion profile decreases exponentially with the angular resolution of sampling, and that high angular resolution is necessary to characterise acutely crossing fibres. As our analysis is independent of any particular diffusion model (i.e. is based purely on an interpolation of the signal), these results have implications for all HARDI-based analyses.
This study has considered the highly-sampled dMRI data of BigMac to represent the ground truth of the diffusion profile. Future work will focus on the harmonisation of the dMRI, histology and PLI data to both validate and drive biophysical modelling of the white matter microstructure.
Acknowledgements
This work was supported by the Wellcome Trust (grant WT202788/Z/16/A), EPSRC and MRC (grants EP/L016052/1 and EP/L016052/1). AK and NS were funded by Cancer Research UK (grant C5255/A15935). JS was supported by a Sir Henry Dale Wellcome Trust Fellowship (105651/Z/14/Z). The Wellcome Centre for Integrative Neuroimaging is supported by core funding from the Wellcome Trust (203139/Z/16/Z).
It should be noted that SJ and KM contributed equally to this work.
References
1. Cook PA, Symms M, Boulby PA, and Alexander DC. Optimal acquisition orders of diffusion‐weighted MRI measurements. J. Magn. Reson. Imaging 2007; 25: 1051-1058.
2. Behrens T et al. Characterization and propagation of uncertainty in diffusion‐weighted MR imaging. Magn. Reson. Med. 2003; 50: 1077-1088.
3. Jbabdi S, Sotiropoulos SN, Savio AM, Graña M, Behrens TE. Model-based analysis of multishell diffusion MR data for tractography: how to get over fitting problems. Magn Reson Med. 2012; 68(6):1846-55.
Figures
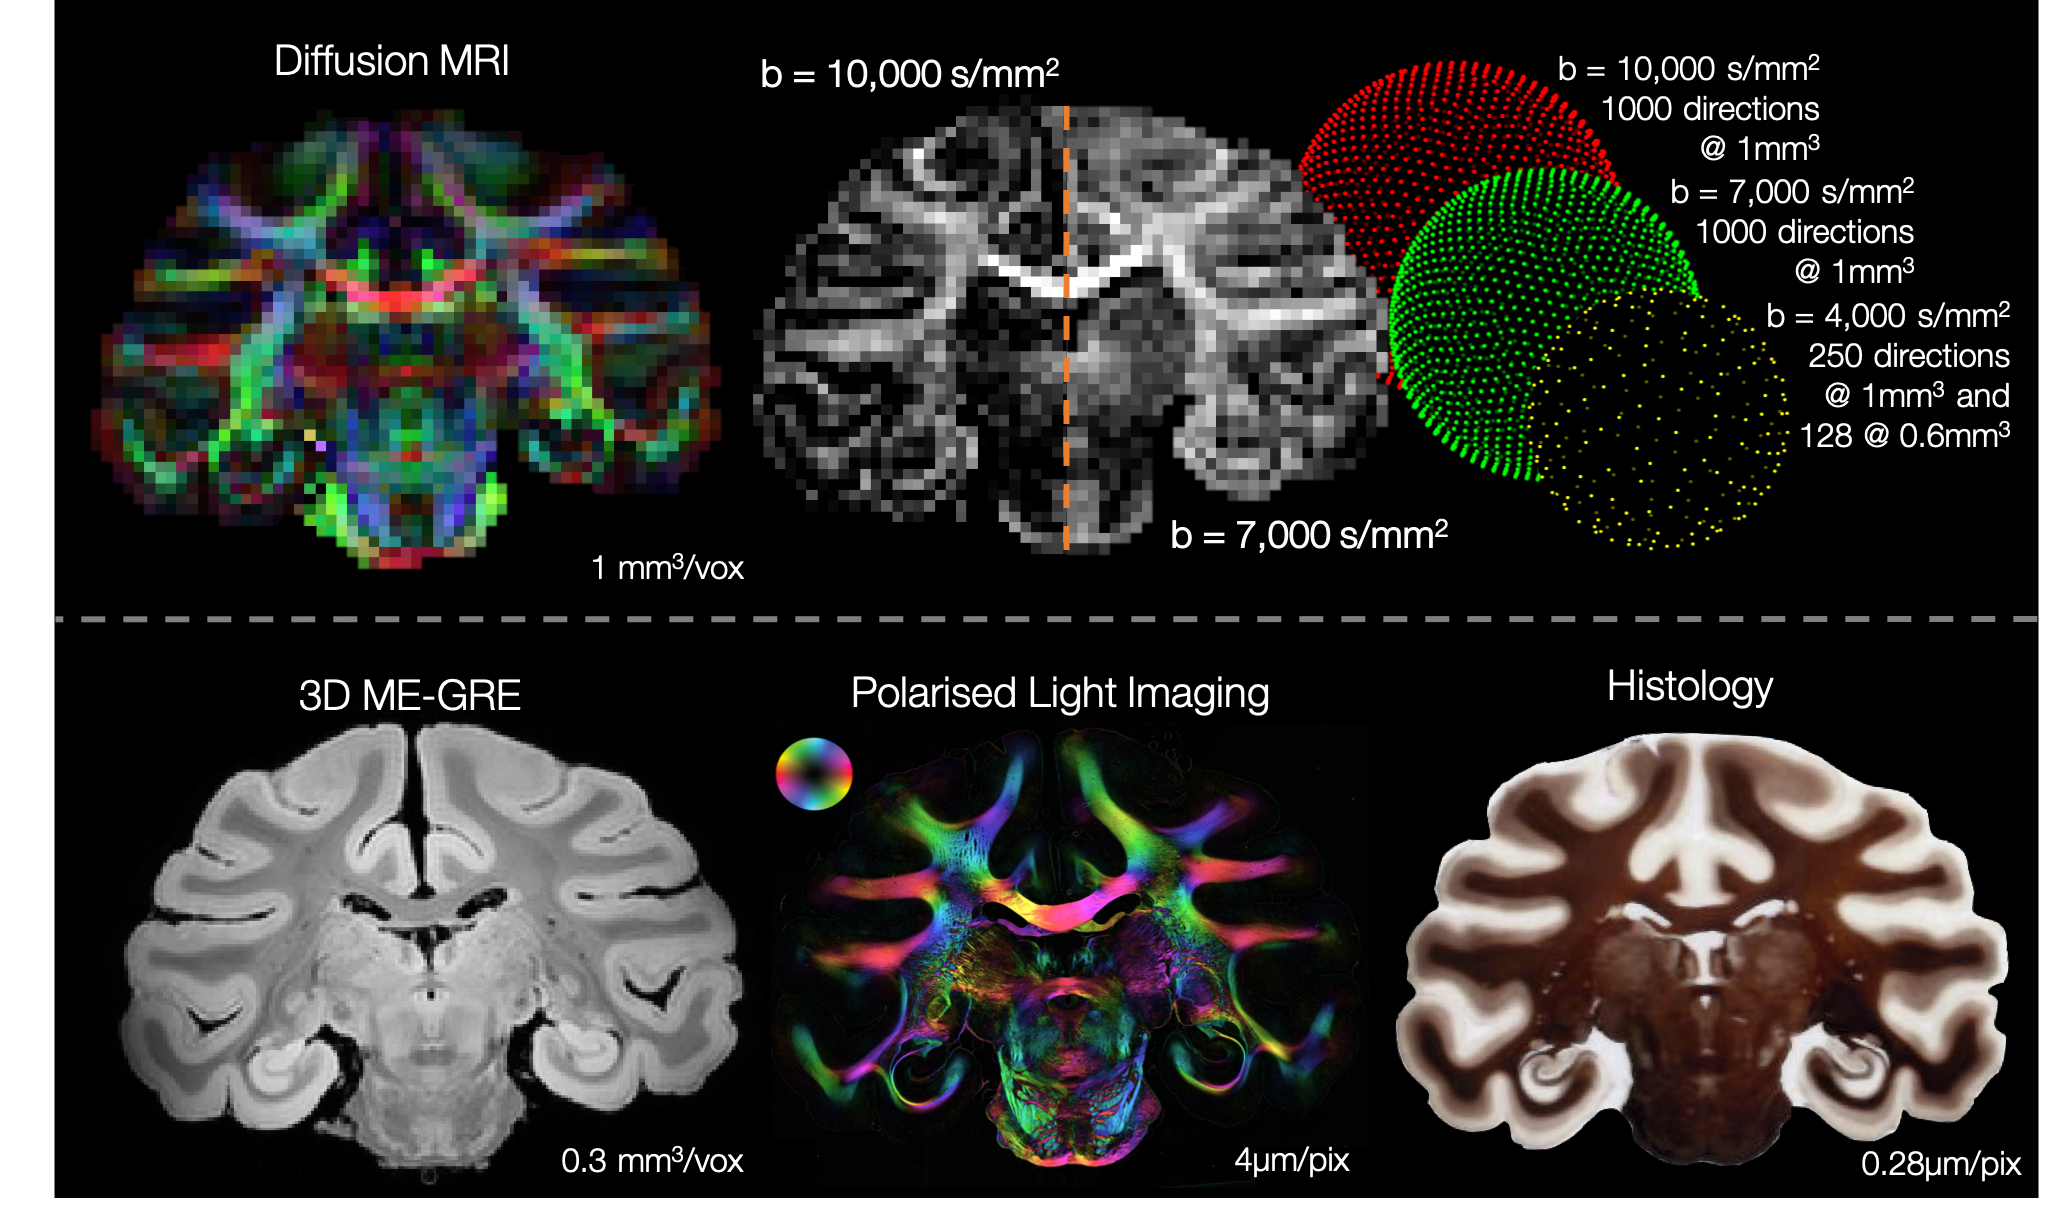
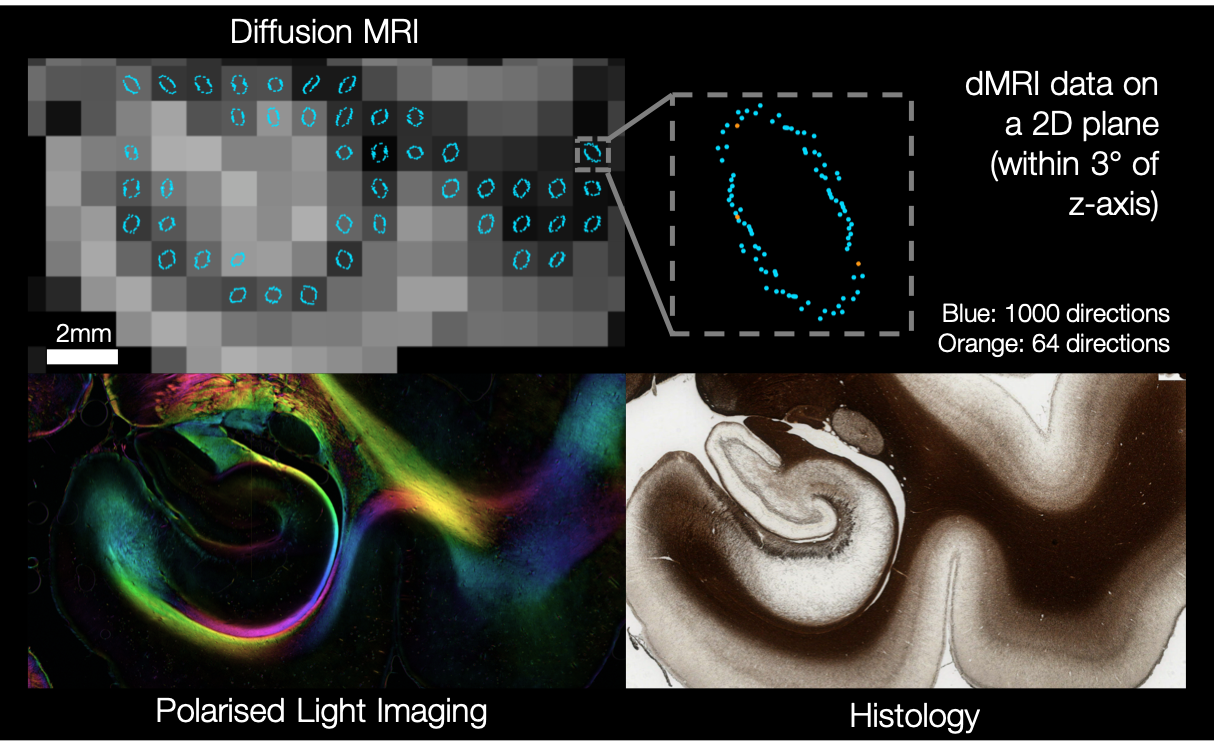
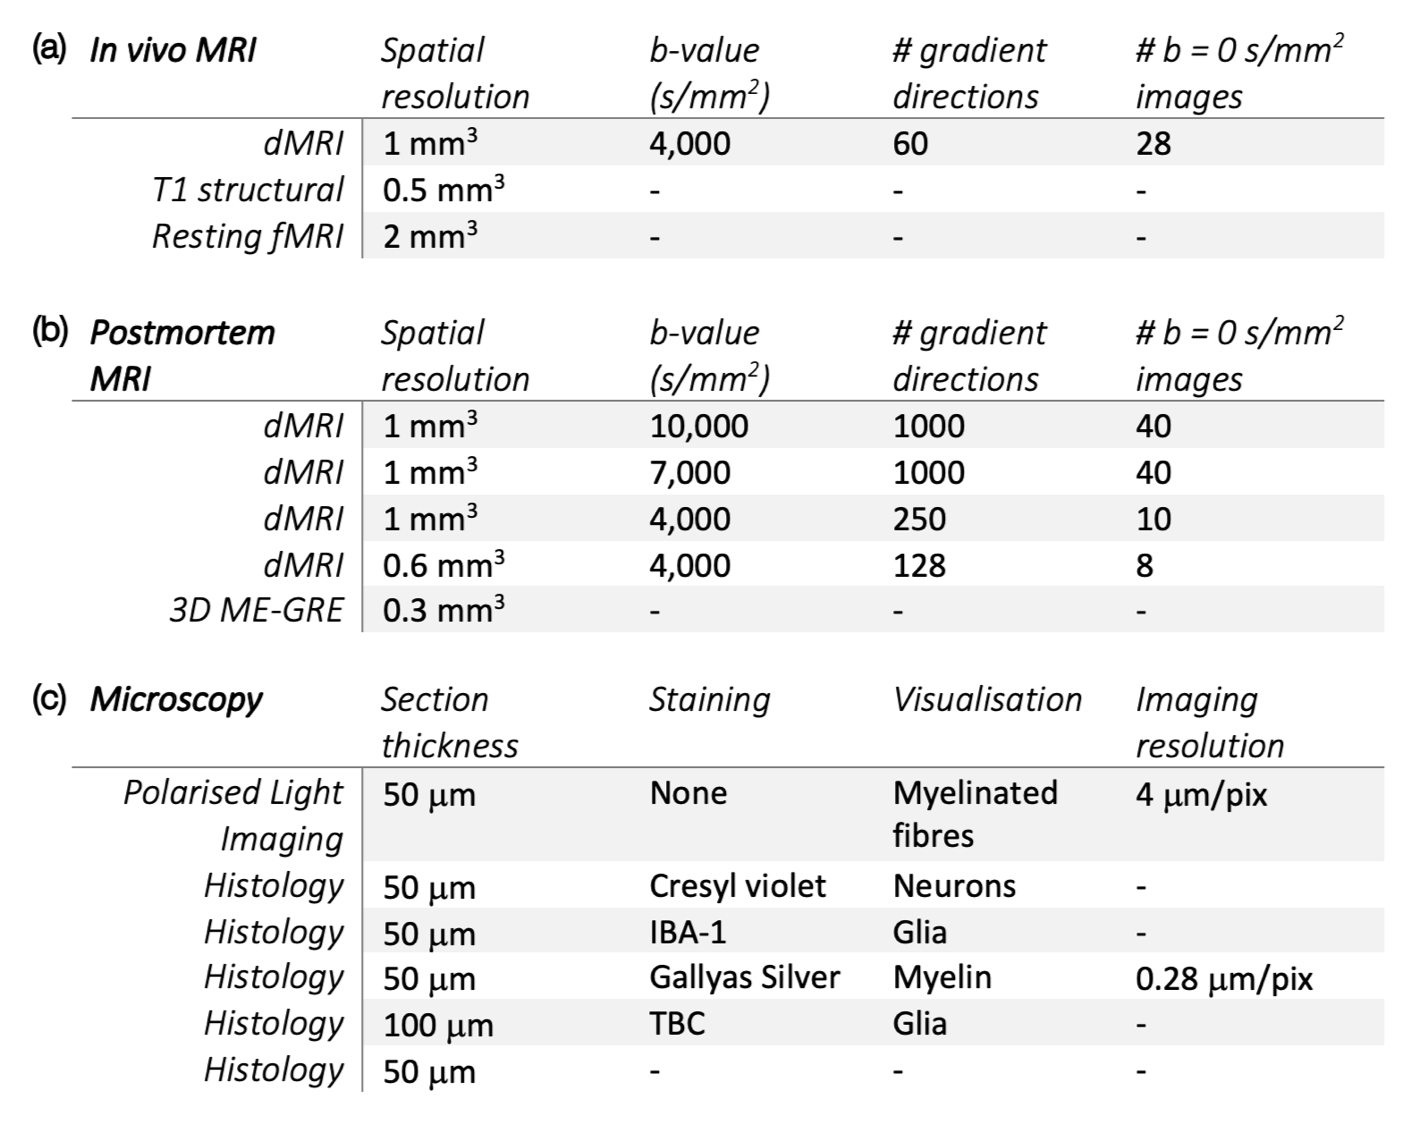
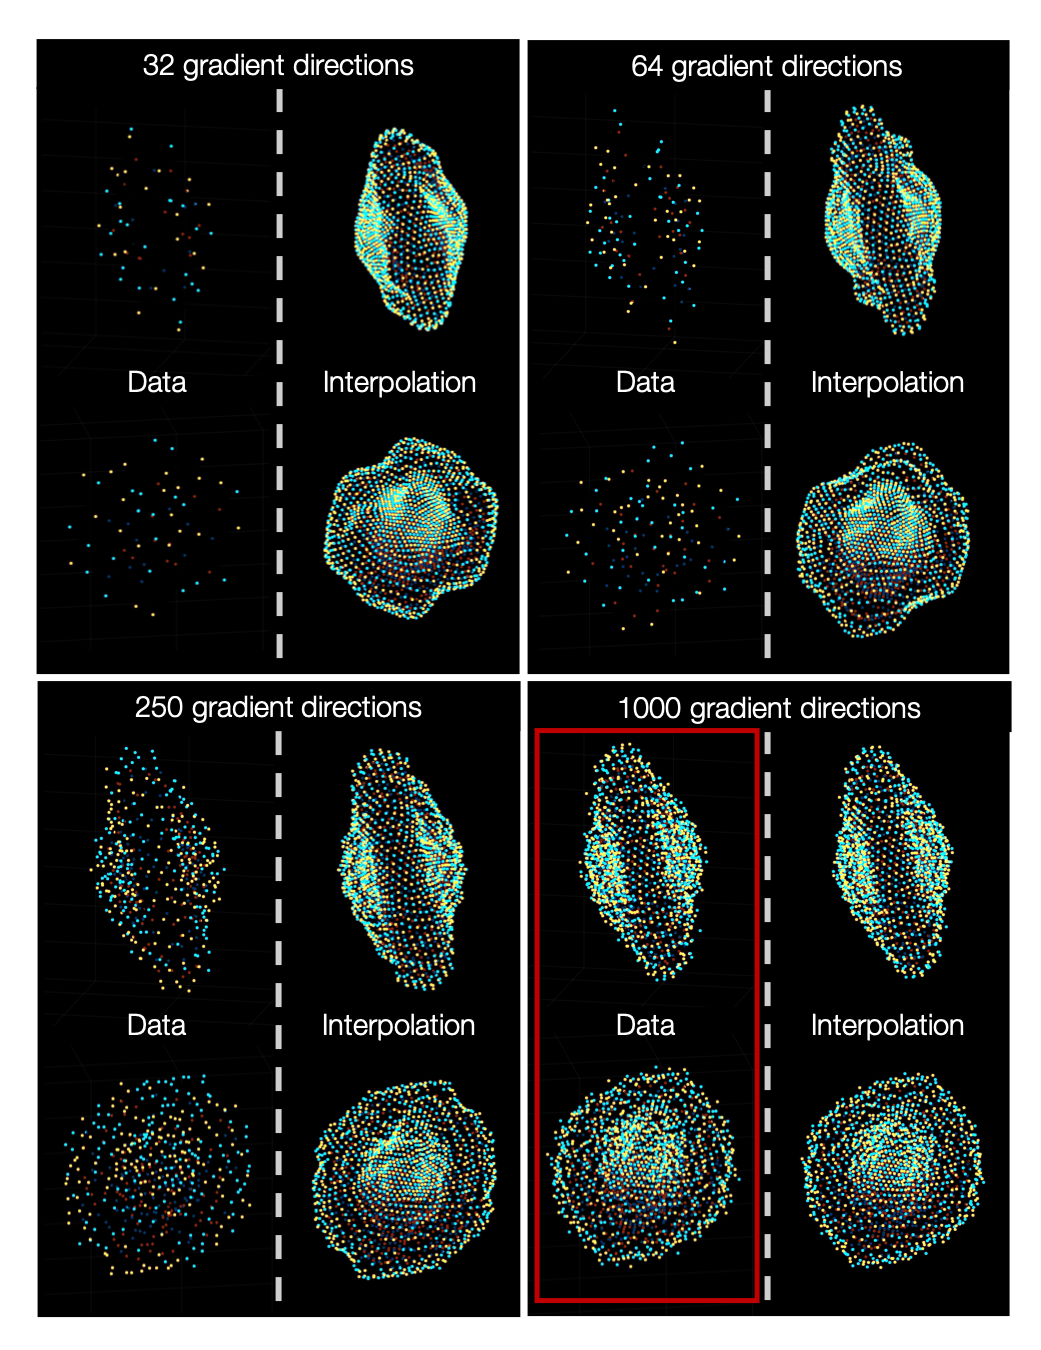
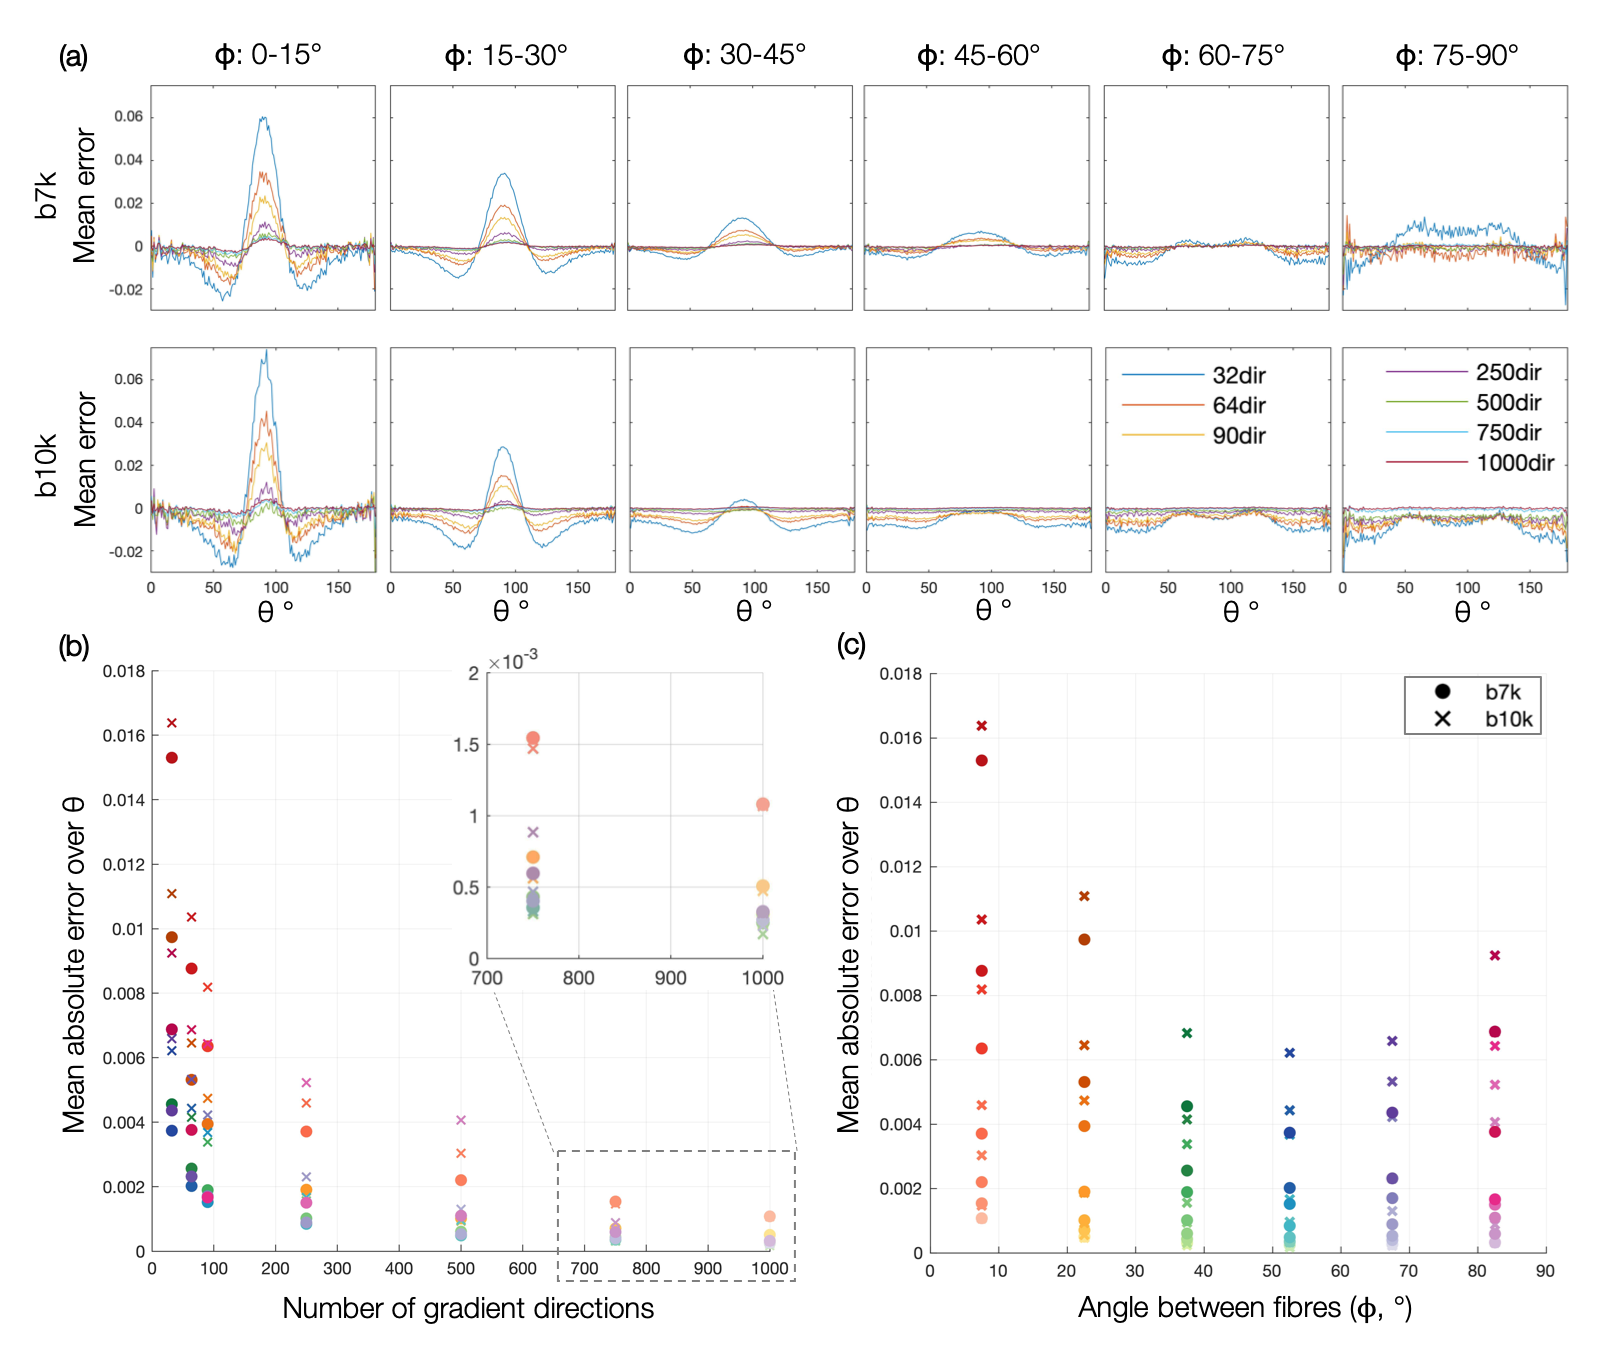
Figure 4: Errors associated with reconstructing the diffusion profile from under-sampled data in 2-fibre voxels. Crossing fibres are categorised by $$$\phi$$$, the acute angle between the fibres. (a) The mean error between fully-sampled and interpolated data is plotted as a function of $$$\theta$$$, for each category of $$$\phi$$$. (b,c) Summary figures: each point shows the mean across $$$\theta$$$ of the absolute errors in (a). Part (b) demonstrates an approximately exponential relationship between the absolute error and the angular resolution of the data, whilst (c) highlights the high accuracy associated with reconstructing fibres crossing at $$$\phi$$$ = 45-60°.