0652
Histological validation of the brain cell body imaging with diffusion MRI at ultrahigh field1Centre for Medical Image Computing, Department of Computer Science, University College London, London, United Kingdom, 2Champalimaud Research, Champalimaud Centre for the Unkown, Lisbon, Portugal
Synopsis
Biophysical modelling of diffusion-weighted MRI (DW-MRI) data can help to gain more insight into brain microstructure. However, models need to be validated.
This work validates a recently-developed technique for non-invasive mapping of brain cell-body (soma) size/density with DW-MRI, by using ultrahigh-field DW-MRI experiments and histology of mouse brain.
Predictions from numerical simulations are experimentally confirmed and brain’s maps of MR-measured soma size/density are shown to correspond very well with histology. We provide differential contrasts between cell layers that are less expressed in tensor analyses, leading to novel complementary contrasts of the brain tissue. Limitations and future research directions are discussed.
Introduction
Mapping brain microstructure noninvasively using diffusion-weighted MRI (DW-MRI) remains a formidable challenge due to the complexity of the underlying constituents and the relatively featureless diffusion-driven signal decay. Biophysical modelling can help to gain more insight into the microstructure1-3. However, it is very difficult to choose the correct model4, and validation is necessary.
This work validates a recently-developed technique5 for non-invasive mapping of brain cell-body (namely soma) size and density with DW-MRI.
Advanced Monte-Carlo simulations, based on a recently-proposed framework6, showed that soma size/density may have a specific signature on the direction-averaged DW-MRI signal Save at high b-values5,7. Simulations also suggested that at diffusion times td<30 ms, the water exchange between neurites and soma may be neglected, supporting the design of a simple three-compartment model to quantify the presence of soma5:
Save(b)/S(b=0)=fsticksSsticks(b,Da)+fsphereSsphere(b,Dsphere,Rsphere)+(1-fsticks-fsphere)S(b,Diso) [1]
where fsticks represents the MR cell-fibres signal fraction, Da axial diffusivity; fsphere MR soma signal fraction, Rsphere soma radius, Dsphere and Diso intra-soma and extra-cellular diffusivity.
Here we use ultrahigh field DW-MRI and histology of mouse brain to validate those simulation results7 and the proposed compartment model5.
Methods
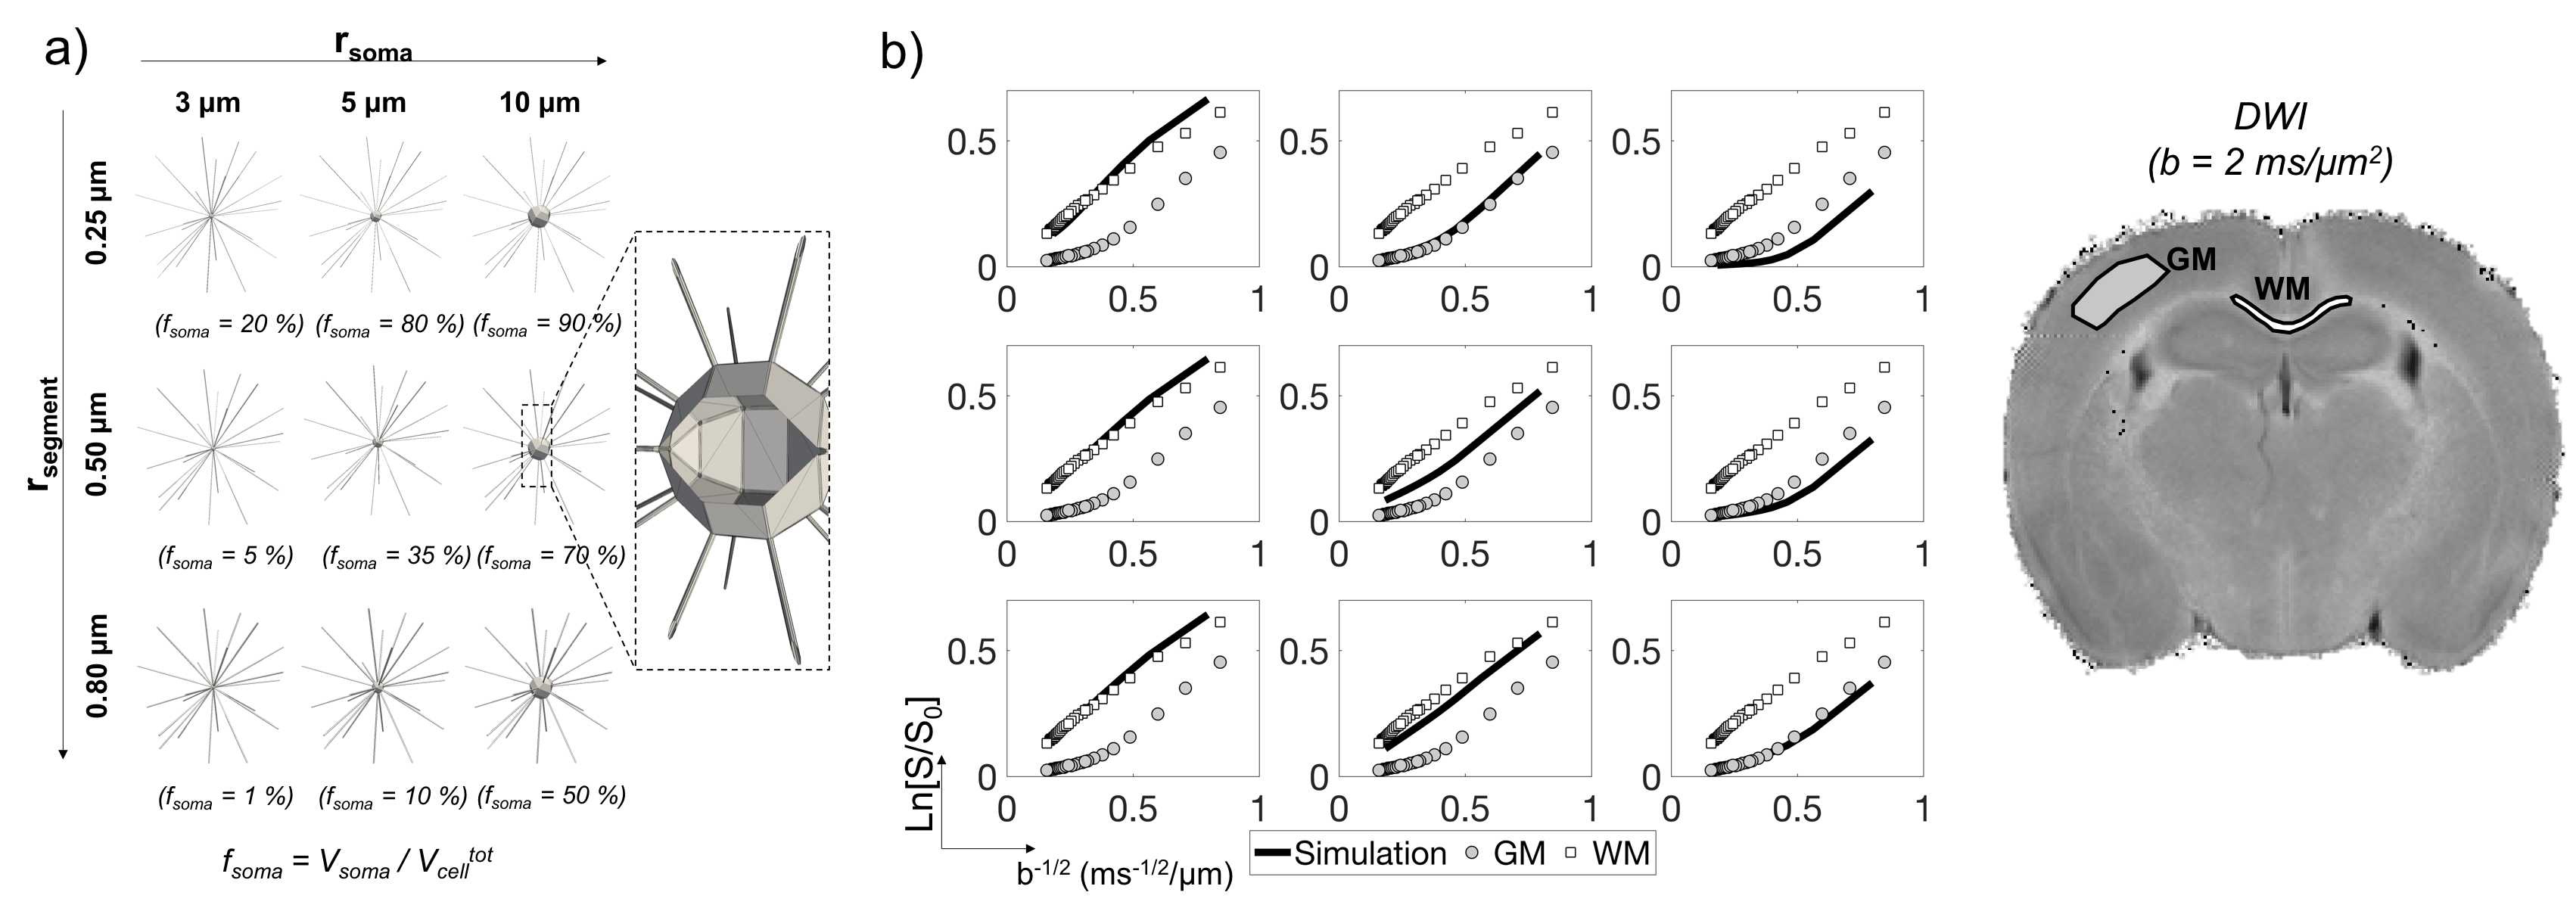
Simulations. Detailed three-dimensional geometries were constructed to mimic realistically connected neurites, in different soma size/volume fraction (rsoma,fsoma) conditions, as proposed in5-7(Fig.1a). The Save(b) signals, as measured by a Pulsed-Gradients-Spin-Echo (PGSE) sequence, were computed in CAMINO8 for b-values=[0:1:40] ms/μm2, δ/Δ=3/11 ms and direction-average across 40 gradient directions (Fig.1b). Only intracellular water diffusion was simulated. However, the effect of extracellular diffusion and membrane permeability were shown to be negligible at very high b-values9 and diffusion times<20 ms10.
Specimen preparation. All animal experiments were pre-approved by the institutional and national authorities and were carried out according to European Directive 2010/63. Mice (N=2), male, 8 weeks old, were perfused intracardially with 4% paraformaldehyde. The brains were isolated and kept 48h in 4% paraformaldehyde and 5 days in PBS (changed daily), before being transferred to a 10 mm NMR tube filled with Fluorinert (Sigma Aldrich) for susceptibility matching. Upon MRI, tissue was used for microscopy as described in11 to provide histological banchmark.
MRI experiments. All experiments were performed using a 16.4 T MRI scanner (Bruker BioSpin, Karlsruhe, Germany) operating at 700 MHz for 1H nuclei equipped with a micro5 imaging probe with maximum gradient strength 3000 mT/m isotropically. The brain was kept at constant temperature of 37°C. DW-MRI were acquired using a PGSE sequence with: TE/TR=20/2500 ms; δ/Δ=3/11 ms; b=0,1,2,3,5,8,10,12,16,20,25,40 ms/μm2, 40 gradient directions, resolution 50x50x250 μm3, 10 slices, 4 averages.
Data preprocessing and analysis. Data were denoised using MP-PCA12 and Gibbs ringing corrected13. No artifacts from movement or eddy-current were observed. Data at b=3 ms/μm2 were used to compute diffusion tensor imaging (DTI) maps in mean diffusivity (MD) and fractional anisotropy (FA), using FSL14. Relation [1] was voxel-wise fitted to the measured Save(b) signal to estimate fsticks, Da, fsphere, Rsphere, Diso, fixing Dsphere=3 μm2/ms, as previously described5.
Results
Simulations vs. experiments. Simulations predicted that, at Δ=11 ms, S(b-1/2) shows specific curvature in the range 0.2<b-1/2<0.5 induced by specific (rsoma,fsoma) conditions (Fig.1b). In agreement, the signal decay extracted from ROIs known to have different (rsoma,fsoma) conditions, like corpus-callosum white matter (WM) and cortical gray matter (GM), confirms that these are correct (Fig.1b).
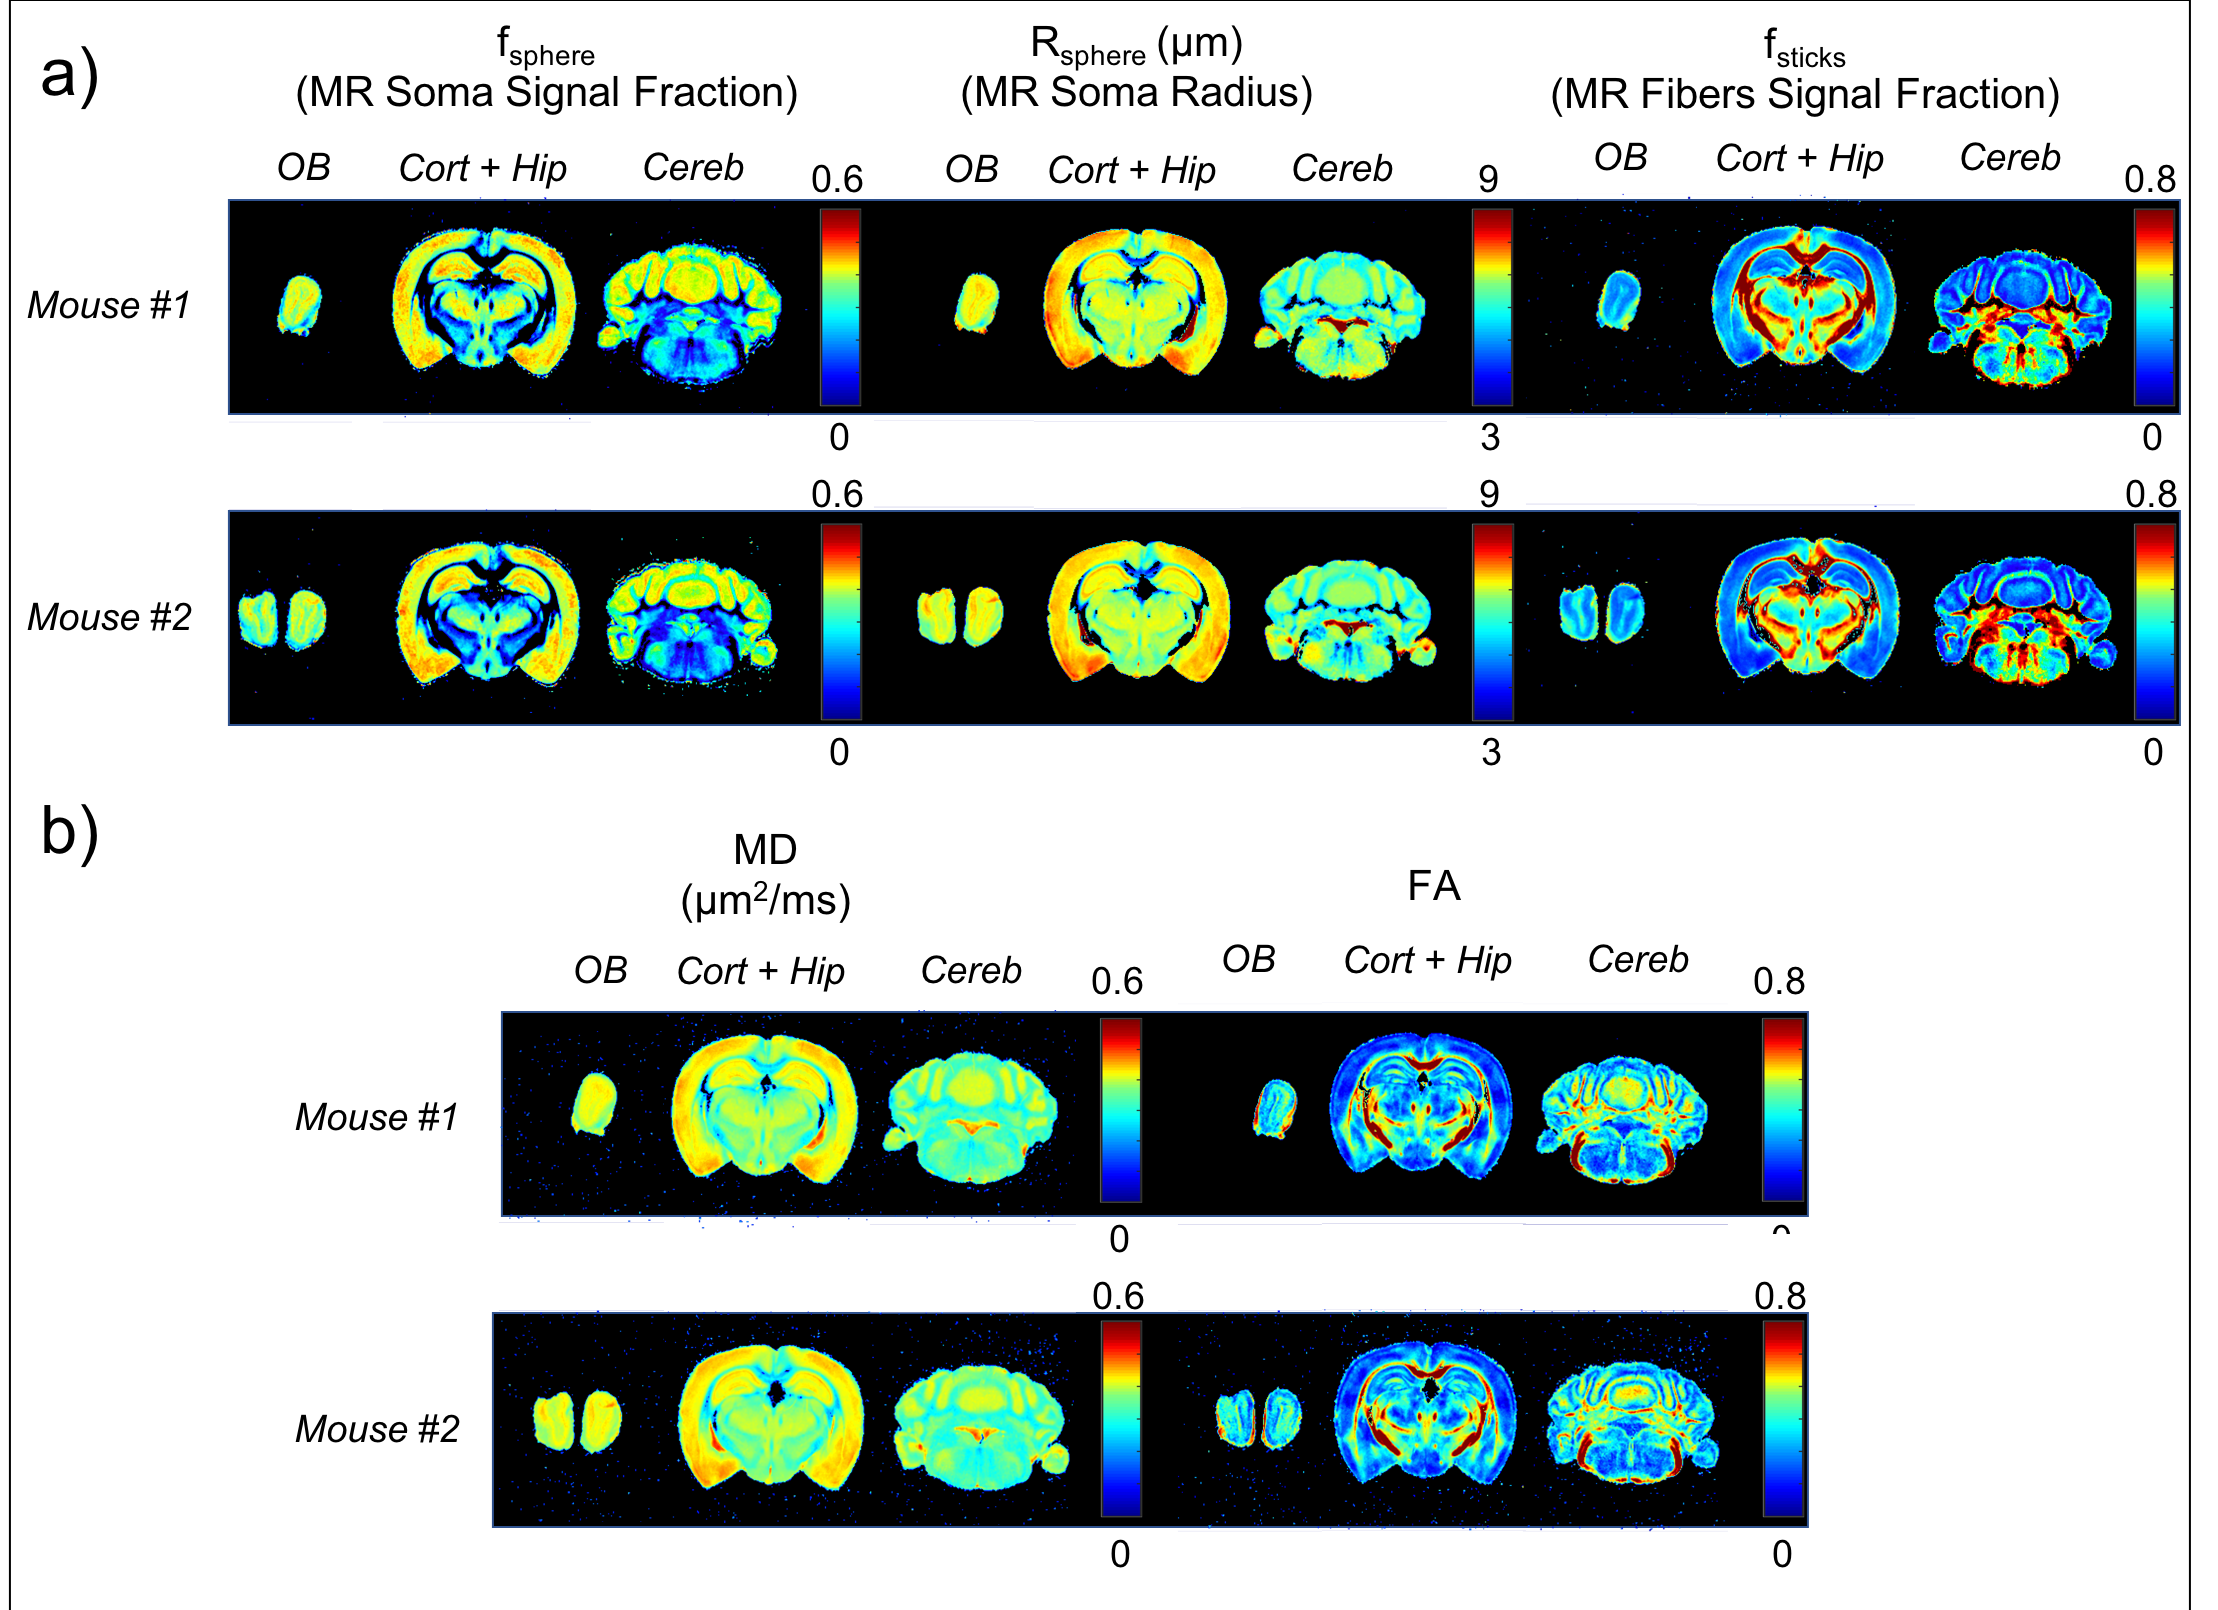
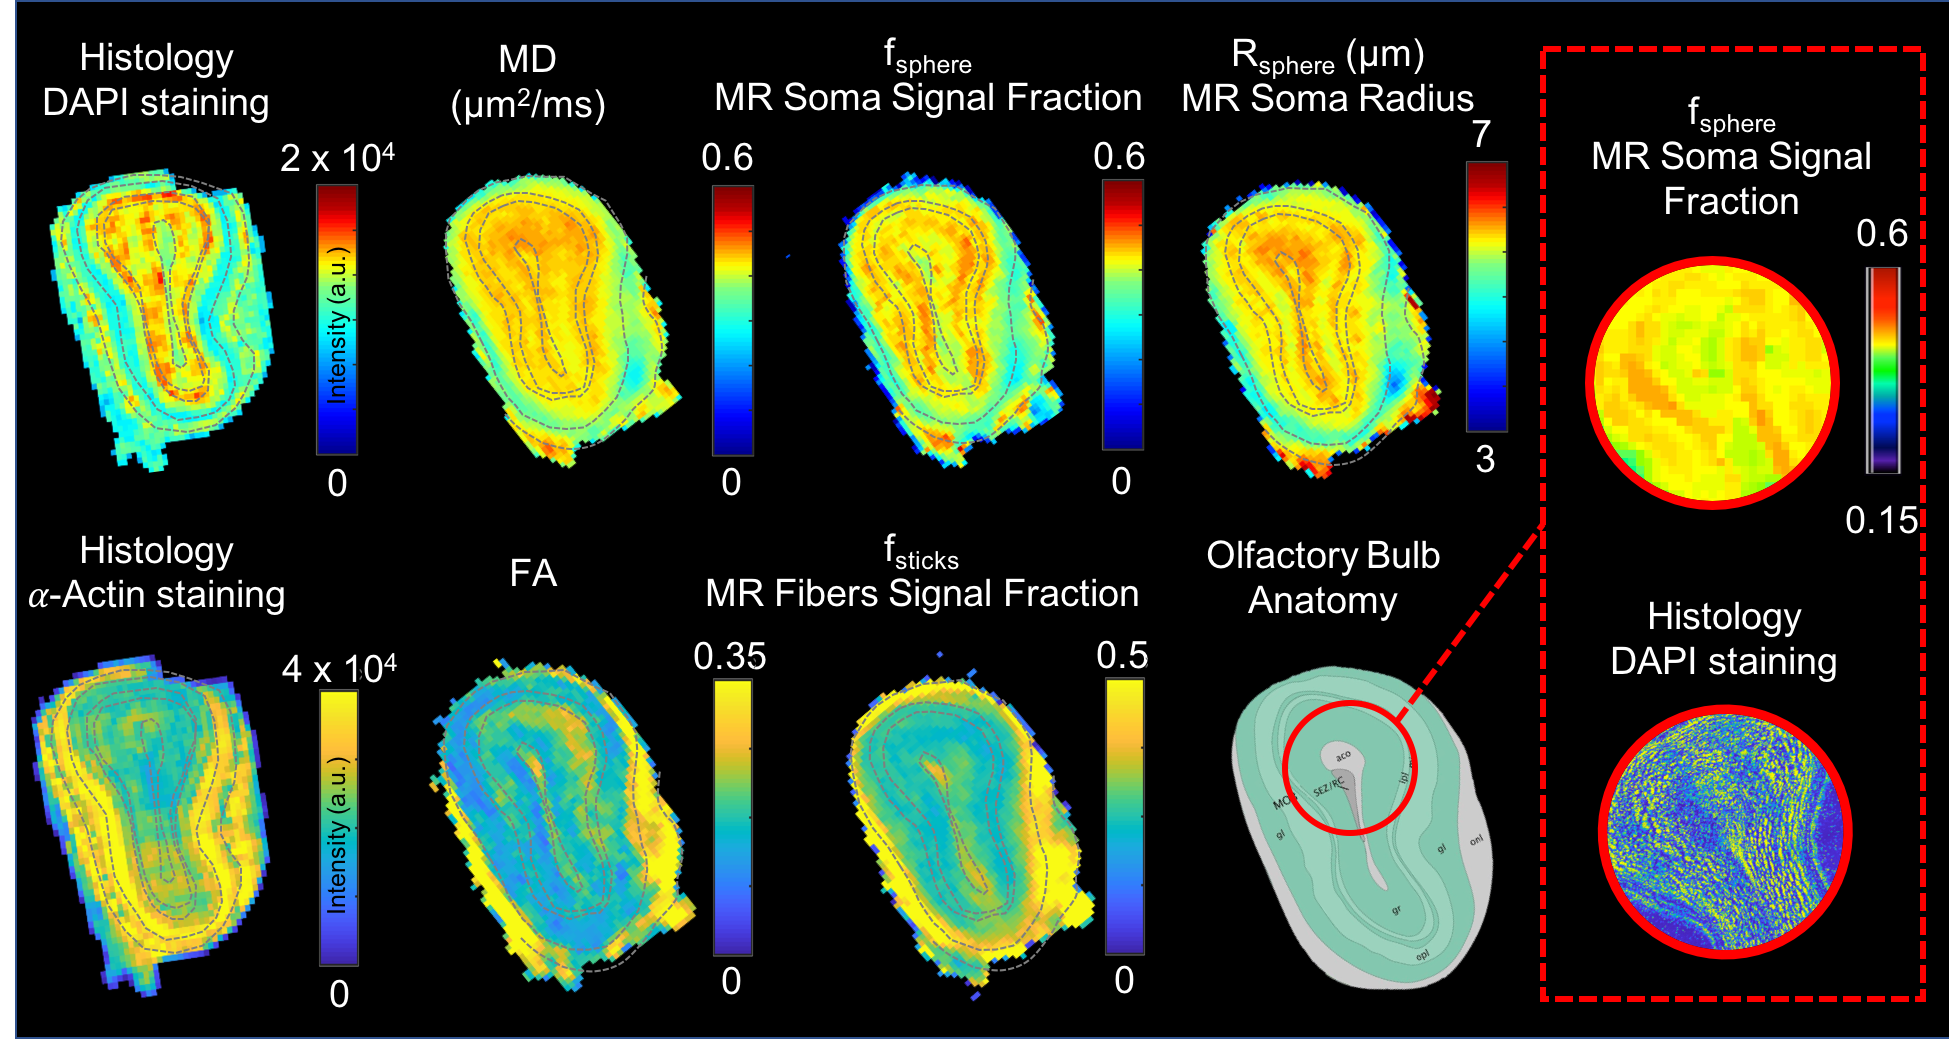
MR-measured features. Fig.2a shows fsphere, Rsphere and fsticks maps, for the two mouse brains. Note the exquisite differential contrasts between layers in the olfactory bulb, cortex, hippocampus and cerebellum. These contrasts are less expressed in DTI maps (Fig.2b).
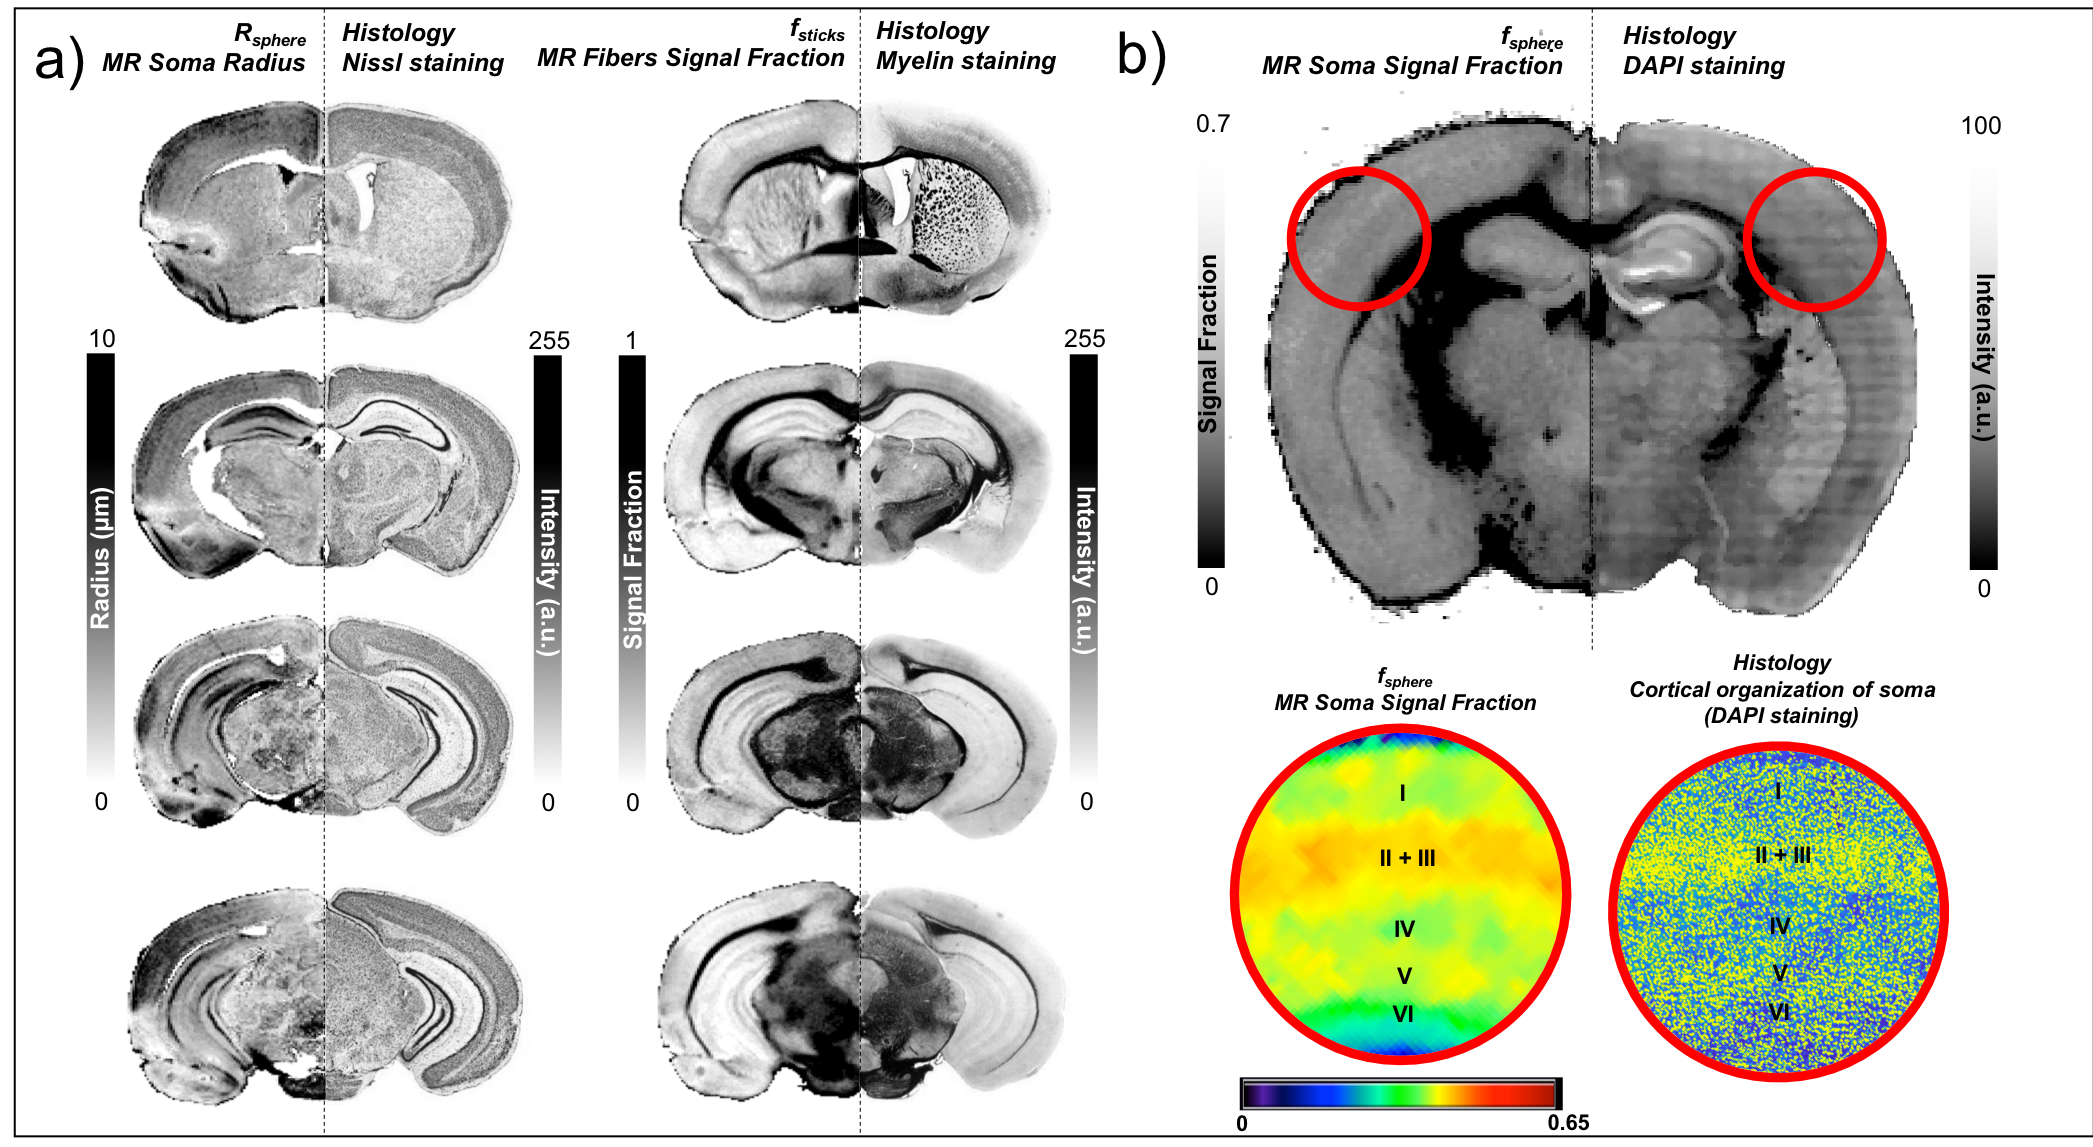
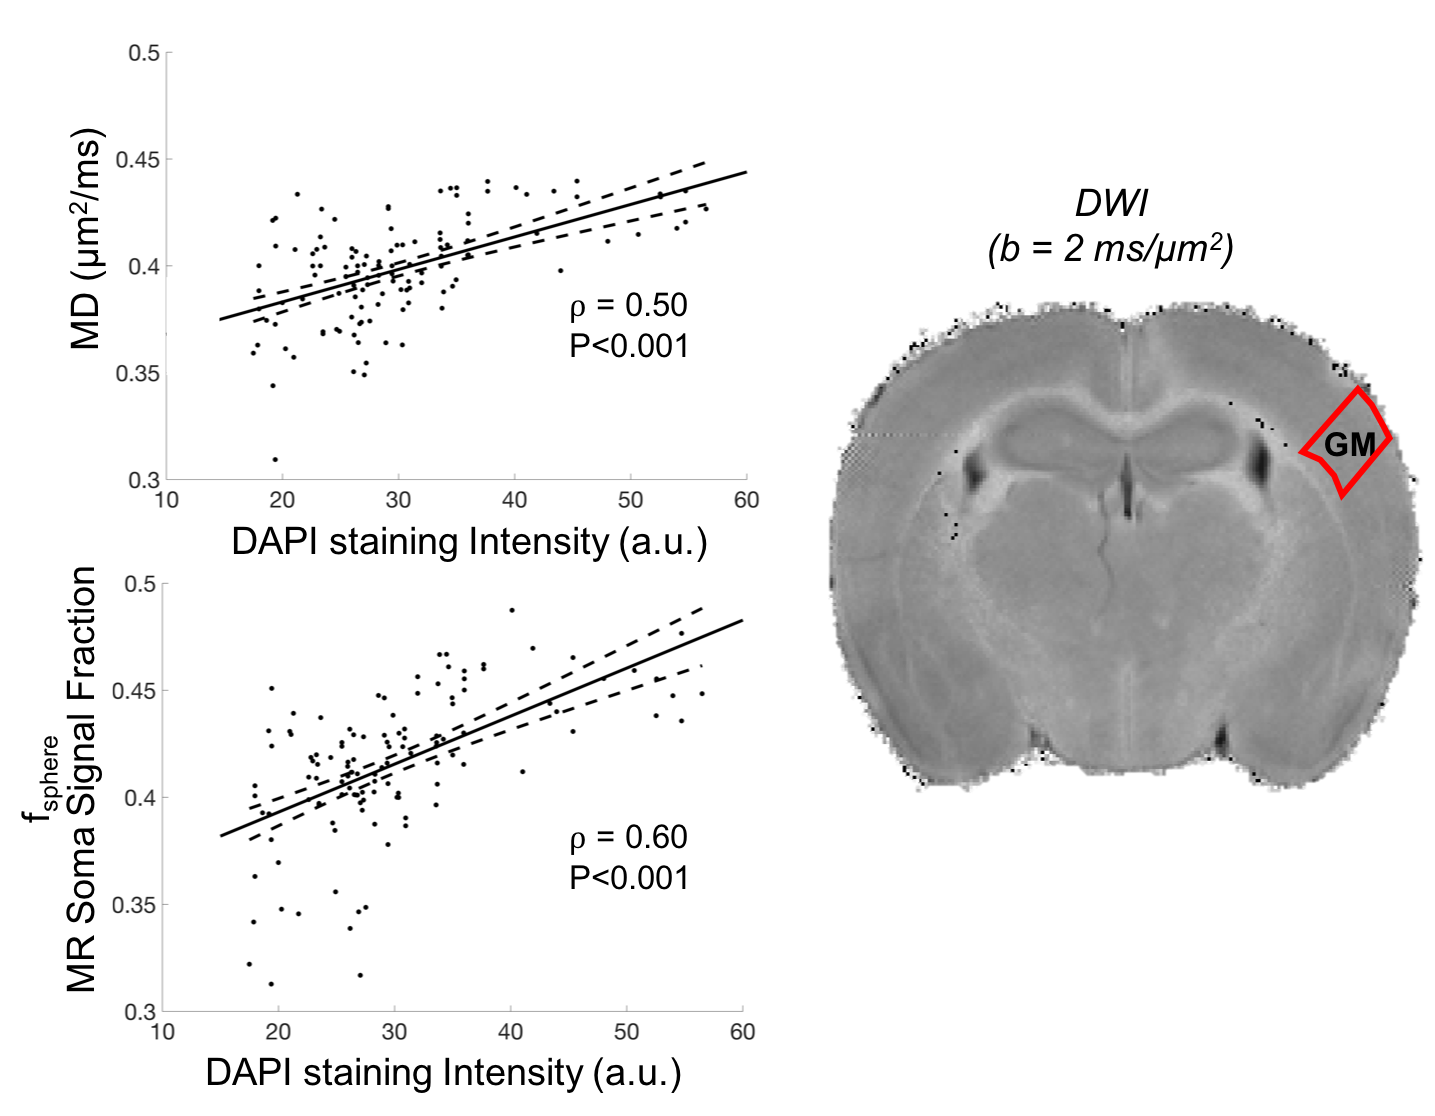
Comparison against histology. A direct comparison of the MR maps with histology of the same brain is shown in Fig.3b and 4. We observe very good correspondence between soma and cell-fibres spatial distributions from histology and fsphere, Rsphere and fsticks maps. Quantitative analysis in Fig.5 shows higher correlation of fsphere with DAPI staining than MD. Comparison against literature-derived histology15 is also provided in Fig.3a. Overall, the predicted brain’s composition in terms of MR-measured soma size/density corresponds very well with ground-truth histological measurements.
Discussion and Conclusion
Using high resolution DW-MRI data and histology, this work confirms the predictions of numerical simulation6,7(Fig.1), and validate the source of new contrasts specifically related to soma size/density5 (Fig.3-5). These are dissimilar to the simple tensor analyses (Fig.2-5), and therefore represent new complementary information on the brain.
Future work will investigate possible bias on parameters estimates due to cross-correlation and degeneracy16 as well as multi-compartmental T1/T2 effects17, cell-fibres curvature18, branching19 and exchange20. However, the present suggests that these novel contrasts in soma size/density may provide a new set of biomarkers of potential great value for biomedical applications and pure neuroscience.
Acknowledgements
This work was supported by EPSRC (EP/G007748, EP/I027084/01, EP/L022680/1, EP/M020533/1, N018702), EPSRC EP/M507970/1 and European Research Council (ERC) under the European Union’s Horizon 2020 research and innovation programme (Starting Grant, agreement No. 679058).References
1. Novikov D S, Kiselev V G, Jespersen, S N. On modeling. Magn. Reson. Med., 79(6), 3172-3193.
2. Alexander D C, Dyrby T B, Nilsson M, et al. Imaging brain microstructure with diffusion MRI: practicality and applications.NMR Biomed. 2017, e3841.
3. Jelescu I O, Budde M D. Design and validation of diffusion MRI models of white matter.Front Phys 2017, 5, 61.
4. Fieremans E, Lee H H. Physical and numerical phantoms for the validation of brain microstructural MRI: A cookbook. Neuroimage 2018, 182, 39-61.
5. Palombo M, Shemesh N, Ianus A, et al., Abundance of cell bodies can explain the stick model’s failure to describe high b-value diffusion signal in grey matter. Proc. Int. Soc. Magn. Reson. Med. 2018, #1096.
6. Palombo, M., Alexander, D. C., Zhang, H. A generative model of realistic brain cells with application to numerical simulation of diffusion-weighted MR signal. Neuroimage under review 2018, arXiv preprint arXiv:1806.07125.
7. Palombo, M, Shemesh N, Ianus A, et al., A compartment based model for non-invasive cell body imaging by diffusion MRI. Proc. Int. Soc. Magn. Reson. Med. 2018, #0892.
8. Cook P A, Bai Y, Nedjati-Gilani S K K S, et al. Camino: open-source diffusion-MRI reconstruction and processing. In 14th scientific meeting of the international society for magnetic resonance in medicine 2004 (Vol. 2759). Seattle WA, USA.
9. Veraart J, Fieremans E, Novikov D S. On the scaling behavior of water diffusion in human brain white matter. Neuroimage accepted 2018, DOI:10.1016/j.neuroimage.2018.09.075.
10. Yang D M, Huettner J E, Bretthorst G L, et al. Intracellular water preexchange lifetime in neurons and astrocytes. Magn. Reson. Med. 2018, 79(3), 1616-1627.
11. Nunes D, Cruz T L, Jespersen S N, et al. Mapping axonal density and average diameter using non-monotonic time-dependent gradient-echo MRI. J. Magn. Reson. 2017, 277, 117-130.
12. Veraart, J., et al. Denoising of diffusion MRI using random matrix theory. Neuroimage 2016, 142, 394-406.
13. Kellner E, Dhital B, Kiselev V G, et al. Gibbs‐ringing artifact removal based on local subvoxel‐shifts. Magn. Reson. Med. 2016, 76(5), 1574-1581.
14. https://fsl.fmrib.ox.ac.uk/fsl
15. BrainMaps: An Interactive Multiresolution Brain Atlas; http://brainmaps.org
16. Jelescu I O, Veraart J, Fieremans E, et al. Degeneracy in model parameter estimation for multi‐compartmental diffusion in neuronal tissue. NMR Biomed. 2016, 29(1), 33-47.
17. Veraart J, Novikov D S, Fieremans E. TE dependent Diffusion Imaging (TEdDI) distinguishes between compartmental T2 relaxation times. Neuroimage 2018, 182, 360-369.
18. Özarslan E, Yolcu C, Herberthson M, et al. Influence of the size and curvedness of neural projections on the orientationally averaged diffusion MR signal. Frontiers in physics 2018, 6, 17.
19. Palombo M, Ligneul C, Najac C, et al. New paradigm to assess brain cell morphology by diffusion-weighted MR spectroscopy in vivo. PNAS 2016; 113(24): 6671-6676.
20. Veraart J, Fieremans E, Rudrapatna U, et al., Biophysical modeling of the gray matter: does the “stick” model hold? Proc. Int. Soc. Magn. Reson. Med. 2018, #1094.
Figures