0647
Validating axonal directionality with 3D X-ray scattering1NYU School of Medicine, New York, NY, United States, 2ETH Zurich, Zurich, Switzerland, 3Paul Scherrer Institute, Villigen PSI, Switzerland, 4Brookhaven National Laboratory, Upton, NY, United States, 5Johns Hopkins Medicine, Baltimore, MD, United States
Synopsis
Diffusion MRI (dMRI) is sensitive to neuronal alignment, yet its directional signal does not depend only on the fiber orientation distribution function (fODF). Current validation methods for measuring and modeling the ODF have major limitations. Small-angle X-ray scattering (SAXS) produces directly structural signal, specific to myelin’s repetitive structural arrangement. We apply 3D scanning SAXS on mouse brain sections, retrieve fODFs and compare against dMRI-derived axonal directionality. We also apply SAXS-tensor tomography to mouse spinal cord, produce tractography maps and correlate dMRI- and SAXS-TT-derived fODF parameters. These demonstrate SAXS’s potential for providing novel microstructural insights and structurally validating dMRI-derived fODFs.
Introduction
In brain diffusion MRI (dMRI), the anisotropic signal is
typically attributed to neuronal directionality, but is also affected by other factors1 such as myelin density,
intra- and extra-axonal heterogeneities, cross-membrane water exchange etc. Hence,
structural validation is essential for dMRI. Previous validation studies were
based on either electron microscopy2,3, which only probes minuscule (sub-mm3)
volumes, light microscopy4-6, which provides intensity information not
easily translatable to 3D fODF, or brain clearing techniques7-9 whose limitations include heterogeneous tissue
deformation or restricted/heterogeneous antibody penetration. Small-angle X-ray
scattering (SAXS) produces directly structural signal, specific to myelin’s
repetitive structure10. The 3D scanning SAXS
(3DsSAXS) and SAXS tensor tomography (SAXS-TT) methods can provide 3D fiber
orientation in bone11-14 and mouse brain tissue15-17. Here, we apply 3DsSAXS and SAXS-TT to mouse brain
and spinal cord respectively, retrieve the fODFs, generate neural tracts, and
compare to the dMRI-derived ODFs.Methods
A 5-month-old C57BL/6 mouse brain was dMRI-scanned ex vivo (9.4T Bruker animal MRI scanner) with voxel size=75μm, 200 q-space points, b-value=1-4 ms/μm2. Two sections, 25 and 50μm thick, were cut using a vibratome and scanned using 3DsSAXS11 (cSAXS beamline, Paul Scherrer Institute, Switzerland) at 6 rotation angles, with voxel size=25 and 50μm, Ephoton=12.4KeV. The cervical spinal cord from a 50-day-old Rag2-/- mouse was dMRI-scanned (7T Bruker animal MRI scanner), with voxel size=100μm, 160 q-space points, b-value=2-20 ms/μm2. The sample was SAXS-TT-scanned (LiX beamline, Brookhaven National Laboratory) with voxel size=100μm, Ephoton=15.7KeV, 100 projections.
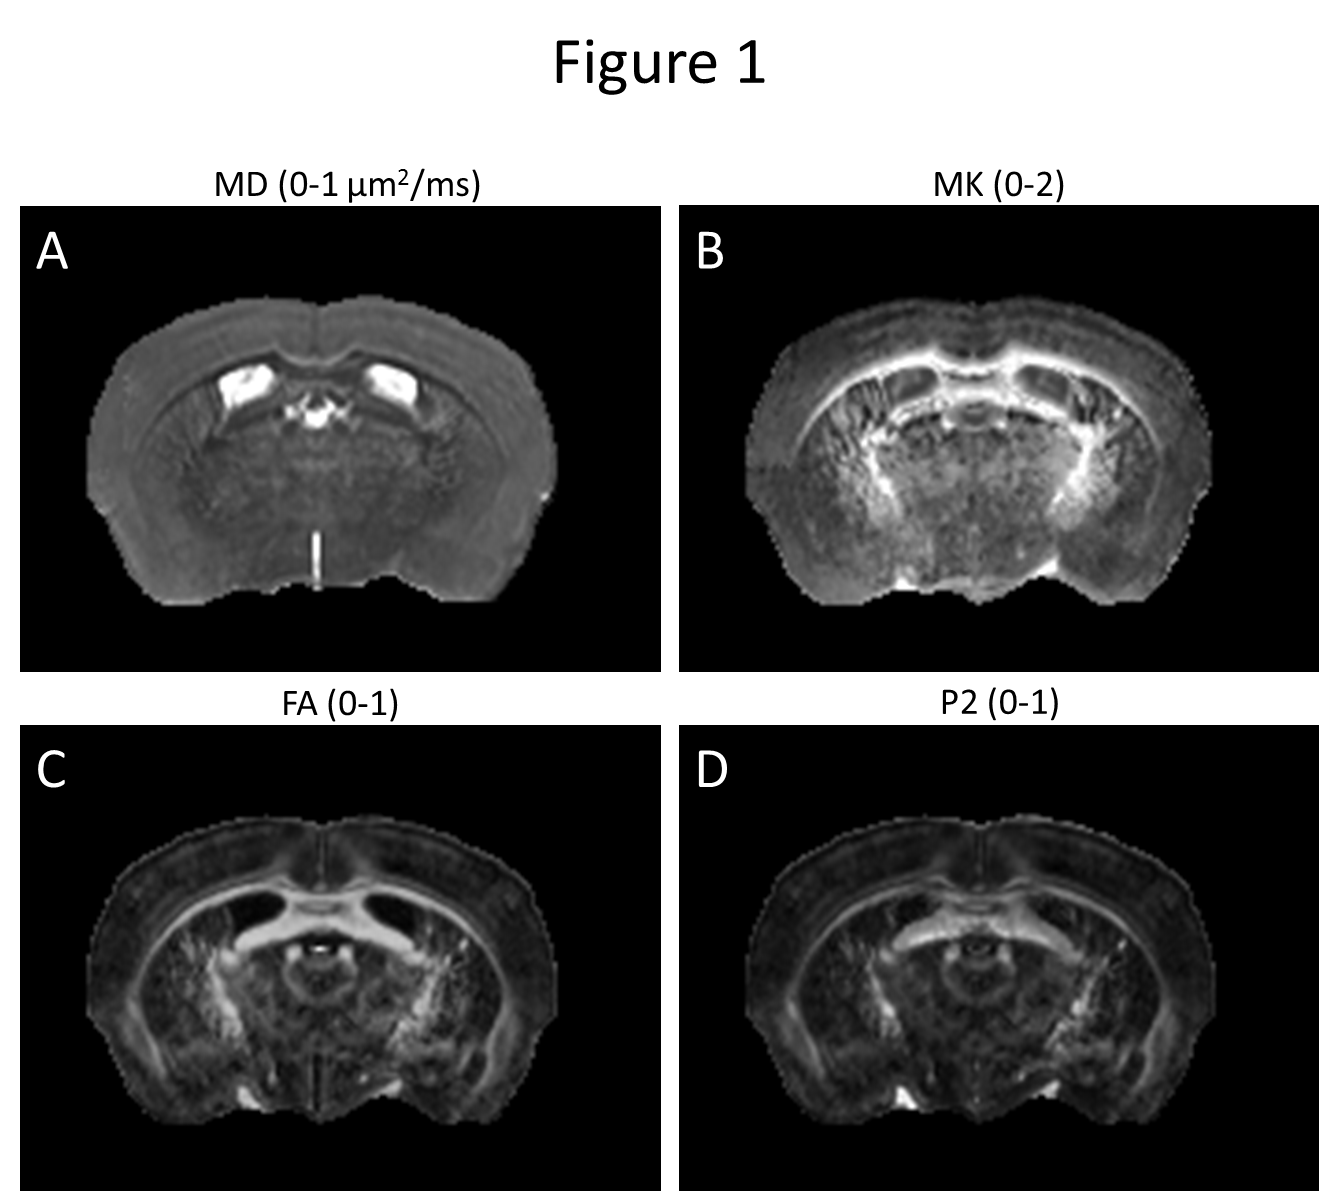
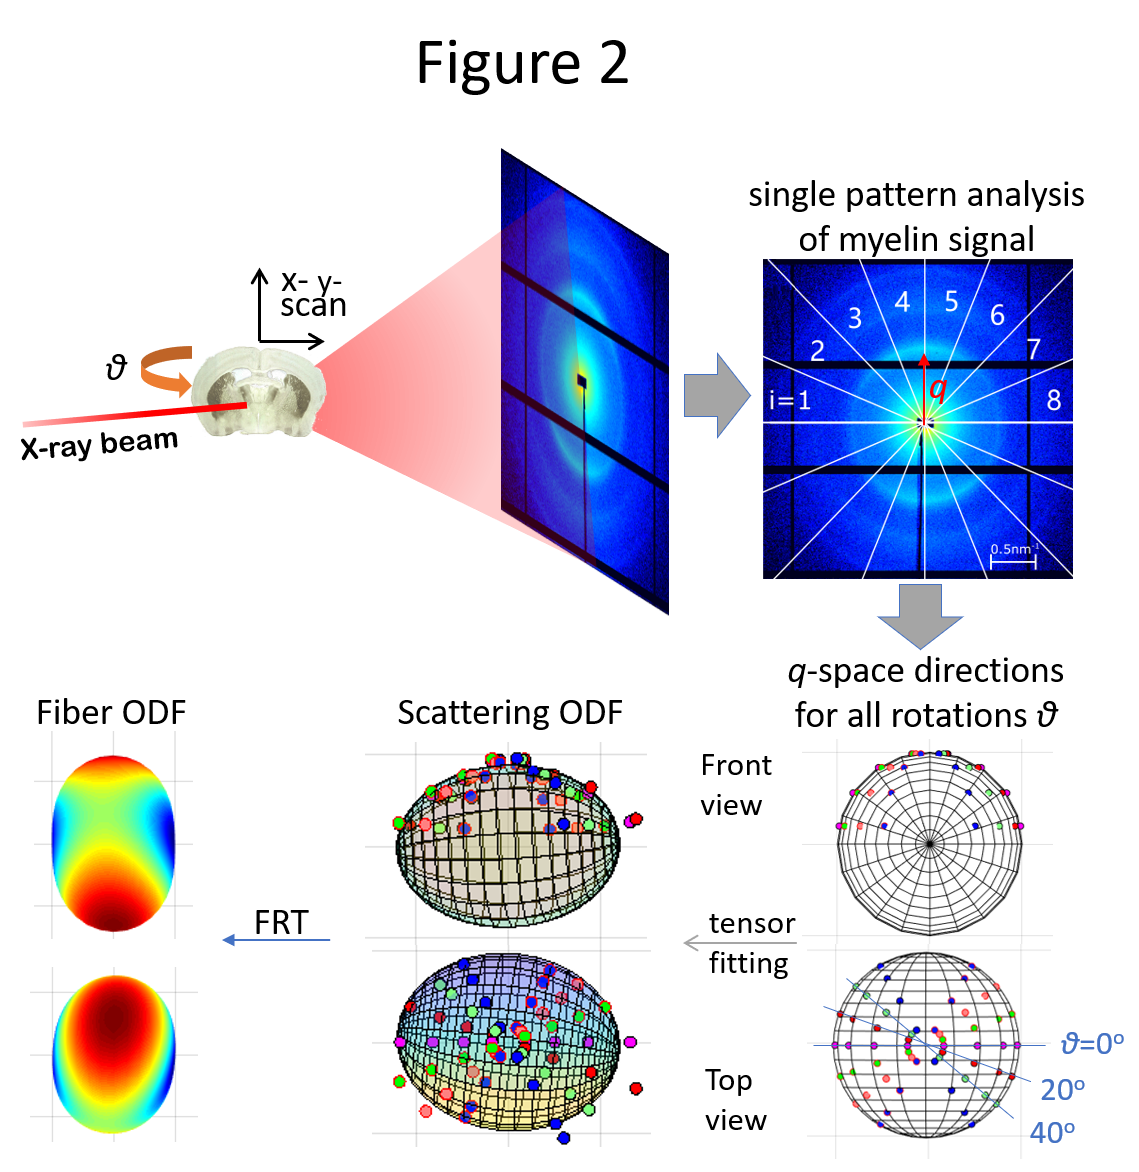
Whole-brain and spinal cord dMRI data were processed using DESIGNER18-20, resulting in diffusion and kurtosis tensors and corresponding parametric maps, Fig. 1. For the 3DsSAXS brain sections, the rank-2 scattering tensor17 was used to derive the scattering ODF, which was converted to the fODF using the FRT, Fig. 2. Similarly, for the spinal cord SAXS-TT data, IRTT17 was used to derive the scattering ODF rank-2 tensors, which were FRT-transformed to fODFs. For probabilistic tractography21,22, a synthetic dMRI dataset was generated from SAXS-TT data based on each voxel’s fODF.
The dMRI- and SAXS-derived rank-2 tensors were used to determine the main fiber direction. P2 invariants were calculated as Euclidean norms of the tensors’ 2nd order spherical harmonics representation23. dMRI data were affine-registered24,25 to SAXS brain sections and spinal cord, with fractional anisotropy (FA) of dMRI and SAXS tensors as contrast.
Results
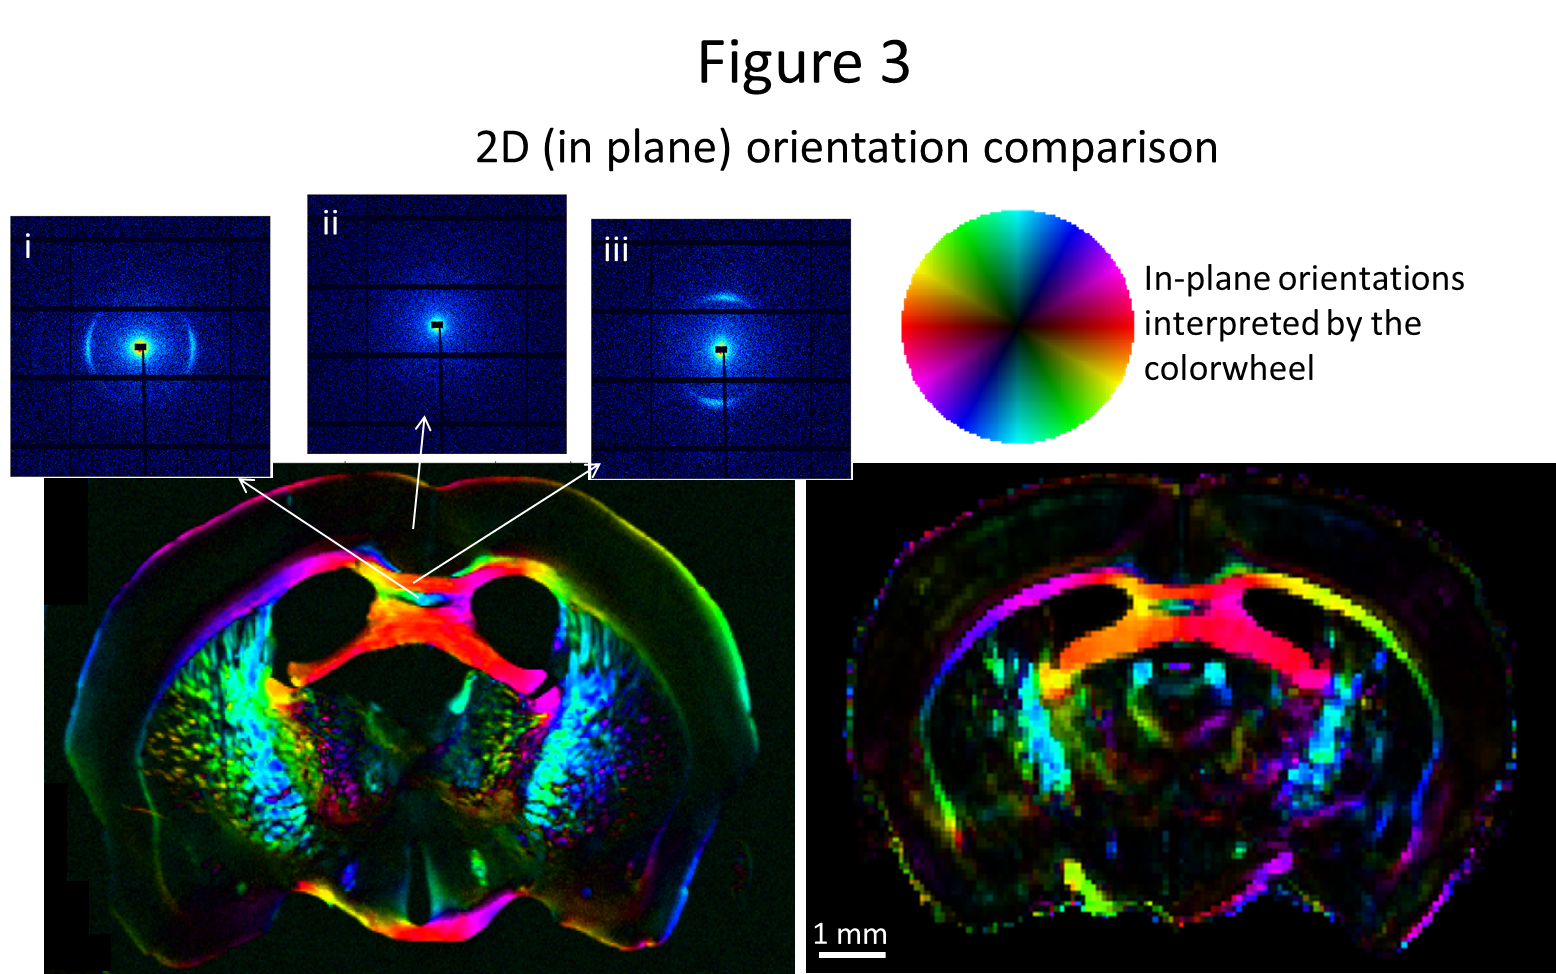
For the 25μm brain section, the 2D (in-plane) fiber directionality from SAXS and
dMRI are compared, Fig. 3, showing good agreement. Small differences, e.g.
anatomical discrepancies, can be attributed to sectioning artifacts or
imperfect registration, and others, e.g. the low X-ray scattering signal in the
myelin-poor cortex, to the different signal-producing mechanisms. For the
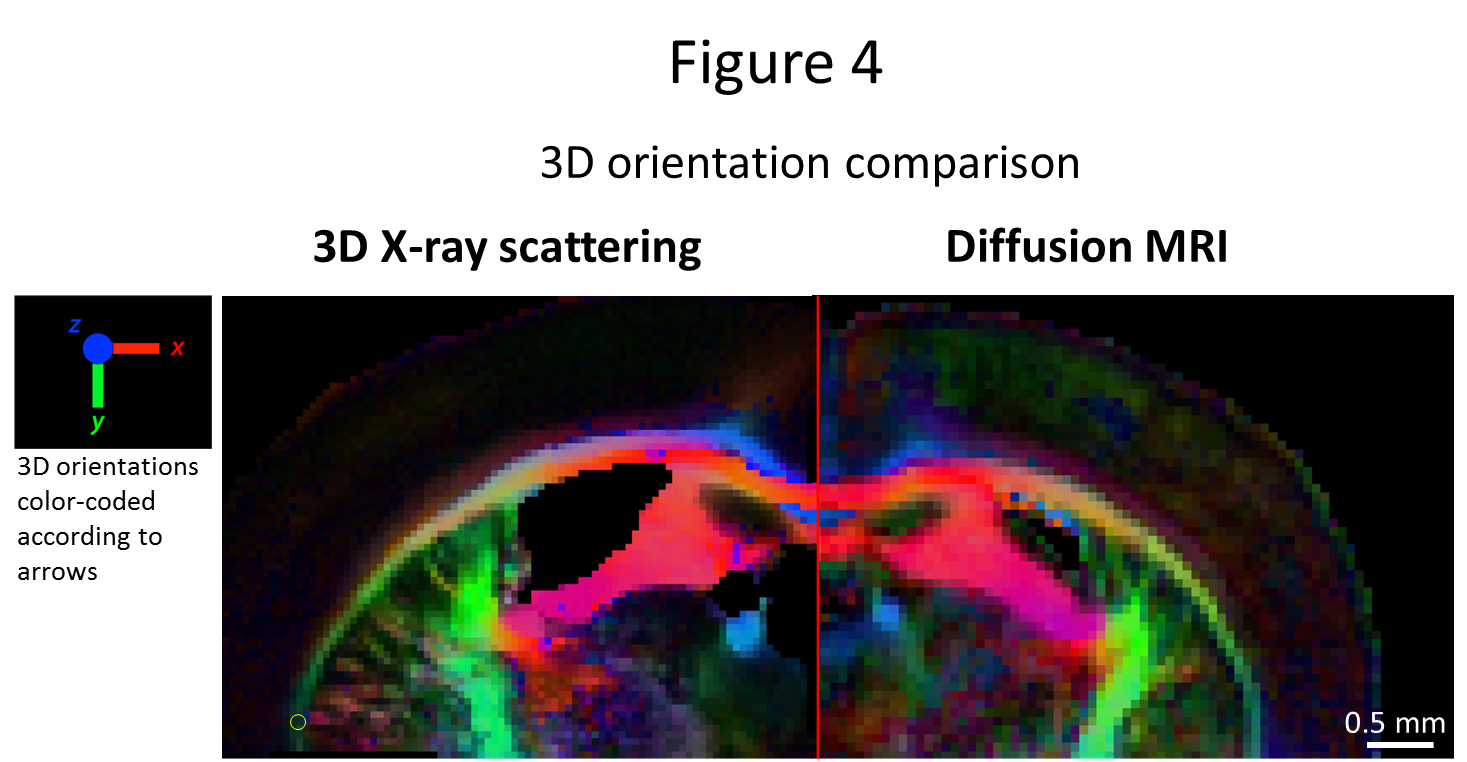
50um-thick section, the retrieved 3D orientation from both methods was compared,
Fig. 4. Again, directional correspondence is very good, with differences
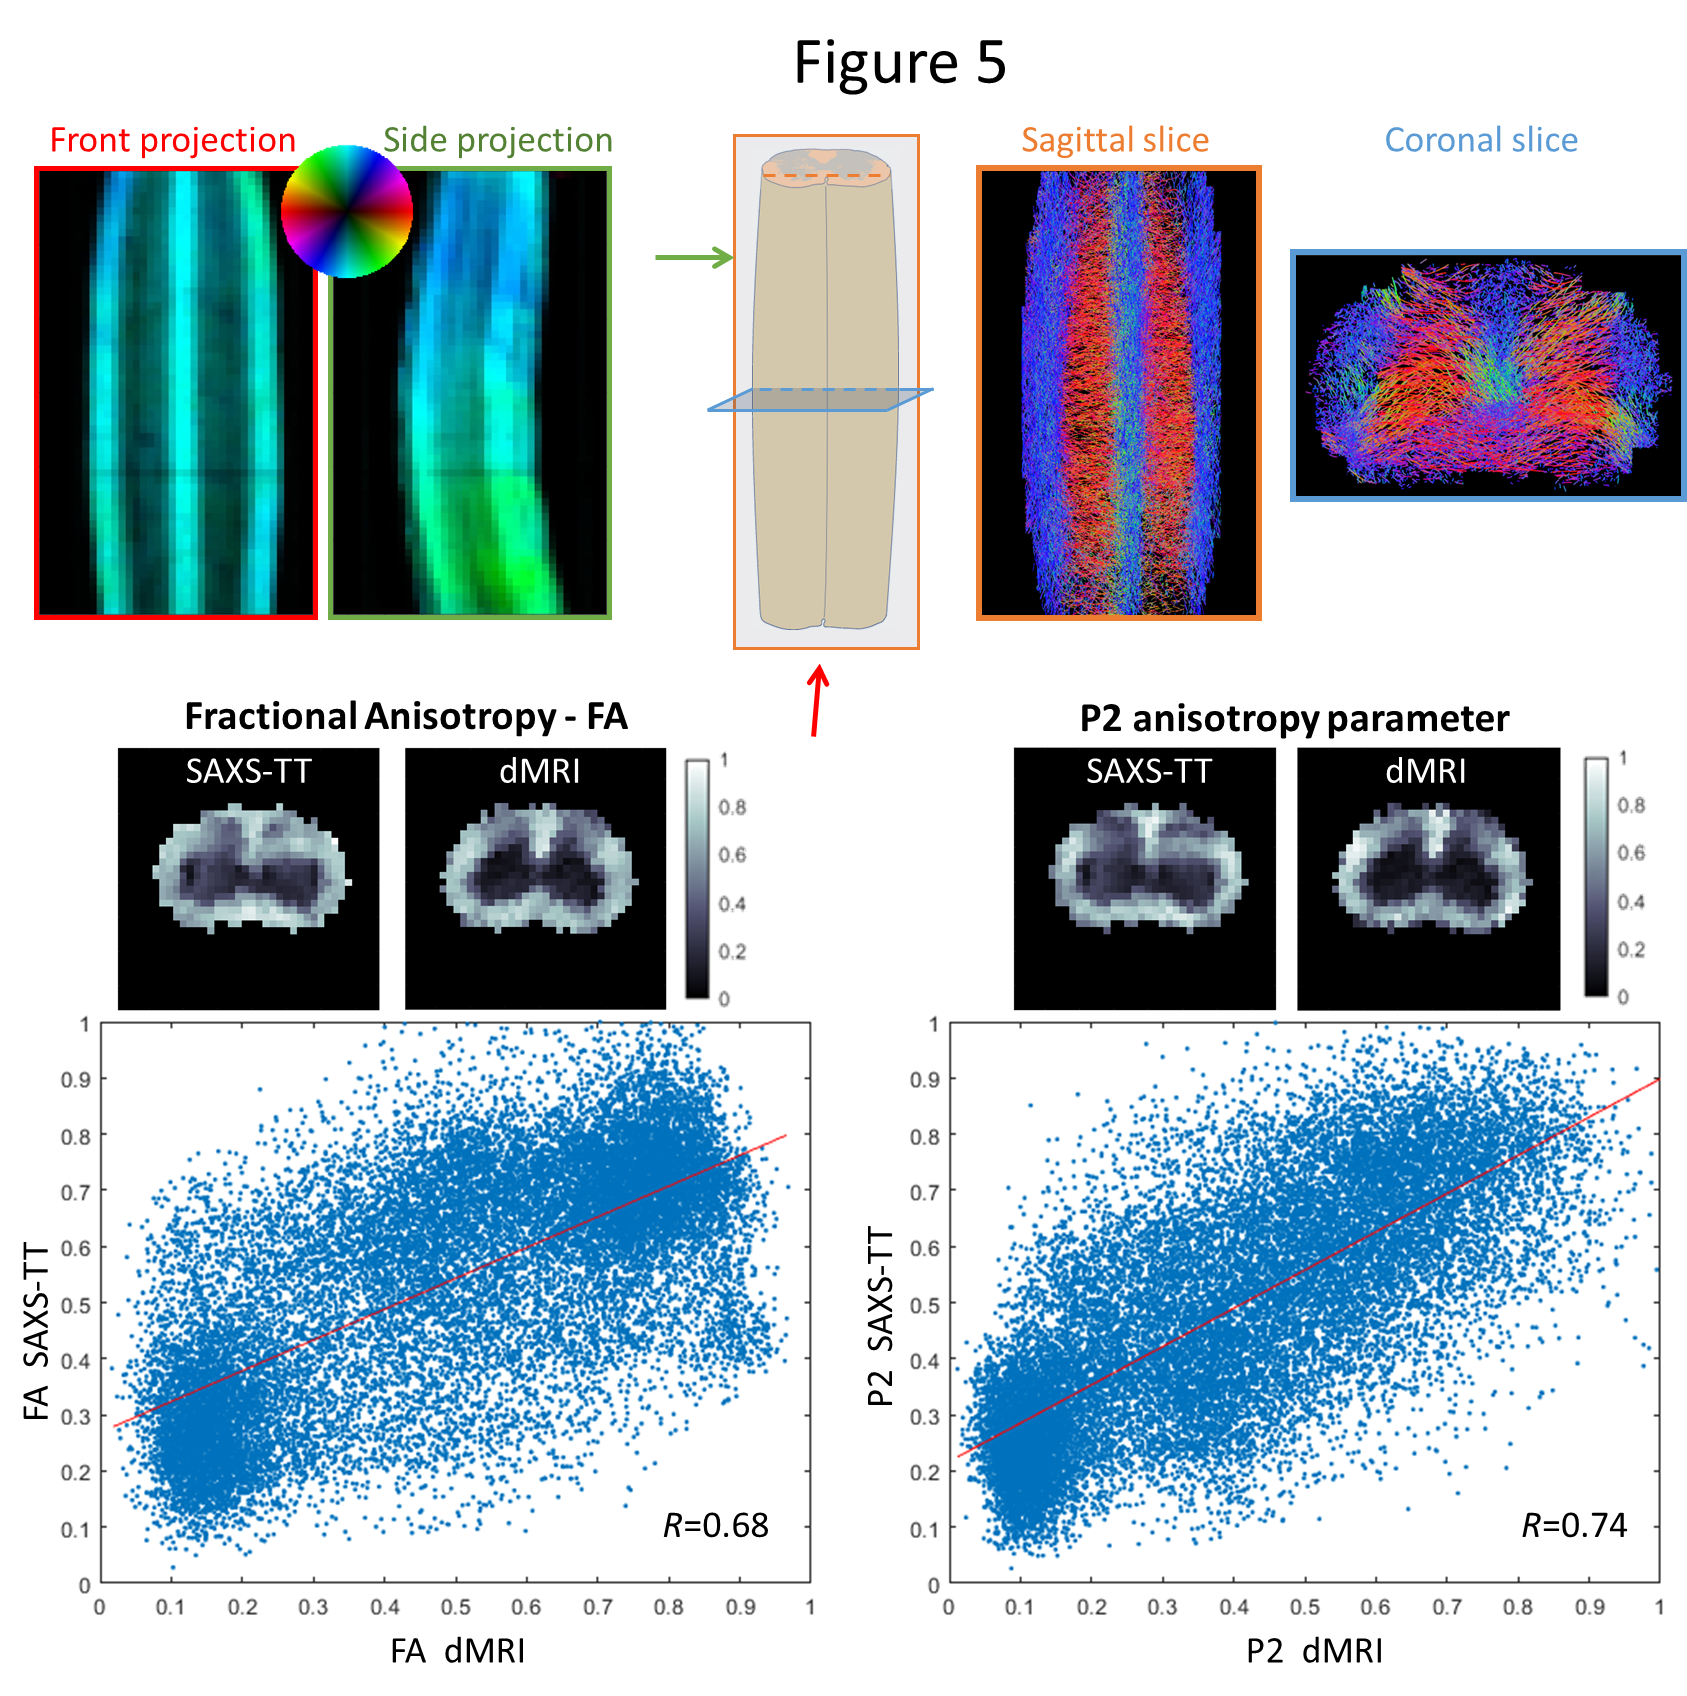
attributed to the aforementioned factors. SAXS-TT-derived spinal cord neural
tracts, Fig. 5 top right, agree with known anatomy tracts. The correlation coefficient
between FA from both methods is 0.68, whereas the correlation coefficient for
P2 is 0.74, Fig. 5 bottom.Discussion
X-ray scattering and diffusion MRI are two
fundamentally different methods, based on the phenomena of photon scattering
and water diffusion respectively. However, their signal is based on events
taking place at the nano-/micro-structural level, orders of magnitude below
their nominal resolution, making both sensitive to the axonal fiber
directionality. Here, we extract the fODF from the scattering ODF using a rank-2
tensor17, Fig. 2, and compare its
main direction and ODF parameters to the corresponding dMRI outputs. Comparison
of axonal directionality in 2 mouse brain sections to the corresponding
orientation from the MRI-derived diffusion tensor shows excellent agreement
both in 2D (Fig. 3) and in 3D (Fig. 4). We also apply SAXS-TT in a spinal cord
sample, and generate anatomy-realistic tractograms from SAXS-TT data, Fig. 5
top right. Finally, we compare ODF parameters from both methods: whereas both
FA and P2 show high correlations, correlation coefficient of P2 is higher than
that of FA, Fig. 5 bottom. Since the anisotropic signal is generated through very different
physical phenomena, the respective method-related isotropic component is
incorporated in the calculation of fractional anisotropy but not in P2.Conclusions
We have derived fODFs using X-ray scattering methods
on mouse brain and spinal cord tissue, and compared axonal orientations and ODF
parameters with dMRI. Given SAXS’s ability to produce myelin-related signal, 3D
fODFs, conduct tomographic investigations, and also on human brain tissue16, 3DsSAXS and SAXS-TT may
be broadly applicable not only for validating dMRI orientation or
microstructural models and corresponding parameters, but also for providing
novel microstructural insights as orthogonal, directly structural methods.Acknowledgements
Research was partially supported by Swiss National Science Foundation (SNSF) grant numbers P2EZP3_168920, 200021_178788, and by the National Institutes of Health (NIH) award number R01 NS088040. The Animal Imaging Center of ETH Zurich and the Preclinical Imaging Core of NYU of Medicine are acknowledged for enabling the MRI studies.References
1. Beaulieu, C., The basis of anisotropic water diffusion in the nervous system–a technical review. NMR in Biomedicine, 2002. 15(7‐8): p. 435-455.
2. Jespersen, S.N., et al., Neurite density from magnetic resonance diffusion measurements at ultrahigh field: comparison with light microscopy and electron microscopy. Neuroimage, 2010. 49(1): p. 205-16.
3. Jelescu, I.O., et al., In vivo quantification of demyelination and recovery using compartment-specific diffusion MRI metrics validated by electron microscopy. NeuroImage, 2016.
4. Budde, M.D. and Annese, J., Quantification of anisotropy and fiber orientation in human brain histological sections. Frontiers in Integrative Neuroscience, 2013. 7: p. 3.
5. Mollink, J., et al., Evaluating fibre orientation dispersion in white matter: Comparison of diffusion MRI, histology and polarized light imaging. NeuroImage, 2017. 157(Supplement C): p. 561-574.
6. Schilling, K.G., et al., Histological validation of diffusion MRI fiber orientation distributions and dispersion. NeuroImage, 2018. 165: p. 200-221.
7. Leuze, C., et al., The separate effects of lipids and proteins on brain MRI contrast revealed through tissue clearing. Neuroimage, 2017. 156: p. 412-422.
8. Morawski, M., et al., Developing 3D microscopy with CLARITY on human brain tissue: Towards a tool for informing and validating MRI-based histology. Neuroimage, 2018. 182: p. 417-428.
9. Stolp, H.B., et al., Voxel-wise comparisons of cellular microstructure and diffusion-MRI in mouse hippocampus using 3D Bridging of Optically-clear histology with Neuroimaging Data (3D-BOND). Scientific Reports, 2018. 8(1): p. 4011.
10. Jensen, T.H., et al., Molecular X-ray computed tomography of myelin in a rat brain. NeuroImage, 2011. 57(1): p. 124-129.
11. Georgiadis, M., et al., 3D scanning SAXS: A novel method for the assessment of bone ultrastructure orientation. Bone, 2015. 71(0): p. 42-52.
12. Liebi, M., et al., Nanostructure surveys of macroscopic specimens by small-angle scattering tensor tomography. Nature, 2015. 527(7578): p. 349-352.
13. Georgiadis, M., et al., Ultrastructure organization of human trabeculae assessed by 3D sSAXS and relation to bone microarchitecture. PLoS One, 2016. 11(8): p. e0159838.
14. Liebi, M., et al., Small-angle X-ray scattering tensor tomography: model of the three-dimensional reciprocal-space map, reconstruction algorithm and angular sampling requirements. Acta Crystallogr A Found Adv, 2018. 74(Pt 1): p. 12-24.
15. Georgiadis, M., et al. MRI vs. X-ray scattering: comparative study of myelin distribution, fiber direction and white matter tracts in mouse brain. in ISMRM 25th Annual Meeting. 2017. Hawaii, USA.
16. Georgiadis, M., et al. Probing microstructure with different tomographic methods: Comparing dMRI and X-ray scattering-derived parameters in mouse and human brains. in ISMRM 26th Annual Meeting. 2018. Paris, France.
17. Gao, Z., et al., High-speed tensor tomography: Iterative Reconstruction Tensor Tomography (IRTT) algorithm. Acta Crystallographica Section A: Foundations and Advances, under review.
18. Veraart, J., et al., Denoising of diffusion MRI using random matrix theory. NeuroImage, 2016. 142(Supplement C): p. 394-406.
19. Ades-Aron, B., et al., Evaluation of the accuracy and precision of the diffusion parameter EStImation with Gibbs and NoisE removal pipeline. Neuroimage, 2018. 183: p. 532-543.
20. Veraart, J., Fieremans, E., and Novikov, D.S., Diffusion MRI noise mapping using random matrix theory. Magn Reson Med, 2016. 76(5): p. 1582-1593.
21. https://mrtrix.readthedocs.io/en/latest/reference/commands/tckgen.html.
22. Tournier, J.D., Calamante, F., and Connelly, A. Improved probabilistic streamlines tractography by 2nd order integration over fibre orientation distributions. in Proceedings of the international society for magnetic resonance in medicine. 2010.
23. Novikov, D.S., et al., Rotationally-invariant mapping of scalar and orientational metrics of neuronal microstructure with diffusion MRI. NeuroImage, 2018. 174: p. 518-538.
24. Jenkinson, M., et al., Improved optimization for the robust and accurate linear registration and motion correction of brain images. Neuroimage, 2002. 17(2): p. 825-41.
25. https://fsl.fmrib.ox.ac.uk/fsl/fslwiki/FLIRT.
Figures