0646
Pancreatic T1 Mapping and Extracellular Volume Fraction in Patients with Impaired Glucose Tolerance1Radiology, Gifu University, Gifu, Japan, 2Radiology, Kyoto Prefectural University of Medicine, Kyoto, Japan, 3Philips Healthcare, Tokyo, Japan
Synopsis
The presence of pancreatic fibrosis is a representative feature of the pancreas in patients with impaired glucose tolerance (IGT). The extracellular volume fraction (ECV) is reported to be associated with cardiac and hepatic fibrosis. In this study, we evaluated the feasibility of the ECV of the pancreas based on T1 mapping for the assessment of HbA1c values. Our results showed that increased ECV of the pancreas was significantly correlated with HbA1c values, so the ECV of the pancreas could serve as a potential imaging biomarker for the assessment of patients with IGT.
Purpose
To evaluate the feasibility of pancreatic T1 mapping and extracellular volume fraction (ECV) for assessing patients with impaired glucose tolerance (IGT).Materials and Methods
This prospective study was approved by our institutional review board and written informed consent was obtained. Thirty-five patients with suspected pancreatic disease underwent contrast-enhanced magnetic resonance (MR) imaging. The T1 values were calculated on the T1 map obtained in pre-contrast and post-contrast by the Look-Locker sequence with the following scan parameters: 3D T1-TFE with saturation recovery; TR/TE, 2.8/1.34 msec; voxel size, 1.88 × 1.88 × 5 mm; FA, 10; slice number, 10-slices; shot interval, 2,500 msec; parallel imaging factor, 3.5; acquisition time, two sets of 10 sec with breath holding. The fat fraction (FF) of the pancreas was also calculated on the FF map obtained by proton density pulse sequence (mDIXON Quant).
The T1 values were measured in pancreatic head, body, and tail using region-of-interest (ROI) on pre- and post-contrast images, carefully devoid of main pancreatic ducts, focal lesions, and artifacts, and then averaged. The T1 value of the abdominal aorta was also measured on pre- and post-contrast images. ECV was calculated by using the following equation: ECV = (1/T1 pancreas post-contrast – 1/T1 pancreas pre-contrast)/(1/T1 aorta post-contrast – 1/T1 aorta pre-contrast) × (1– hematocrit). The FF was measured in pancreatic head, body, and tail and then averaged. The anterior-posterior (AP) diameters at pancreatic head, body, and tail were measured. Patients’ laboratory and clinical data within two weeks of MR imaging were also recorded. Patients were classified into two groups according to American Diabetes Association criteria: HbA1c < 5.7% (Low value group), and HbA1c ≥ 5.7% (High value group).
The Mann-Whitney U and Fisher’s tests were conducted to evaluate differences in patients’ laboratory and clinical data, native T1 value, ECV, and AP diameters between two groups. Simple linear regression analysis was performed to evaluate the correlation between MR imaging measurements and HbA1c values. For significant parameters, we determined the optimal threshold on the basis of the highest area under the receiver operating characteristic (ROC) curve (AUC) that yielded the maximal sensitivity and specificity for the differentiation of Low and High value groups. A P value of less than 0.05 was considered to be significant.
Results
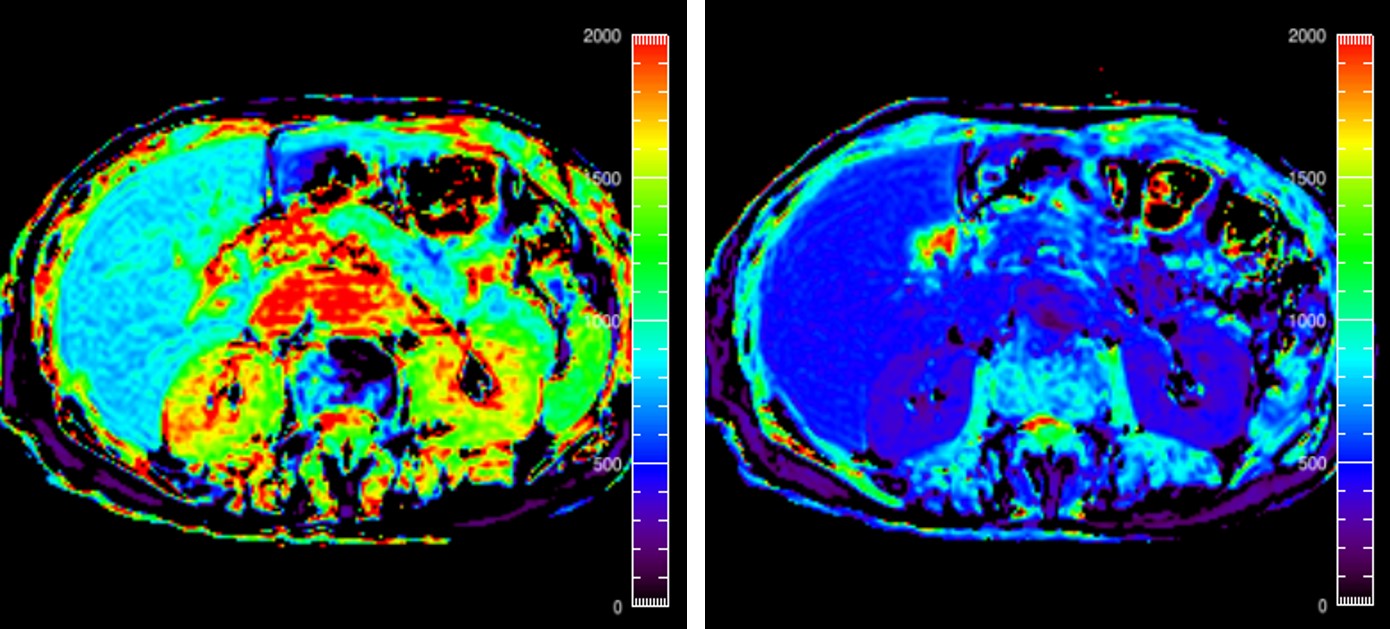
Among 35 patients, 24 were in Low value group and 11 were in High value group. The native T1 value was significantly greater in High value group than in Low value group (P = 0.0003) (Figure 1). The ECV was significantly greater in High value group than in Low value group (P < 0.0001) (Figures 2–4). The blood glucose (P = 0.011) and HbA1c (P < 0.0001) levels were significantly higher in High value group than in Low value group. There was no significant difference in the other patients’ laboratory and clinical data, FF and AP diameters (P = 0.18–0.90) (Table 1). Simple linear regression analysis showed moderate, positive correlation between the ECV and HbA1c values (r = 0.62, P < 0.001) (Figure 5). On the basis of the ROC analysis, the sensitivities, specificities, and AUCs for differentiating Low and High value groups were 100.0%, 95.8%, and 0.996 in the ECV, and 81.8%, 95.8%, and 0.890 in the native T1 value, when employing a cutoff value of 25.2% and 1023 msec, respectively. No significant difference was found in AUCs between the ECV and native T1 value (P = 0.10) (Figure 6).Discussion
n the present study, the ECV of the pancreas was significantly correlated with HbA1c values. Pancreatic fibrosis is a representative pancreatic feature in patients with IGT. We previously reported that reduced T1 signal intensity of the pancreas was significantly correlated with pancreatic fibrosis and HbA1c values 1. The reduced T1 signal intensity of the pancreas could be explained by the pancreatic fibrosis that replaced pancreatic acini-retaining pancreatic proteinaceous fluid.
Recently, some studies reported that the ECV based on T1 mapping is associated with cardiac and hepatic fibrosis 2, 3. The ECV might have following some advantages compared with T1 value: 1, a physiologically intuitive unit of measurement; 2, independent of field strength; and 3, suitable for follow-up investigations by using different imaging protocols. We believed that the deposition of extracellular matrix and fibrosis in the extracellular interstitial compartment results in an increased ECV.
In conclusion, we demonstrated the feasibility of the ECV of the pancreas based on T1 mapping for the assessment of the patients with IGT. Our results suggest that the ECV of the pancreas could serve as a potential imaging biomarker for the assessment of pancreatic fibrosis leading to IGT.
Acknowledgements
The authors of this manuscript declare no relationships with any companies whose products or services may be related to the subject matter of the article.References
1. Noda Y, Goshima S, Tanaka K, et al. Findings in pancreatic MRI associated with pancreatic fibrosis and HbA1c values. J Magn Reson Imaging 2016;43(3):680-7.
2. Flett AS, Hayward MP, Ashworth MT, et al. Equilibrium contrast cardiovascular magnetic resonance for the measurement of diffuse myocardial fibrosis: preliminary validation in humans. Circulation 2010;122(2):138-44.
3. Luetkens JA, Klein S, Traber F, et al. Quantification of Liver Fibrosis at T1 and T2 Mapping with Extracellular Volume Fraction MRI: Preclinical Results. Radiology 2018;288(3):748-54.
Figures