0643
Pancreatic perfusion modulation following glucose stimuli revealed by non-invasive Arterial Spin Labeling (ASL) MRI1Division of MRI research, Radiology, Beth Israel Deaconess Medical Center, Harvard Medical School, Boson, MA, United States
Synopsis
Being able to non-invasively monitor pancreatic perfusion changes is essential for its clinical translation, but it can also prove useful in the evaluation of endocrine disorders such as diabetes. While some perfusion modification following a glucose challenge was observed with PET, ASL has not yet succeeded. We propose here an investigation of pancreatic perfusion modulation following an oral glucose challenge with background-suppressed pCASL at 3T, highlighting perfusion modulation that could be linked to pancreatic endocrine function. Such paradigm could either serve as a tool for studying endocrine disorders or provide a glucose-enhanced scan that increases SNR for diagnostic purposes.
Introduction
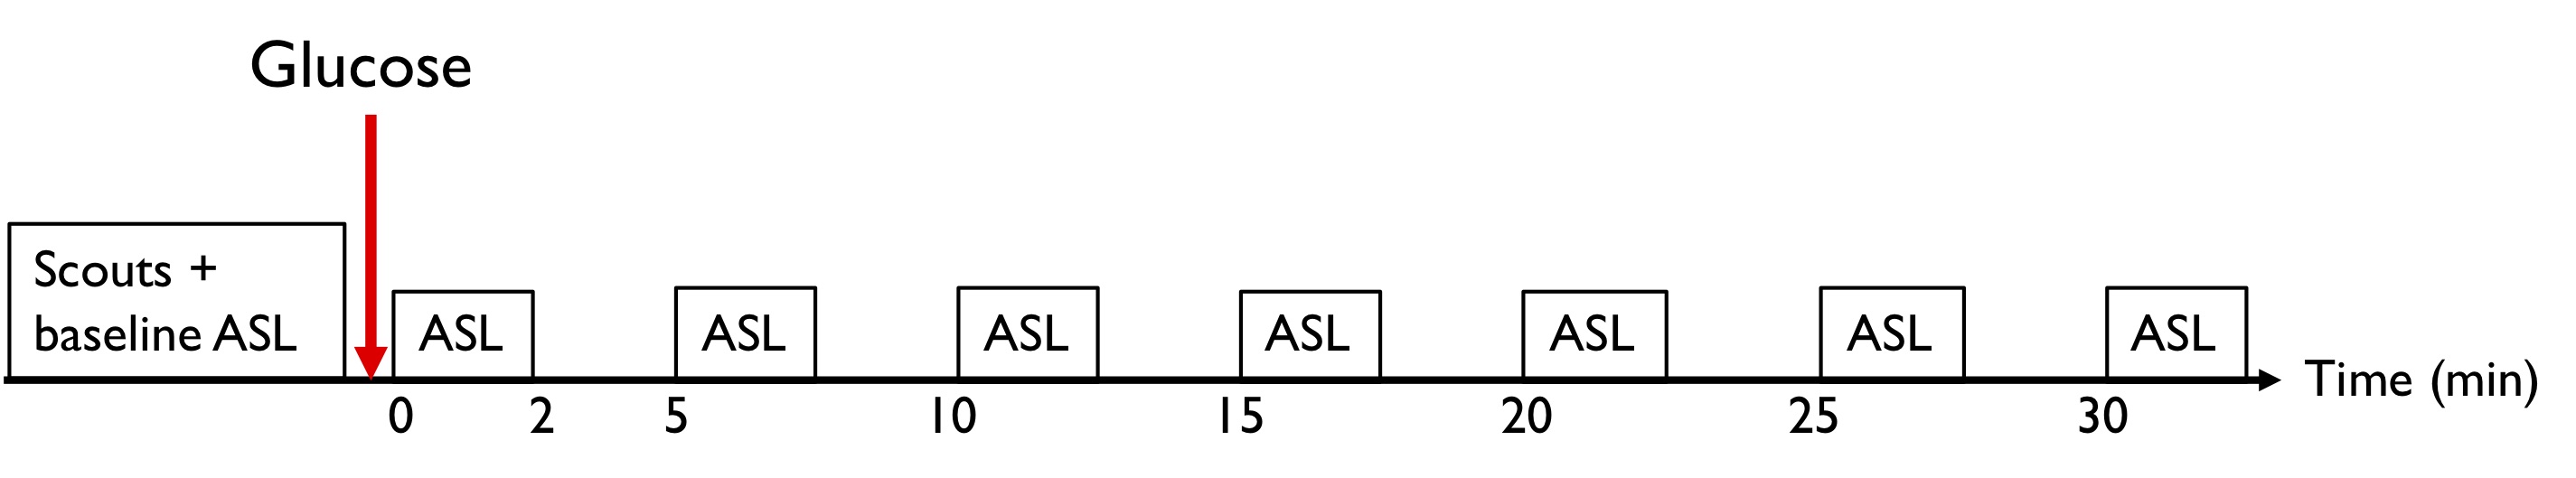
Non-invasive pancreatic perfusion assessment with ASL has recently become feasible1,2 and may prove useful for studying endocrine disorders such as diabetes mellitus. PET-based studies have reported a significant pancreatic perfusion increase after endocrine stimulation by glucose challenge3 that might be linked to dynamics of insulin secretion and release in the bloodstream. Such observations have not yet been made with ASL4, however, potentially because of signal instabilities and/or insufficient sensitivity. Therefore, we performed an investigation of pancreas perfusion modulation following a glucose challenge with a background-suppressed pCASL sequence on a 3T scanner. Such a paradigm could either serve as a tool for studying endocrine disorders or just provide a glucose-enhanced scan of the pancreas that increases SNR for diagnostic purposes.Material and Methods
- Oral absorption of commercially available grape juice (N=7)
- Over the counter glucose tablets (N=3)
- Over the counter glucose gel (N=3)
Results and Discussion
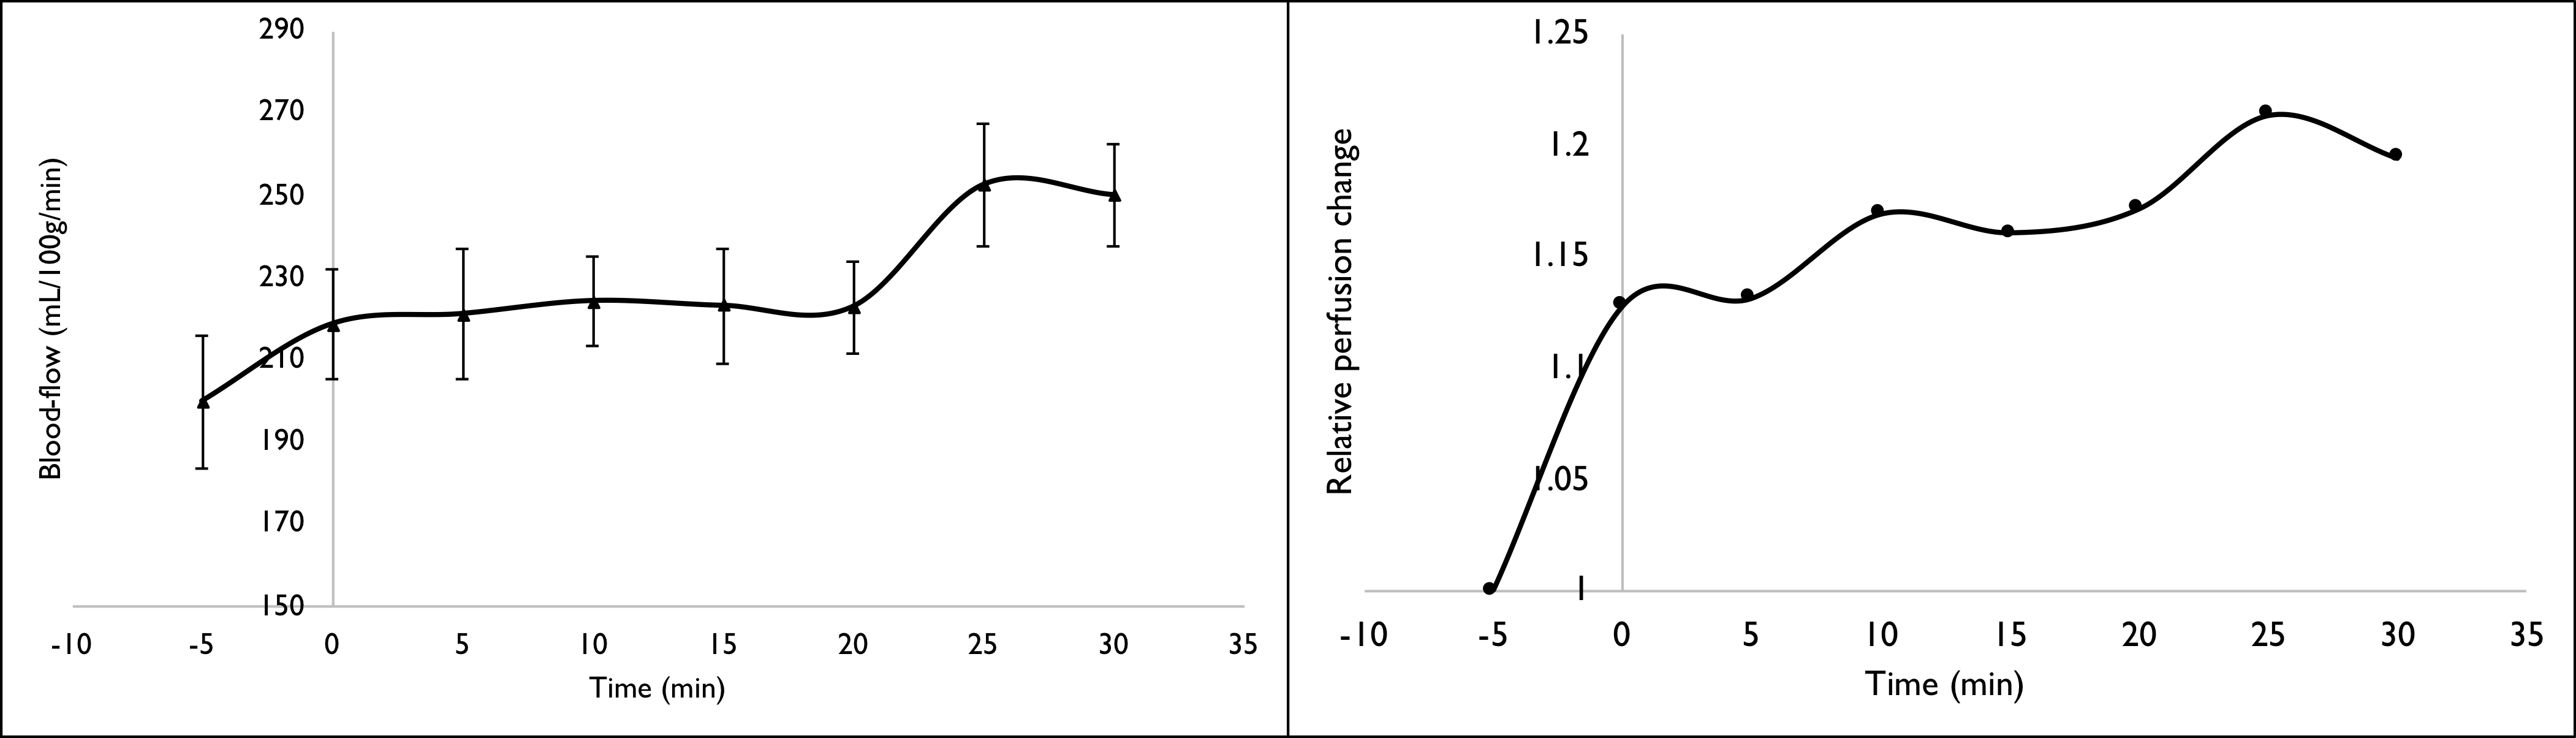
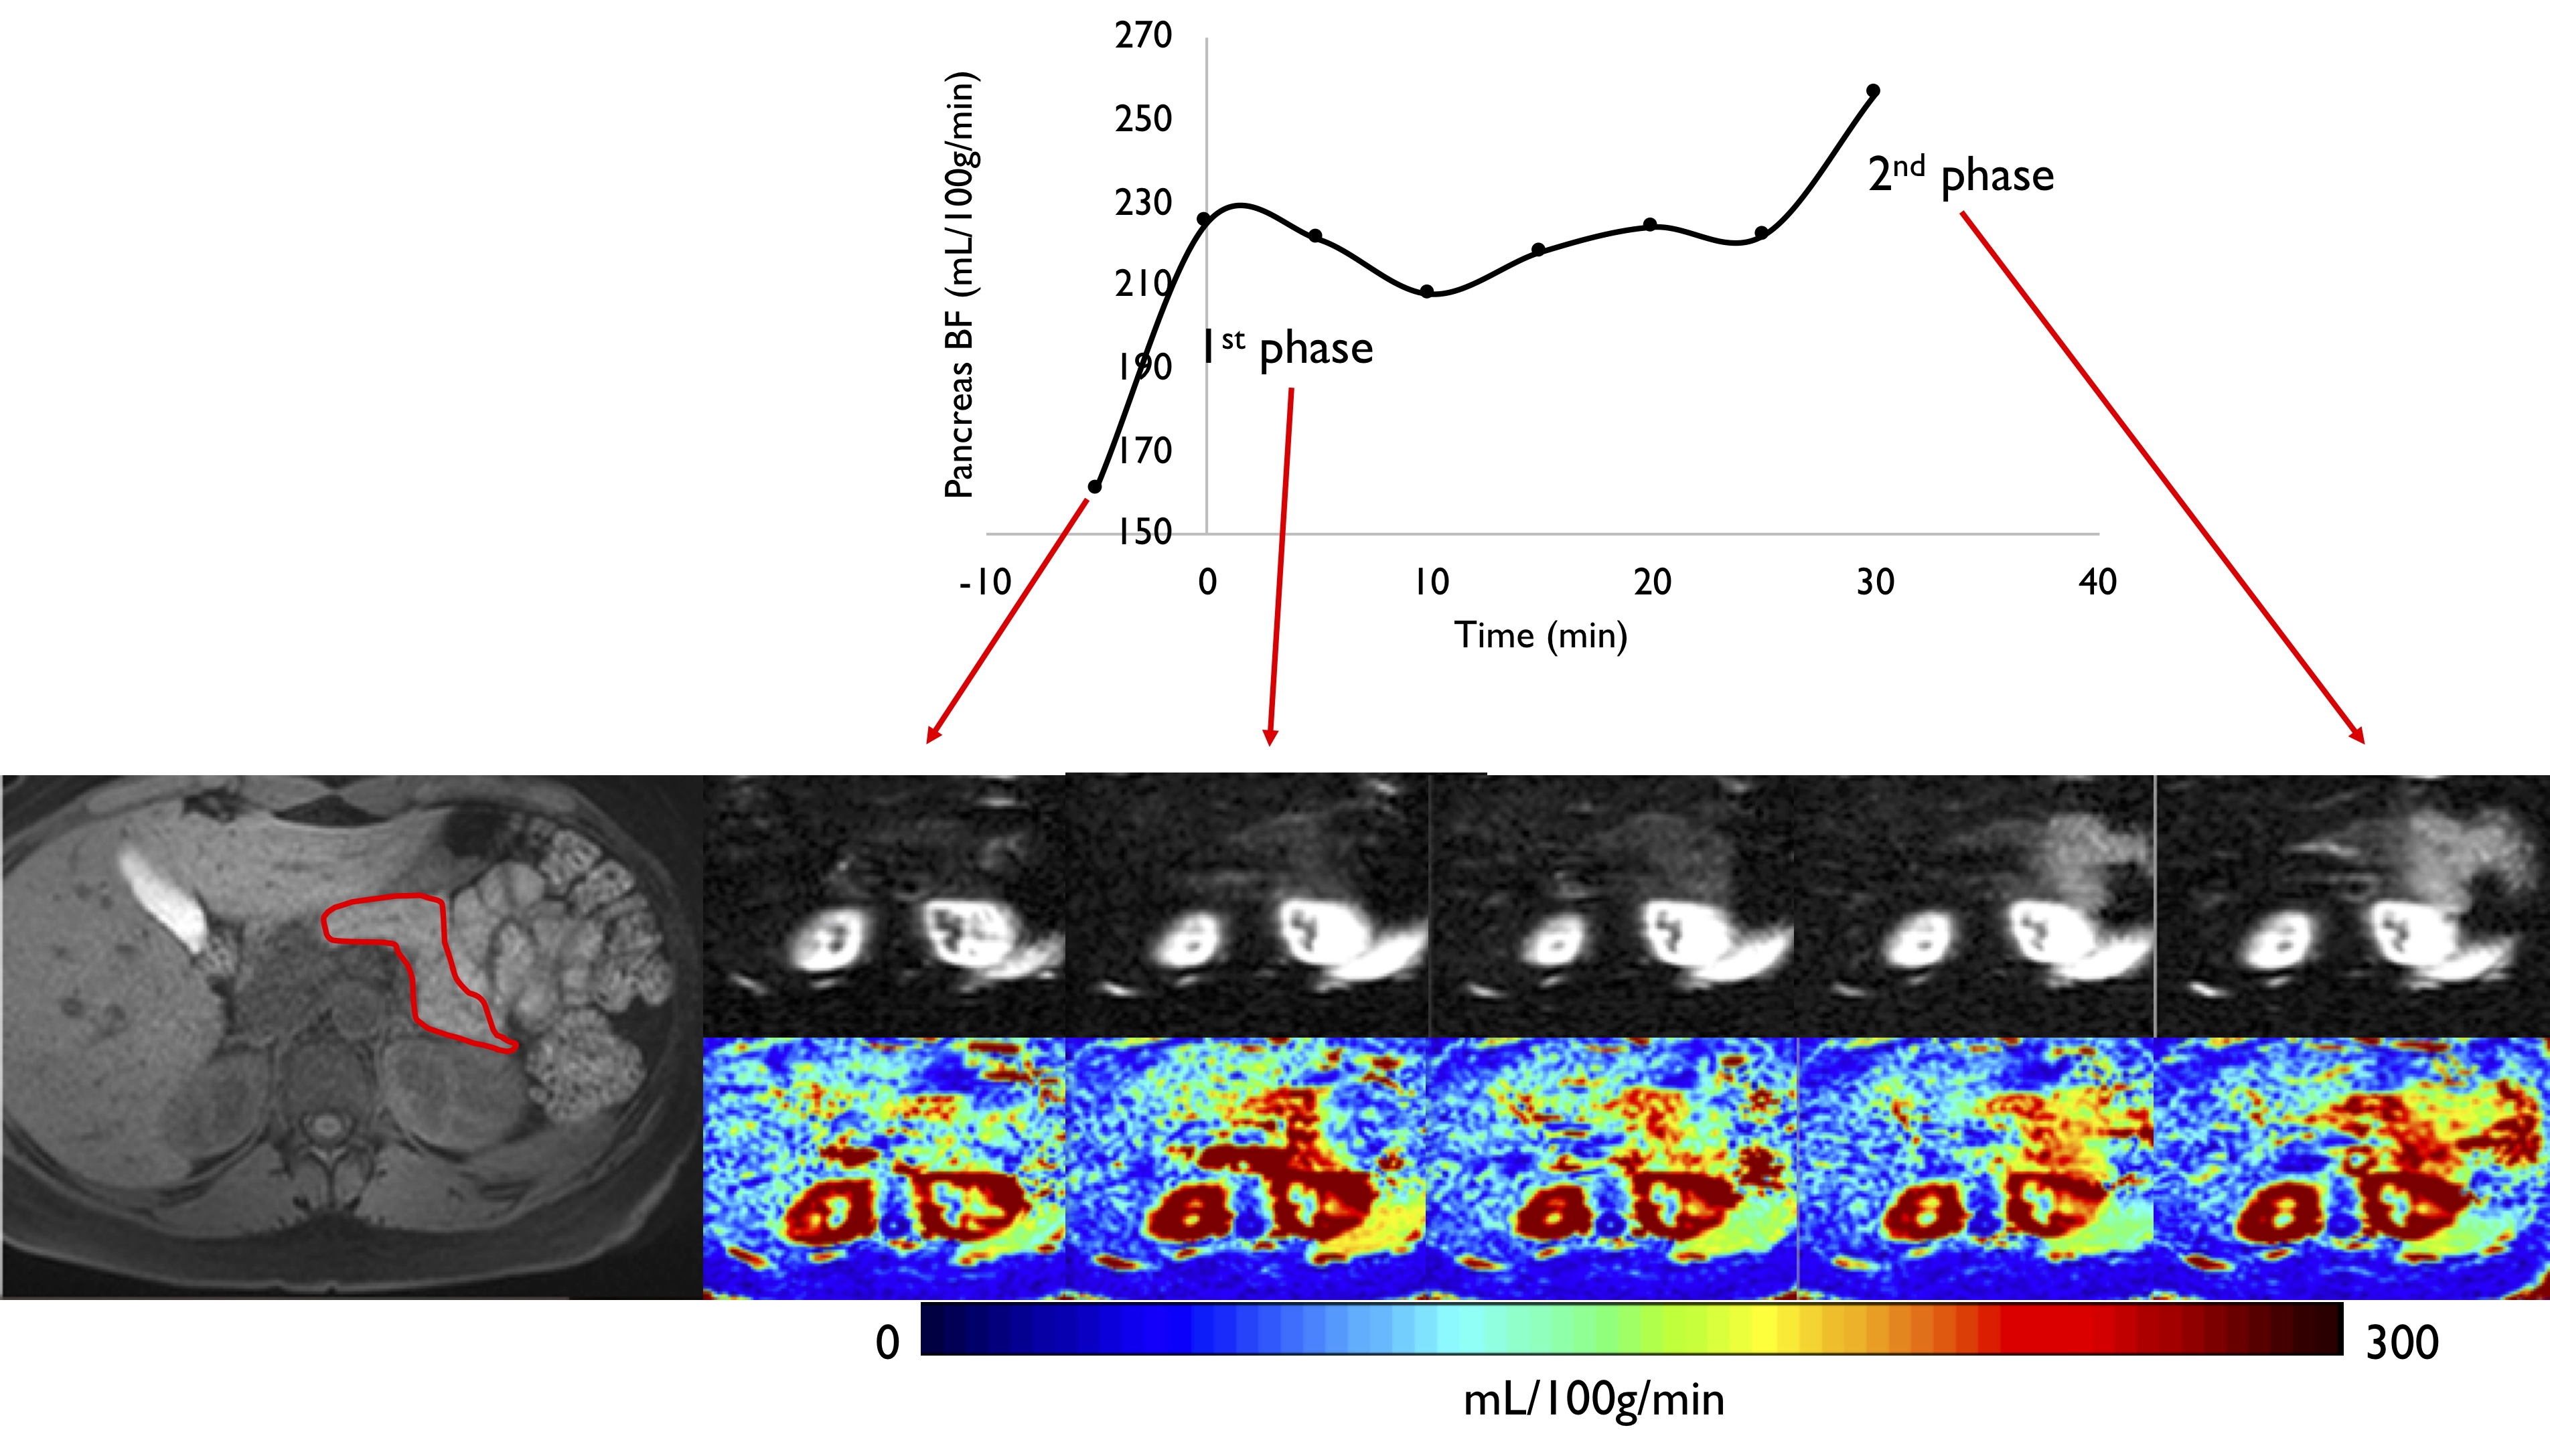
Baseline ASL perfusion values were in the range of those previously reported2,7, with an average blood-flow of 200±60mL/100g/min, ranging from 135 to 305 mL/100g/min, showing significant variability. We noticed a positive correlation (Pearson’s $$$\rho$$$=0.7) between BMI and baseline perfusion that might partially explain this variability. Following glucose stimuli, a blood-flow increase was systematically observed as seen in Figure 2 and illustrated on one case in Figure 3 (on average +31%). Interestingly, the relative perfusion change with regards to baseline flow seems to follow a marked biphasic pattern; insulin secretion following glucose challenge has been shown to follow a biphasic pattern in animal and human experiments. A negative correlation was found ($$$\rho$$$=-0.68) between baseline perfusion and maximal relative increase. Although a single-ROI encompassing the whole gland was used for quantification, visual inspection shows an interesting enhancement predominantly in the tail at later timepoints.Conclusions
This study shows that our background-suppressed pCASL implementation is sufficiently sensitive to detect blood-flow changes in the pancreas induced by a glucose challenge. This might be an interesting and very practical paradigm for enhanced SNR of pancreas ASL perfusion in a clinical setting, especially knowing that the actual glucose dose remains low (1/3rd of what is given to suspected diabetic patients in a glucose-tolerance test). Further comparisons of the glucose administration methods and the corresponding blood glucose and insulin curves is planned, as well as investigation of the dose effect. A standardized protocol for reproducible stimulation could provide some new insights into pancreatic functional alterations encountered in type 2 diabetes throughout the different stages of the disease, especially at pre-diabetic stages for which the diagnosis and evolution assessment remains problematic. With 113 million adults in the US suffering from pre-diabetes or diagnosed type 2 diabetes, non-invasive pancreatic endocrine function assessment with ASL can potentially have tremendous clinical impact.Acknowledgements
No acknowledgement found.References
1. Schawkat, K. et al. Dynamic non-invasive ASL perfusion imaging of a normal pancreas with secretin augmented MR imaging. Eur. Radiol. 1–8 (2018). doi:10.1007/s00330-017-5227-8
2. Taso, M., Guidon, A., Zhao, L., Mortele, K. J. & Alsop, D. C. Pancreatic perfusion and arterial-transit-time quantification using pseudocontinuous arterial spin labeling at 3T. Magn. Reson. Med. (2018), DOI 10.1002/mrm.27435.
3. Carlbom, L. et al. Pancreatic perfusion and subsequent response to glucose in healthy individuals and patients with type 1 diabetes. Diabetologia 59, 1968–1972 (2016).
4. Hirshberg, B. et al. Pancreatic perfusion of healthy individuals and type 1 diabetic patients as assessed by magnetic resonance perfusion imaging. Diabetologia 52, 1561–1565 (2009).
5. Robson, P. M. et al. Strategies for reducing respiratory motion artifacts in renal perfusion imaging with arterial spin labeling. Magn. Reson. Med. 61, 1374–1387 (2009).
6. Buxton, R. B. et al. A general kinetic model for quantitative perfusion imaging with arterial spin labeling. Magn. Reson. Med. 40, 383–396 (1998).
7. Schraml, C., Schwenzer, N. F., Martirosian, P., Claussen, C. D. & Schick, F. Perfusion imaging of the pancreas using an arterial spin labeling technique. J. Magn. Reson. Imaging JMRI 28, 1459–1465 (2008).
Figures