0638
Whole-abdomen Free-breathing Quantitative Dynamic Contrast Enhanced (DCE) MR Imaging of Pancreatic Ductal Adenocarcinoma (PDAC) with Fast T1 Mapping Using Multitasking: A Pilot Study1Biomedical Imaging Research Institute, Cedars-Sinai Medical Center, Los Angeles, CA, United States, 2Department of Bioengineering, University of California, Los Angeles, Los Angeles, CA, United States, 3Department of Medicine, Cedars-Sinai Medical Center, Los Angeles, CA, United States, 4Radiologic Department, Chaoyang Hospital, Beijing, China, 5Department of Radiation Oncology, Cedars-Sinai Medical Center, Los Angeles, CA, United States
Synopsis
PDAC is the 3rd leading cause of cancer-related death in the US with poor prognoses. Although conventional DCE-MRI techniques have demonstrated high sensitivity and specificity in tumor delineation, the diagnosis and prognosis of PDAC continues to be challenging with currently available imaging tools. In this work, we proposed a novel Multitasking DCE technique enabling free-breathing acquisition, 3D whole-abdomen coverage, high temporal resolution (500 ms), and dynamic T1 mapping to allow for accurate quantification of tissue perfusion and vascular properties of PDAC. The in vivo feasibility of the proposed technique is demonstrated in healthy subjects and patients with PDAC.
Introduction
PDAC is the 3rd leading cause of cancer-related death in the US with a dismal overall 5-year survival rate of 8%1,2. DCE-MRI plays a significant role in the detection of PDAC and has demonstrated high sensitivity and specificity3-6. Moreover, DCE-MRI is capable of quantitative assessment of the tissue vascular properties, which has great potential to improve the diagnosis, prognosis, and treatment response-evaluation of PDAC. However, conventional DCE-MRI techniques continue to experience technical challenges including: 1) breath-hold requirement to minimize respiratory motion artifacts; 2) relatively low temporal resolution (typically in mins) and only four phases, which limits the capability of quantitative tumor biology characterization. To address these limitations, we propose a novel DCE-MRI technique based on our newly-developed MR Multitasking framework7, which enables free-breathing acquisition, 3D whole-abdomen coverage, high temporal resolution (500 ms), and dynamic T1 mapping throughout entire contrast hemodynamic process—thus allowing accurate quantification of tissue perfusion and vascular properties in the pancreas.Methods
Sequence and sampling pattern: As described in our previous work8, the basic sequence structure was a continuous scan with non-selective SR preparation followed by 3D FLASH readouts using water excitation. A 3D Cartesian sampling pattern was used with randomized gaussian-density reordering in both phase and partition encoding directions. The center k-space line was collected as training data in partition encoding direction every 8 readouts.
Reconstruction: The 6D image $$$I(x,y,z,TI,\tau,t)$$$ can be represent as a four-way tensor $$$\mathcal{A}$$$ with voxel location index $$$\mathbf{r}=(x,y,z)$$$, SR dimension $$$TI$$$, respiration dimension $$$\tau$$$ and DCE time course $$$t$$$. The low-rank tensor $$$\mathcal{A}$$$ can be factorized as $$$\mathbf{A}_{(1)}=\mathbf{U}\mathbf{\Phi}$$$, where $$$\mathbf{A}_{(1)}$$$ is the unfolded matrix form of the tensor. The factor $$$\boldsymbol{\rm{\Phi}}$$$, which is the product of a core tensor and 3 temporal bases describing T1 relaxation, respiratory motion and contrast dynamics, is first determined from the training data7,8. The factor $$$\boldsymbol{\rm{U}}$$$, which defines the spatial coefficients, is then recovered by fitting $$$\mathbf{\Phi}$$$ to the acquired imaging data $$$\boldsymbol{\rm{d}}$$$:$$\mathbf{\hat{U}}=\underset{\mathbf U}{\rm argmin}||\mathbf{d}-\Omega (\mathbf {FSU\Phi})||_{2}^{2}+\lambda\rm{TV}(\mathbf{U}),$$with undersampling operator $$$\Omega$$$, Fourier transform $$$\mathbf{F}$$$, coil sensitivity operator $$$\mathbf{S}$$$, regulation function $$$\rm{TV(\cdot)}$$$ and regularization parameter $$$\lambda$$$.
Kinetic model: The extended Tofts model was adopted as9$$C_{\rm t}(t)=v_{\rm p}C_{\rm p}(t)+K^{\rm{trans}}\int_{0}^{t}C_{\rm p}(\tau)e^{K_{\rm ep}(t-\tau)}d\tau,$$with contrast concentration in plasma $$$C_{\rm p}(t)$$$ and in tissues of interest $$$C_{\rm t}(t)$$$, fractional plasma volume $$$v_{\rm p}$$$, transfer constant $$$K^{\rm{trans}}$$$, reverse transfer rate $$$K_{\rm ep}=K^{\rm{trans}}/v_{\rm e}$$$, and fractional extravascular extracellular space $$$v_{\rm e}$$$. $$$C_{\rm p}(t)$$$ and $$$C_{\rm t}(t)$$$ are directly transformed from the dynamic T1 mapping of corresponding tissues:$$C(t)=\frac{\frac{1}{T_1(t)}-\frac{1}{T_{\rm{1pre}}}}{\gamma}$$where $$$T_{\rm{1pre}}$$$ and $$$T_1(t)$$$ are the pre-contrast T1 and dynamic T1s of the particular tissue, and $$$\gamma$$$ is the relaxivity rate.
Experiment design: All the data were acquired on a 3T Siemens mMR scanner in transversal orientation with the following parameters: TE/TR = 2.6/5.5 ms, SR period/temporal resolution = 500 ms, FOV = 380x268 mm2, in-plane spatial resolution = 1.2x1.2 mm2, 60 slices with slice thickness = 6 mm, $$$\alpha$$$ = 10°, scan time = 11.2 min. Gadavist (0.1 mmol/kg) was administered at the rate of 2.0 ml/sec. The accuracy of T1 mapping and reproducibility were validated on T1 phantoms. Healthy volunteers (n=10) and patients with clinically diagnosed PDAC (n=7) were recruited for the study.
Results
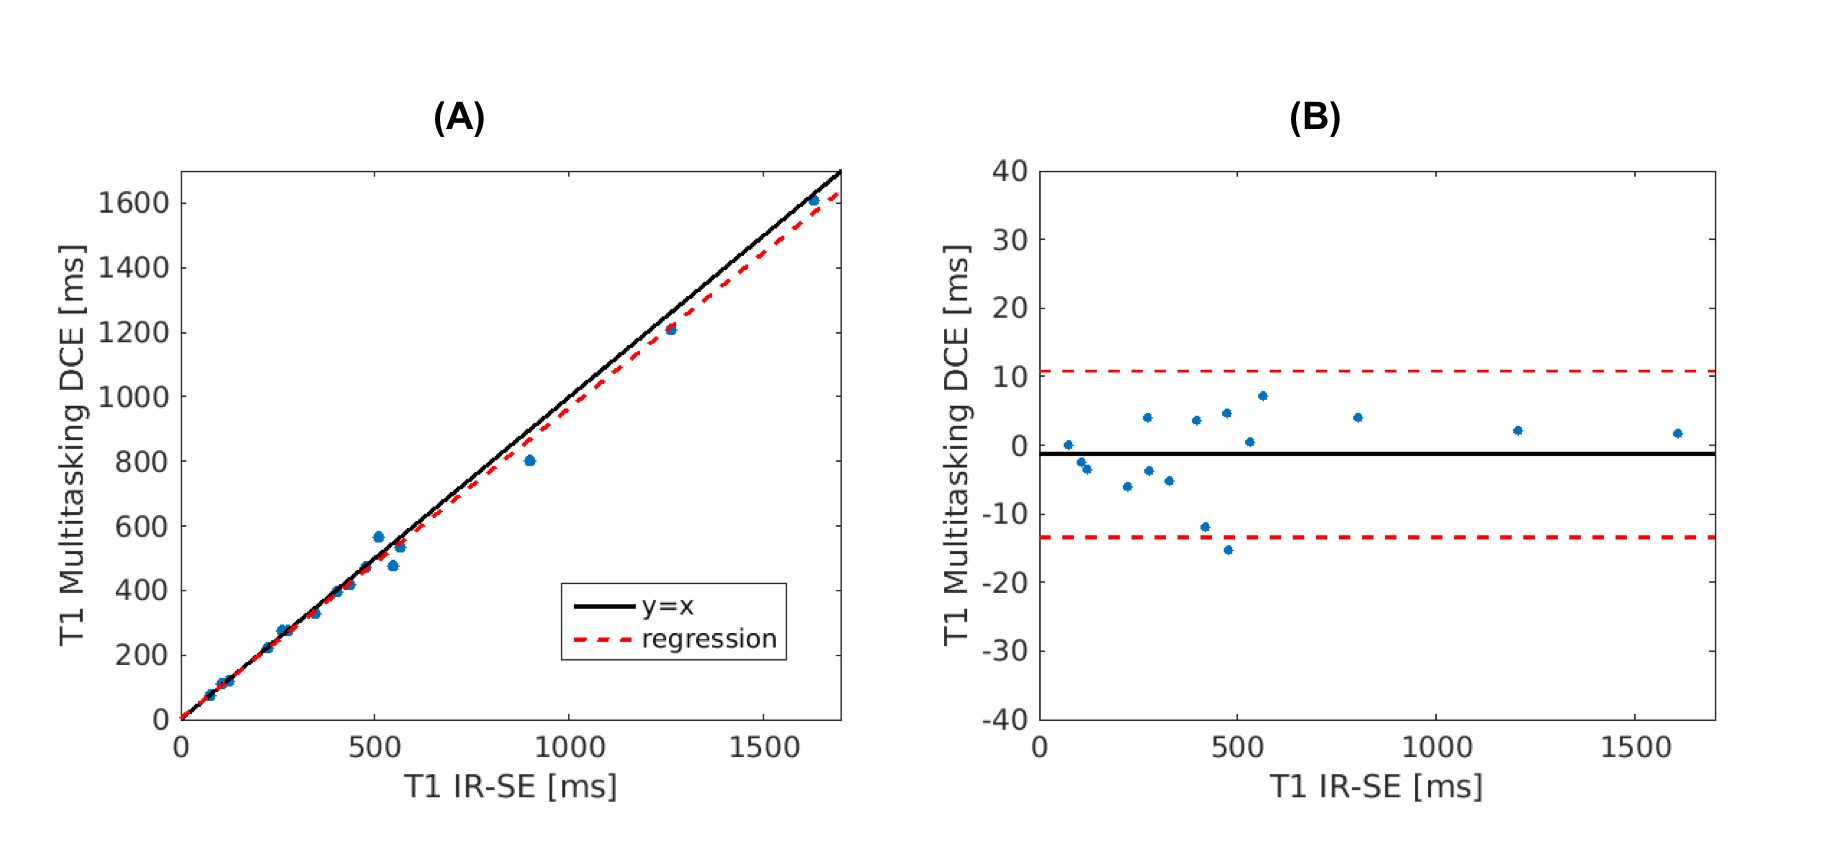
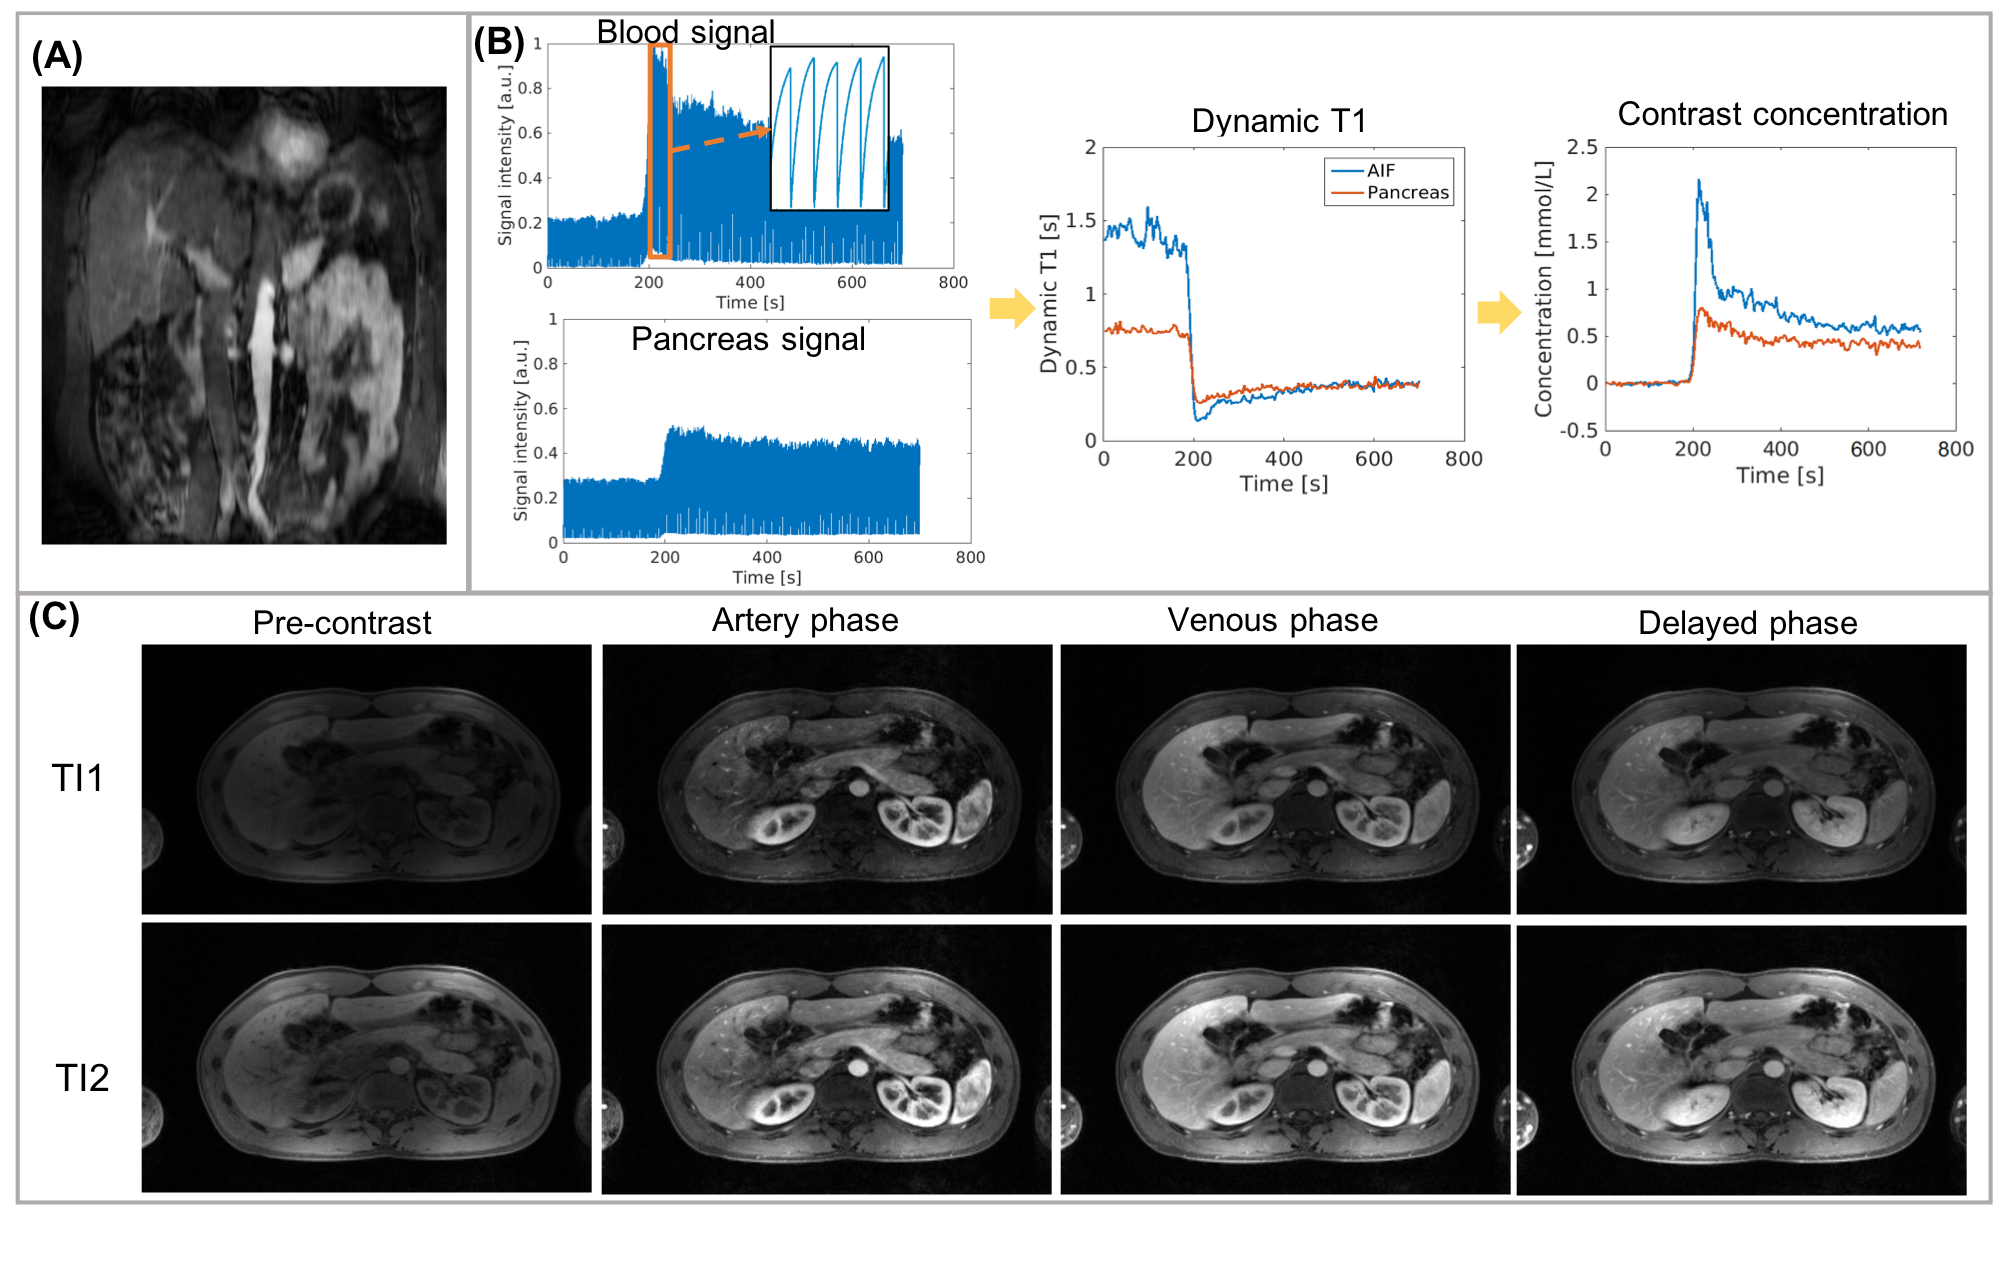
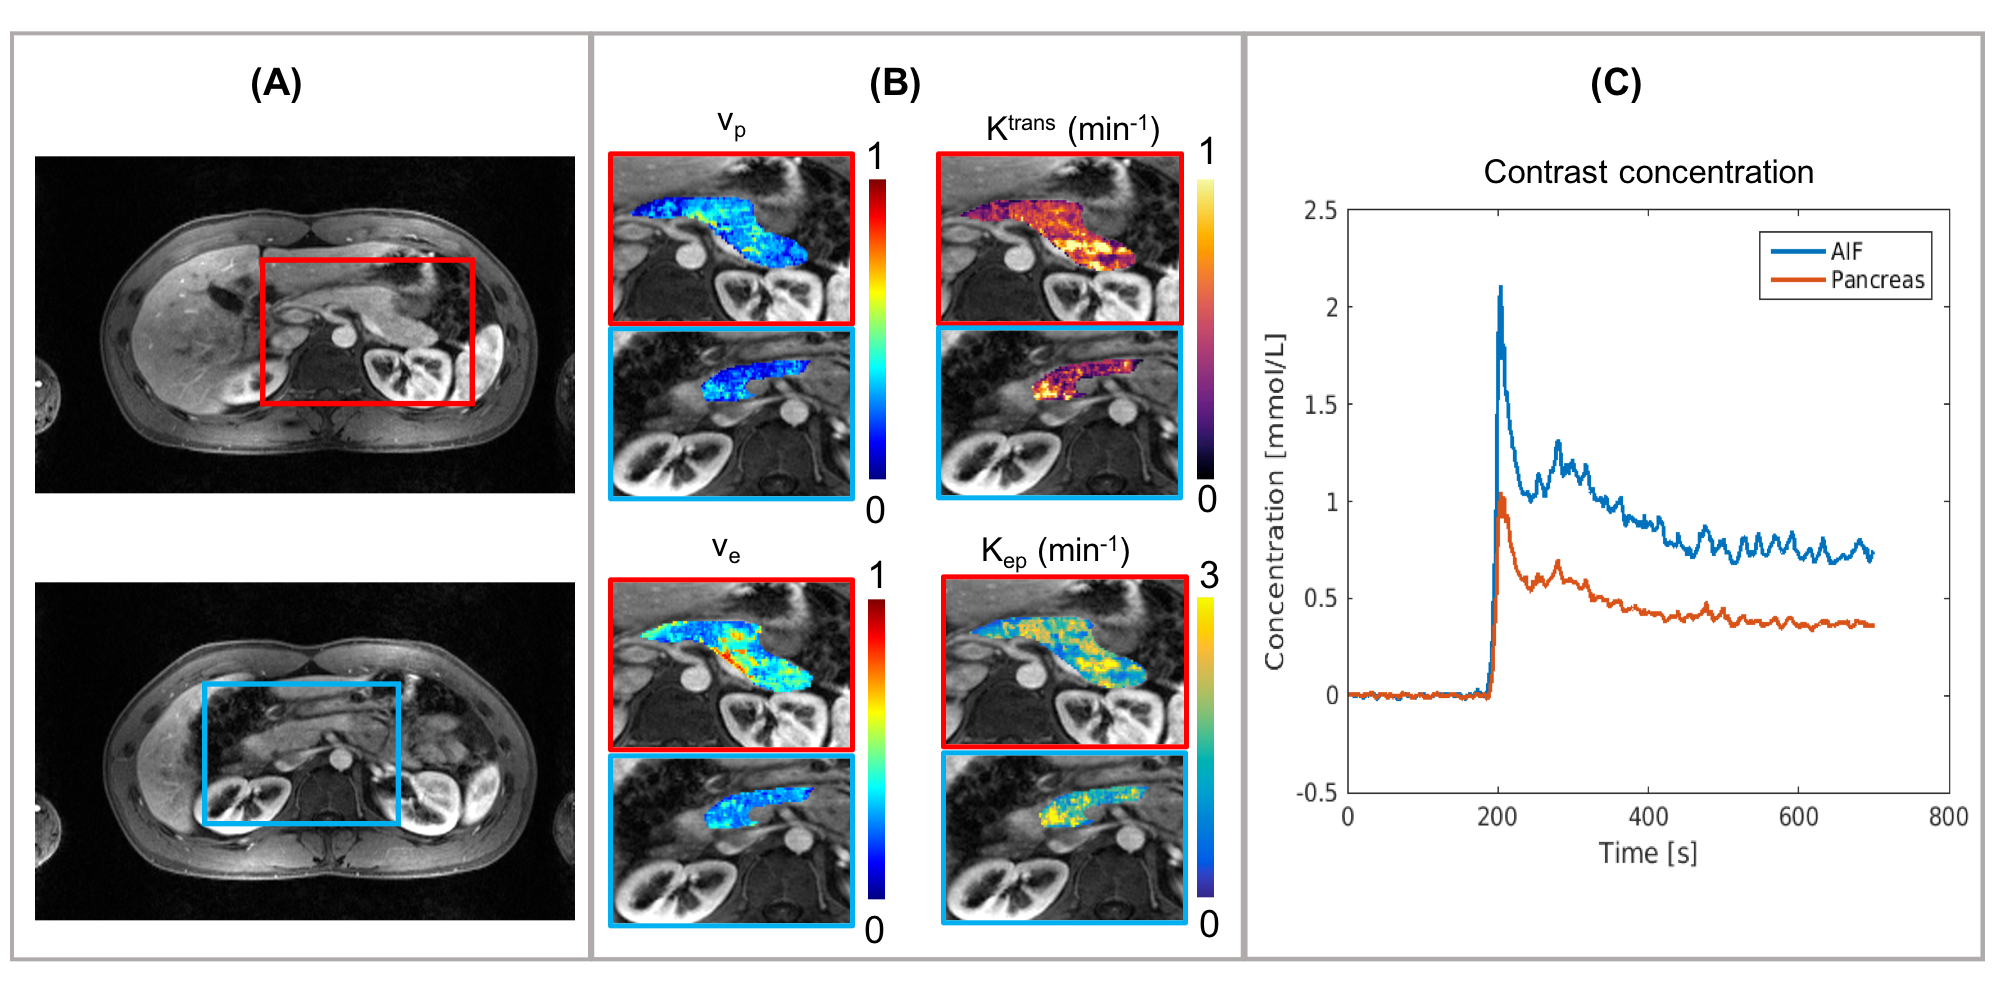
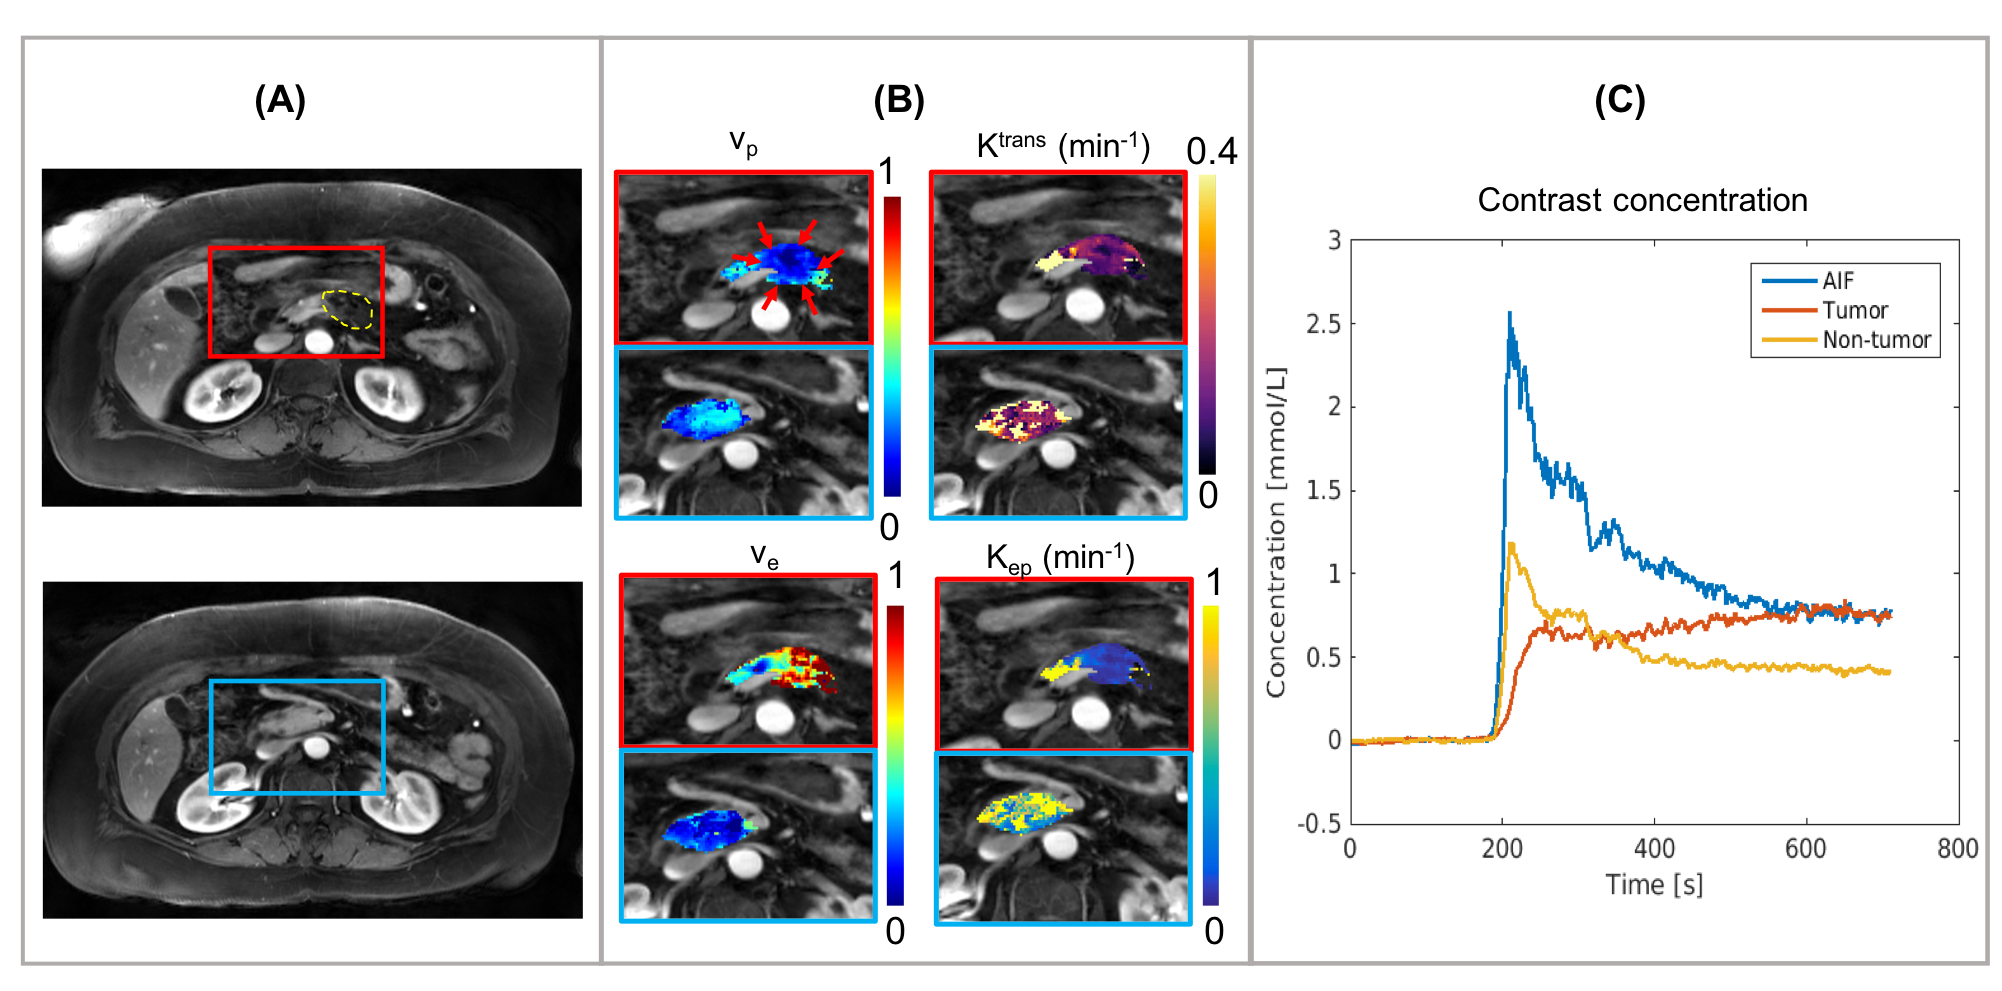
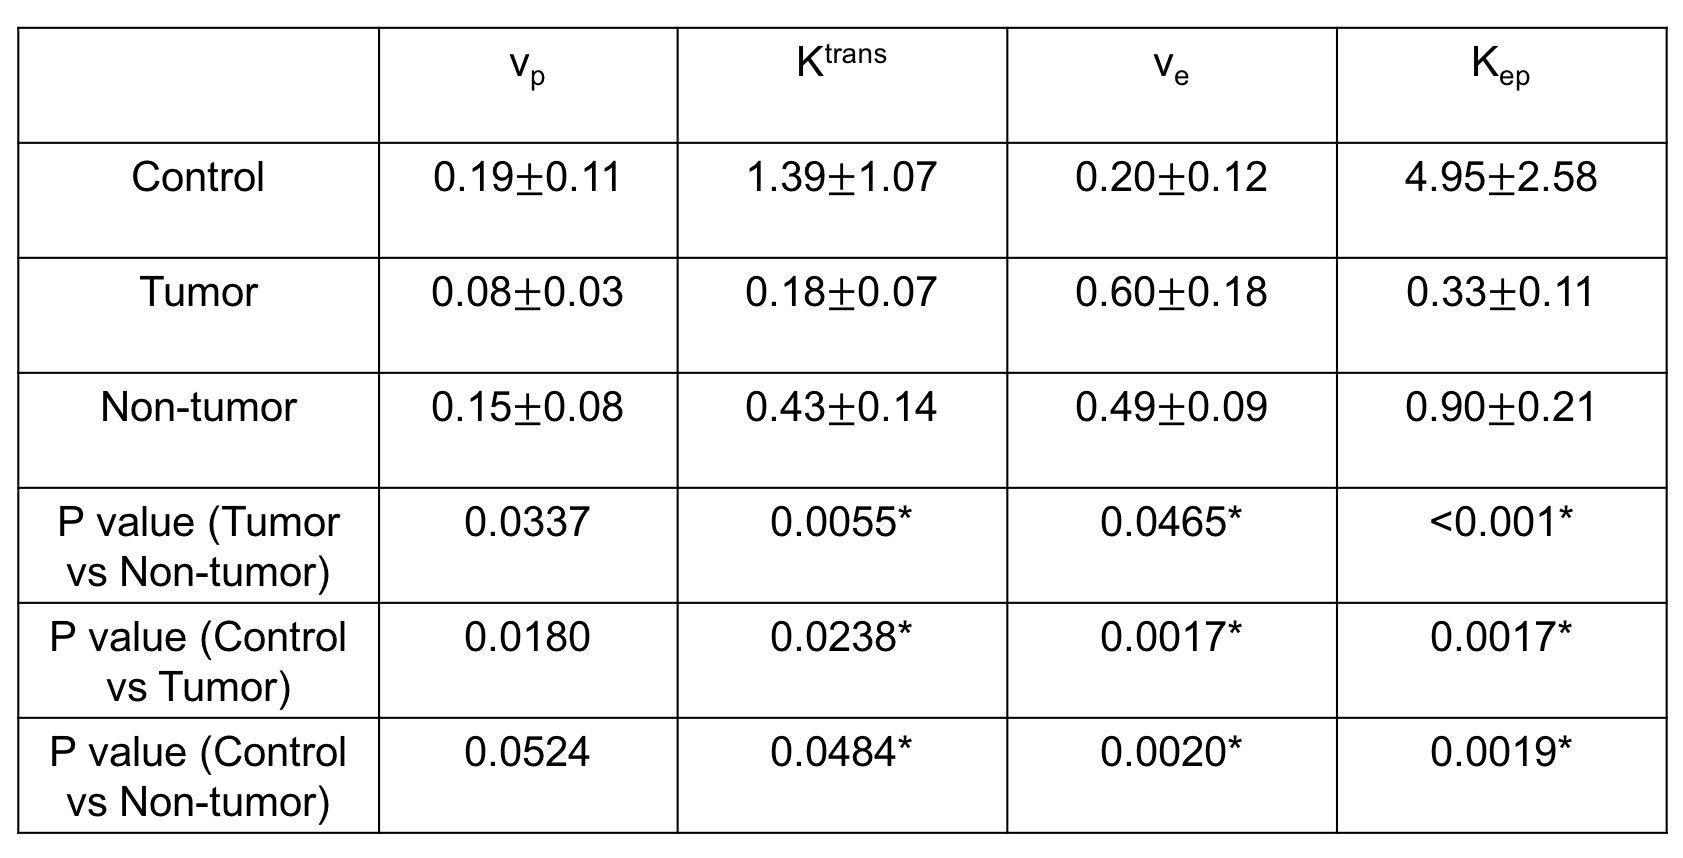
Figure 1A shows high correlation for T1 quantification between Multitasking DCE and reference IR-SE in phantoms ($$$R^{2}=0.99$$$) while the Bland-Altman plots in Figure 1B demonstrates minimal bias (1.3%) and low limits of agreement (10.3%). Figure 2 illustrates the real-time signal evolution and representative images at different orientations, TIs and DCE phases. Figure 3 and Figure 4 show the dynamic contrast concentration of plasma and pancreas, and the kinetic parametric mapping from a healthy subject and a patient with PDAC, respectively. Table 1 lists the statistical analysis (t-test) of vp, Ktrans, ve and Kep between the healthy group, tumor area and non-tumor area in patient group with Holm-Bonferroni correction.Discussion
This study showed the in vivo feasibility of the proposed Multitasking DCE technique. The direct T1 quantification can eliminate the error caused by the linear approximation from signal intensity to contrast agent concentration. Statistical analysis indicates that Ktrans and Kep of tumor are significantly lower while ve is significantly higher compared to the values in healthy pancreas and non-tumor areas of patients, which are consistent with previous studies10,11. The large FOV of the protocol covering the entire abdomen is potentially useful for detecting metastasis.Conclusion
Our Multitasking DCE technique allows free-breathing acquisition, whole-abdomen coverage, high temporal resolution T1 mapping and biomarker quantification to characterize tissue perfusion and vascular properties of PDAC. This pilot study demonstrated the capability of the proposed technique to differentiate PDAC lesions from non-tumor pancreatic tissue. Further clinical validation in a larger patient cohort is warranted.Acknowledgements
No acknowledgement found.References
1. Li D, Xie K, Wolff R, Abbruzzese JL. Pancreatic cancer. The Lancet 2004;363(9414):1049-1057.
2. Siegel RL, Miller KD, Jemal A. Cancer statistics, 2017. CA: a cancer journal for clinicians 2017;67(1):7-30.
3. Lee ES, Lee JM. Imaging diagnosis of pancreatic cancer: a state-of-the-art review. World journal of gastroenterology: WJG 2014;20(24):7864.
4. Pietryga JA, Morgan DE. Imaging preoperatively for pancreatic adenocarcinoma. Journal of gastrointestinal oncology 2015;6(4):343.
5. Koelblinger C, Ba-Ssalamah A, Goetzinger P, Puchner S, Weber M, Sahora K, Scharitzer M, Plank C, Schima W. Gadobenate dimeglumine–enhanced 3.0-T MR imaging versus multiphasic 64–detector row CT: prospective evaluation in patients suspected of having pancreatic cancer. Radiology 2011;259(3):757-766.
6. Motosugi U, Ichikawa T, Morisaka H, Sou H, Muhi A, Kimura K, Sano K, Araki T. Detection of pancreatic carcinoma and liver metastases with Gadoxetic acid–enhanced MR imaging: comparison with contrast-enhanced multi–detector row CT. Radiology 2011;260(2):446-453.
7. Christodoulou AG, Shaw JL, Nguyen C, Yang Q, Xie Y, Wang N, Li D. Magnetic resonance multitasking for motion-resolved quantitative cardiovascular imaging. Nature Biomedical Engineering 2018;2(4):215.
8. Wang N, Christodoulou AG, Xie Y, Wang Z, Deng Z, Zhou B, Lee S, Fan Z, Chang H, Yu W. Quantitative 3D dynamic contrast‐enhanced (DCE) MR imaging of carotid vessel wall by fast T1 mapping using Multitasking. Magnetic resonance in medicine 2018.
9. Yankeelov TE, Gore JC. Dynamic contrast enhanced magnetic resonance imaging in oncology: theory, data acquisition, analysis, and examples. Current medical imaging reviews 2007;3(2):91-107.
10. Bali MA, Metens T, Denolin V, Delhaye M, Demetter P, Closset J, Matos C. Tumoral and nontumoral pancreas: correlation between quantitative dynamic contrast-enhanced MR imaging and histopathologic parameters. Radiology 2011;261(2):456-466.
11. Kim JH, Lee JM, Park JH, Kim SC, Joo I, Han JK, Choi BI. Solid pancreatic lesions: characterization by using timing bolus dynamic contrast-enhanced MR imaging assessment—a preliminary study. Radiology 2013;266(1):185-196.
Figures