0636
Myelin Water Imaging and R2* Mapping in Neonates1Pediatrics, UBC, Vancouver, BC, Canada, 2Radiology, Chongqing Medical University, Chongqing, China, 3Pediatrics, UBC, 2221 Wesbrook Mall, BC, Canada
Synopsis
Understanding sources of R2* in the brains of infants and adults could lead to novel imaging biomarkers that could inform clinicians and researchers about white matter microstructure, and iron and myelin content. These biomarkers could in turn help determine the health, disease state, or developmental progress of white matter tissue, with many potential benefits to diagnosis, treatment, and therapeutic research. As opposed to adults who show a remarkable fit of R2* against fibre orientation, neonates showed very little dependence on myelin or fibre orientation.
Introduction
The R2* relaxation rate measured with multi-echo gradient-echo MRI is sensitive to magnetic field inhomogeneities. In brain tissue, it provides a semi-quantitative method of detecting myelin, iron, and white matter fibre orientation angle. Compared to standard histogram based analyses, angle resolved analysis of R2* has been shown to improve the detection of subtle differences between controls, subjects with multiple sclerosis, and their asymptomatic siblings.[1] Thus, understanding what contributes to R2* relaxation in white matter has great potential in understanding, detecting and examining white matter disease models. Unfortunately, most of what is known has been limited to adult populations. Neonates, who are born with very little myelin and iron, and an underdeveloped connectome, provide researchers with an opportunity to investigate whether a similar angle-resovled analysis of R2* could be used for applications in developmental biomarkers.Hypotheses
Neonate R2* dependence on orientation and myelin content will be investigated and compared to adults using three potential models: a linear-model dependant on myelin water fraction, a non-linear model dependant on fibre orientation, and a non-linear 'combined' model dependant on both. Although myelin content is very low at birth, the basic white matter fibre architecture is in place. Therefore, we hypothesize that neonates will display a similar R2* angle dependency as adults, but to a lesser degree.Study Population
Five healthy adult volunteers (mean age= 31.2±8.3yrs; three males) were recruited from Vancouver, Canada. Eight term neonates (mean age= 38.6±1.2wks; five males) were recruited from the Children's Hospital of Chongqing Medical University neonatal ward.Methods
All subjects were scanned on identical 3T Philips Achieva scanners equipped with an 8-channel SENSE head coil and underwent a multi-echo gradient echo scan, a 32 direction DTI scan, and a MWI scan with at least 32 echoes between 10 and 320ms.
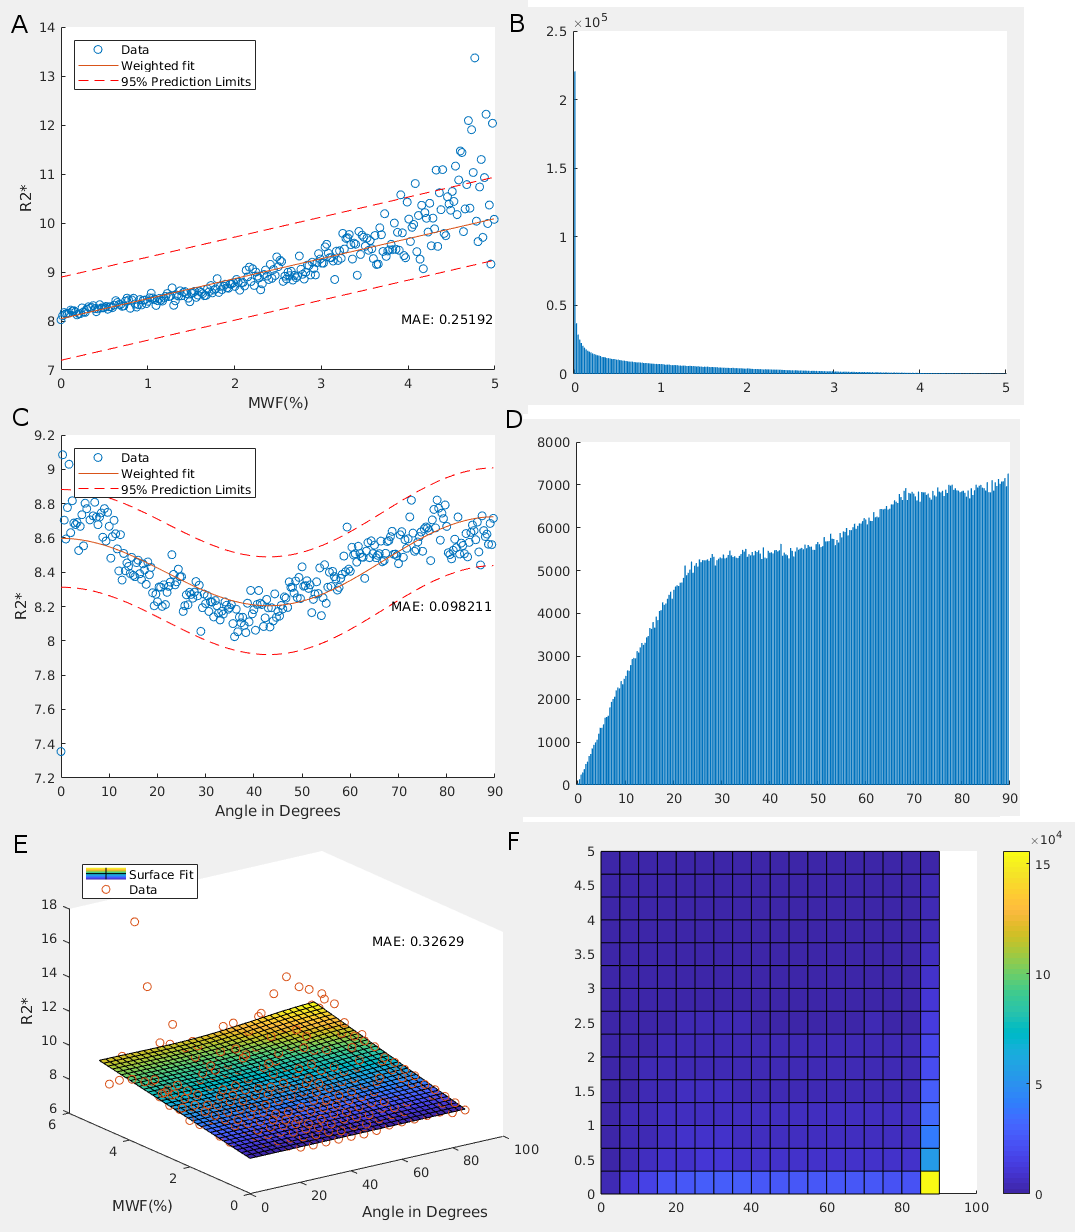
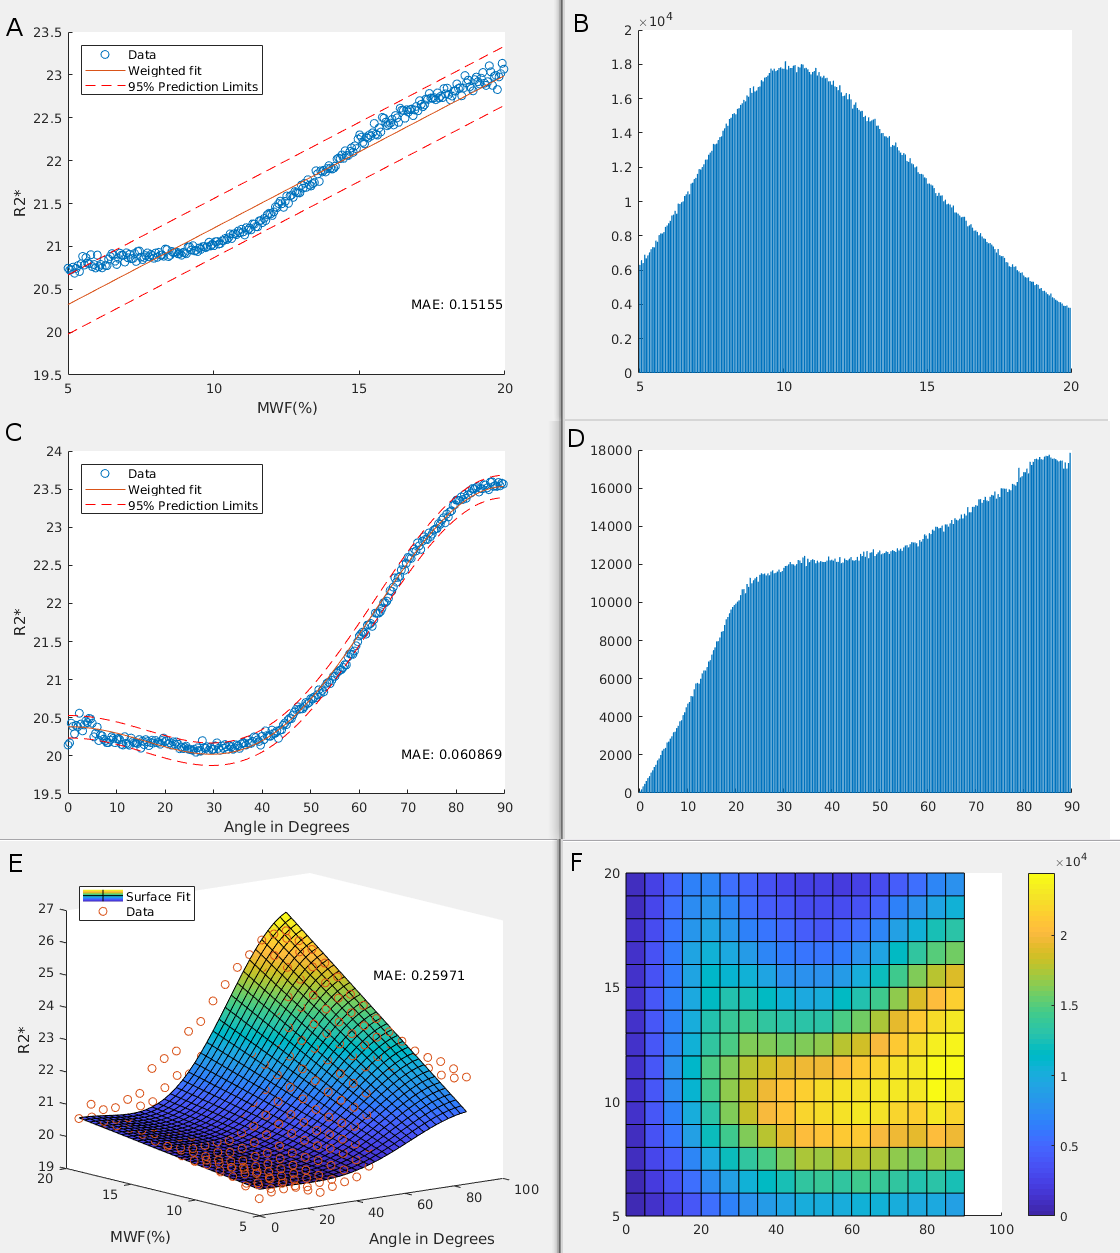
R2* maps were created using a linear fit of TE against the logarithm of measured T2* intensity. Myelin water fraction (MWF) maps were decomposed using a non-negative least squares fit, with myelin T2 signal coming from 14-40ms.[2] MWF maps were then registered to R2*. Using DTI, white matter masks were created using fractional anisotropy maps and fsl's FAST. White matter and V1 masks were registered to R2*. R2* was fit to three models: a linear model with myelin water fraction (MWF), henceforth known as the 'myelin model'; a non-linear model with primary fibre orientation relative to the magnet, known as the 'fibre orientation model';[3-9] and a combined non-linear model suggested by the Jongho Lee group,[10] known as the 'combined model'.Results
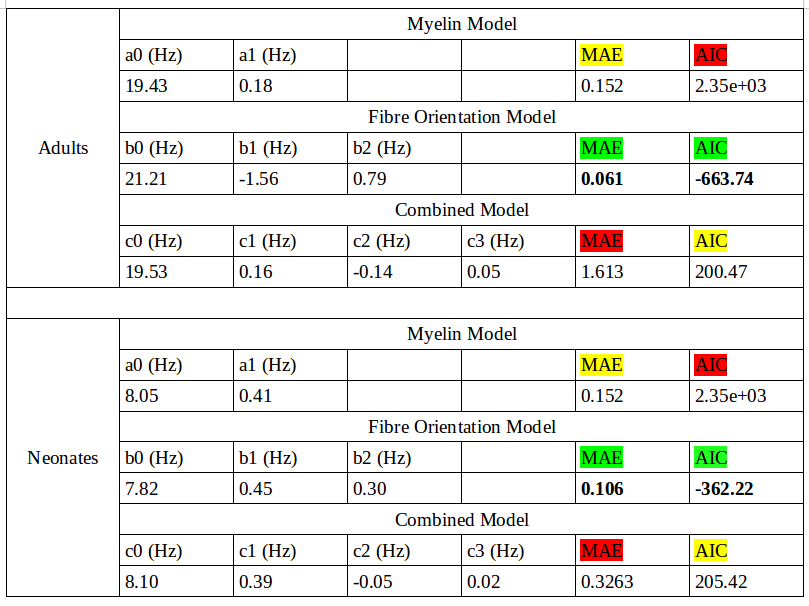
Mean adult MWF% and R2* values were 12.130 and 21.729, respectively, while mean neonate MWF% and R2* values were 1.261 and 8.482, respectively. Fitted model results for neonates and adults are shown in Figures 1 and 2, respectively. For both neonates and adults, bin averaged R2* variation was found to be best explained by the fibre orientation model (lowest Akaike Information Critera value; Table 1).Discussion and Conclusion
The fibre orientation dependency of R2* in neonates starts out low and increases with age. The time course of how this dependency develops with age, however, is unknown. As R2* dependency on fibre orientation is the best model we have for adults, and shows good agreement in neonates, future experiments should focus on this relationship over time from birth to adulthood. It is expected that the most significant changes in this relationship will occur within the first few years of development, as this is the period with the most significant myelin development.[11]
Future studies would do well to include more subjects at the age ranges we looked at, as well as acquiring data in all the age ranges in between, but especially in the first few years of life. As well, preterm infants at various ages, with again a focus in the first few years, could potentially provide incredible insight on non-typical development. Although we would not predict that an angle-resolved analysis of R2* at term-equivalent age would show much difference, we do hypothesize that as preterm and healthy term infants develop myelin in the first five years, angle resolved R2* analysis would be able to separate the two groups, as their myelin content and WM tracts will develop differently. It could serve as an imaging marker for brain development or tissue repair in pediatric patients in the years shortly after birth.
Acknowledgements
No acknowledgement found.References
[1] Hernández-Torres, E. et al. Orientation Dependent MR Signal Decay Differentiates between People with MS, Their Asymptomatic Siblings and Unrelated Healthy Controls. PloS One 10, e0140956 (2015).
[2] Prasloski, T. et al. Rapid whole cerebrum myelin water imaging using a 3D GRASE sequence. NeuroImage 63, 533–539 (2012).
[3]. He, X. & Yablonskiy, D. A. Biophysical mechanisms of phase contrast in gradient echo MRI. Proc. Natl. Acad. Sci. U. S. A. 106, 13558–13563 (2009).
[4] Wiggins, G. et al. Exploring orientation dependence of T2* in white matter by extreme rotation of the human head at 7 tesla. in Proceedings of the 19th Annual Meeting of ISMRM 13 (2011).
[5] Bender, B. & Klose, U. The in vivo influence of white matter fiber orientation towards B(0) on T2* in the human brain. NMR Biomed. 23, 1071–1076 (2010).
[6] Lee, J. et al. Sensitivity of MRI resonance frequency to the orientation of brain tissue microstructure. Proc. Natl. Acad. Sci. U. S. A. 107, 5130–5135 (2010).
[7] Lee, J. et al. T2*-based fiber orientation mapping. NeuroImage 57, 225–234 (2011).
[8] Denk, C., Hernandez Torres, E., MacKay, A. & Rauscher, A. The influence of white matter fibre orientation on MR signal phase and decay. NMR Biomed. 24, 246–252 (2011).
[9] Liu, C. Susceptibility tensor imaging. Magn. Reson. Med. 63, 1471–1477 (2010).
[10] Lee, J. et al. An R2* model of white matter for fiber orientation and myelin concentration. NeuroImage 162, 269–275 (2017).
[11] Kinney, H. C. & Volpe, J. J. Myelination Events. in Volpe’s Neurology of the Newborn 176–188 (Elsevier, 2018). doi:10.1016/B978-0-323-42876-7.00008-9
Figures