0632
Direct comparison between macromolecular proton fraction and apparent diffusion coefficient as quantitative biomarkers of the human fetal brain maturation1Radiology, University of Washington, Seattle, WA, United States, 2Research Institute of Biology and Biophysics, Tomsk State University, Tomsk, Russian Federation, 3Institute “International Tomography Center” of the Siberian Branch of the Russian Academy of Sciences, Novosibirsk, Russian Federation
Synopsis
Apparent diffusion coefficient (ADC) is known as a quantitative biomarker of prenatal brain maturation. Fast macromolecular proton fraction (MPF) mapping is an emerging method for quantitative assessment of myelination that was recently adapted to fetal MRI. This study compared spatiotemporal trajectories of MPF and ADC changes in the brain anatomic structures of 42 fetuses in utero. MPF and ADC demonstrated qualitatively similar but quantitatively different spatiotemporal patterns. MPF appeared more sensitive to changes in the brain structures with known prenatal onset of myelination.
INTRODUCTION
Apparent diffusion coefficient (ADC) is known as a quantitative biomarker of prenatal brain maturation.1-4 Fast macromolecular proton fraction (MPF) mapping is an emerging method for quantitative assessment of myelination that was recently adapted to fetal MRI.5,6 The objective of this study was to compare the capability of ADC and MPF to quantify the normal fetal brain development.METHODS
Participants: The study population included 55 pregnant females referred to fetal MRI for clinical indications. Data from 42 fetuses (mean gestational age (GA)±standard deviation (SD): 27.7±6.0 weeks, range 20-38 weeks)) with normal brain MRI were included in subsequent analysis.
MRI Protocol: MRI acquisition was performed on a 1.5 Tesla Philips Achieva clinical scanner. An MPF mapping protocol was implemented as described previously5,6 based on a 3D spoiled gradient-echo sequence with the following scans: magnetization-transfer-weighted (TR=32 ms, flip angle (FA)=8°); reference with the same parameters and without off-resonance saturation; T1-weighted (TR=20 ms, FA=20°); and proton-density-weighted (TR=20 ms, FA=4°). All images were acquired with multi-shot echo-planar imaging (EPI) readout (EPI factor 9); TE=6.3 ms; voxel size 1.49×1.50×5.0 mm3 (interpolated to 0.78×0.78×2.50 mm3); and two signal averages.The block of MPF mapping sequences with the total duration about one minute was repeated from two to four times to mitigate motion problems. After exclusion of motion-corrupted datasets, images were averaged during post-processing as detailed earlier.5 For ADC mapping, a 2D single-shot diffusion-weighted EPI sequence was used with the following parameters: TR/TE = 2940/64 ms; three diffusion directions; b-values of 0, 125, 251, 376, and 501 s/mm2; in-plane resolution 2.01×2.36 mm2 (interpolated to 1.21×1.21 mm2); twelve 5 mm slices; two signal averages; and scan time 79 s.
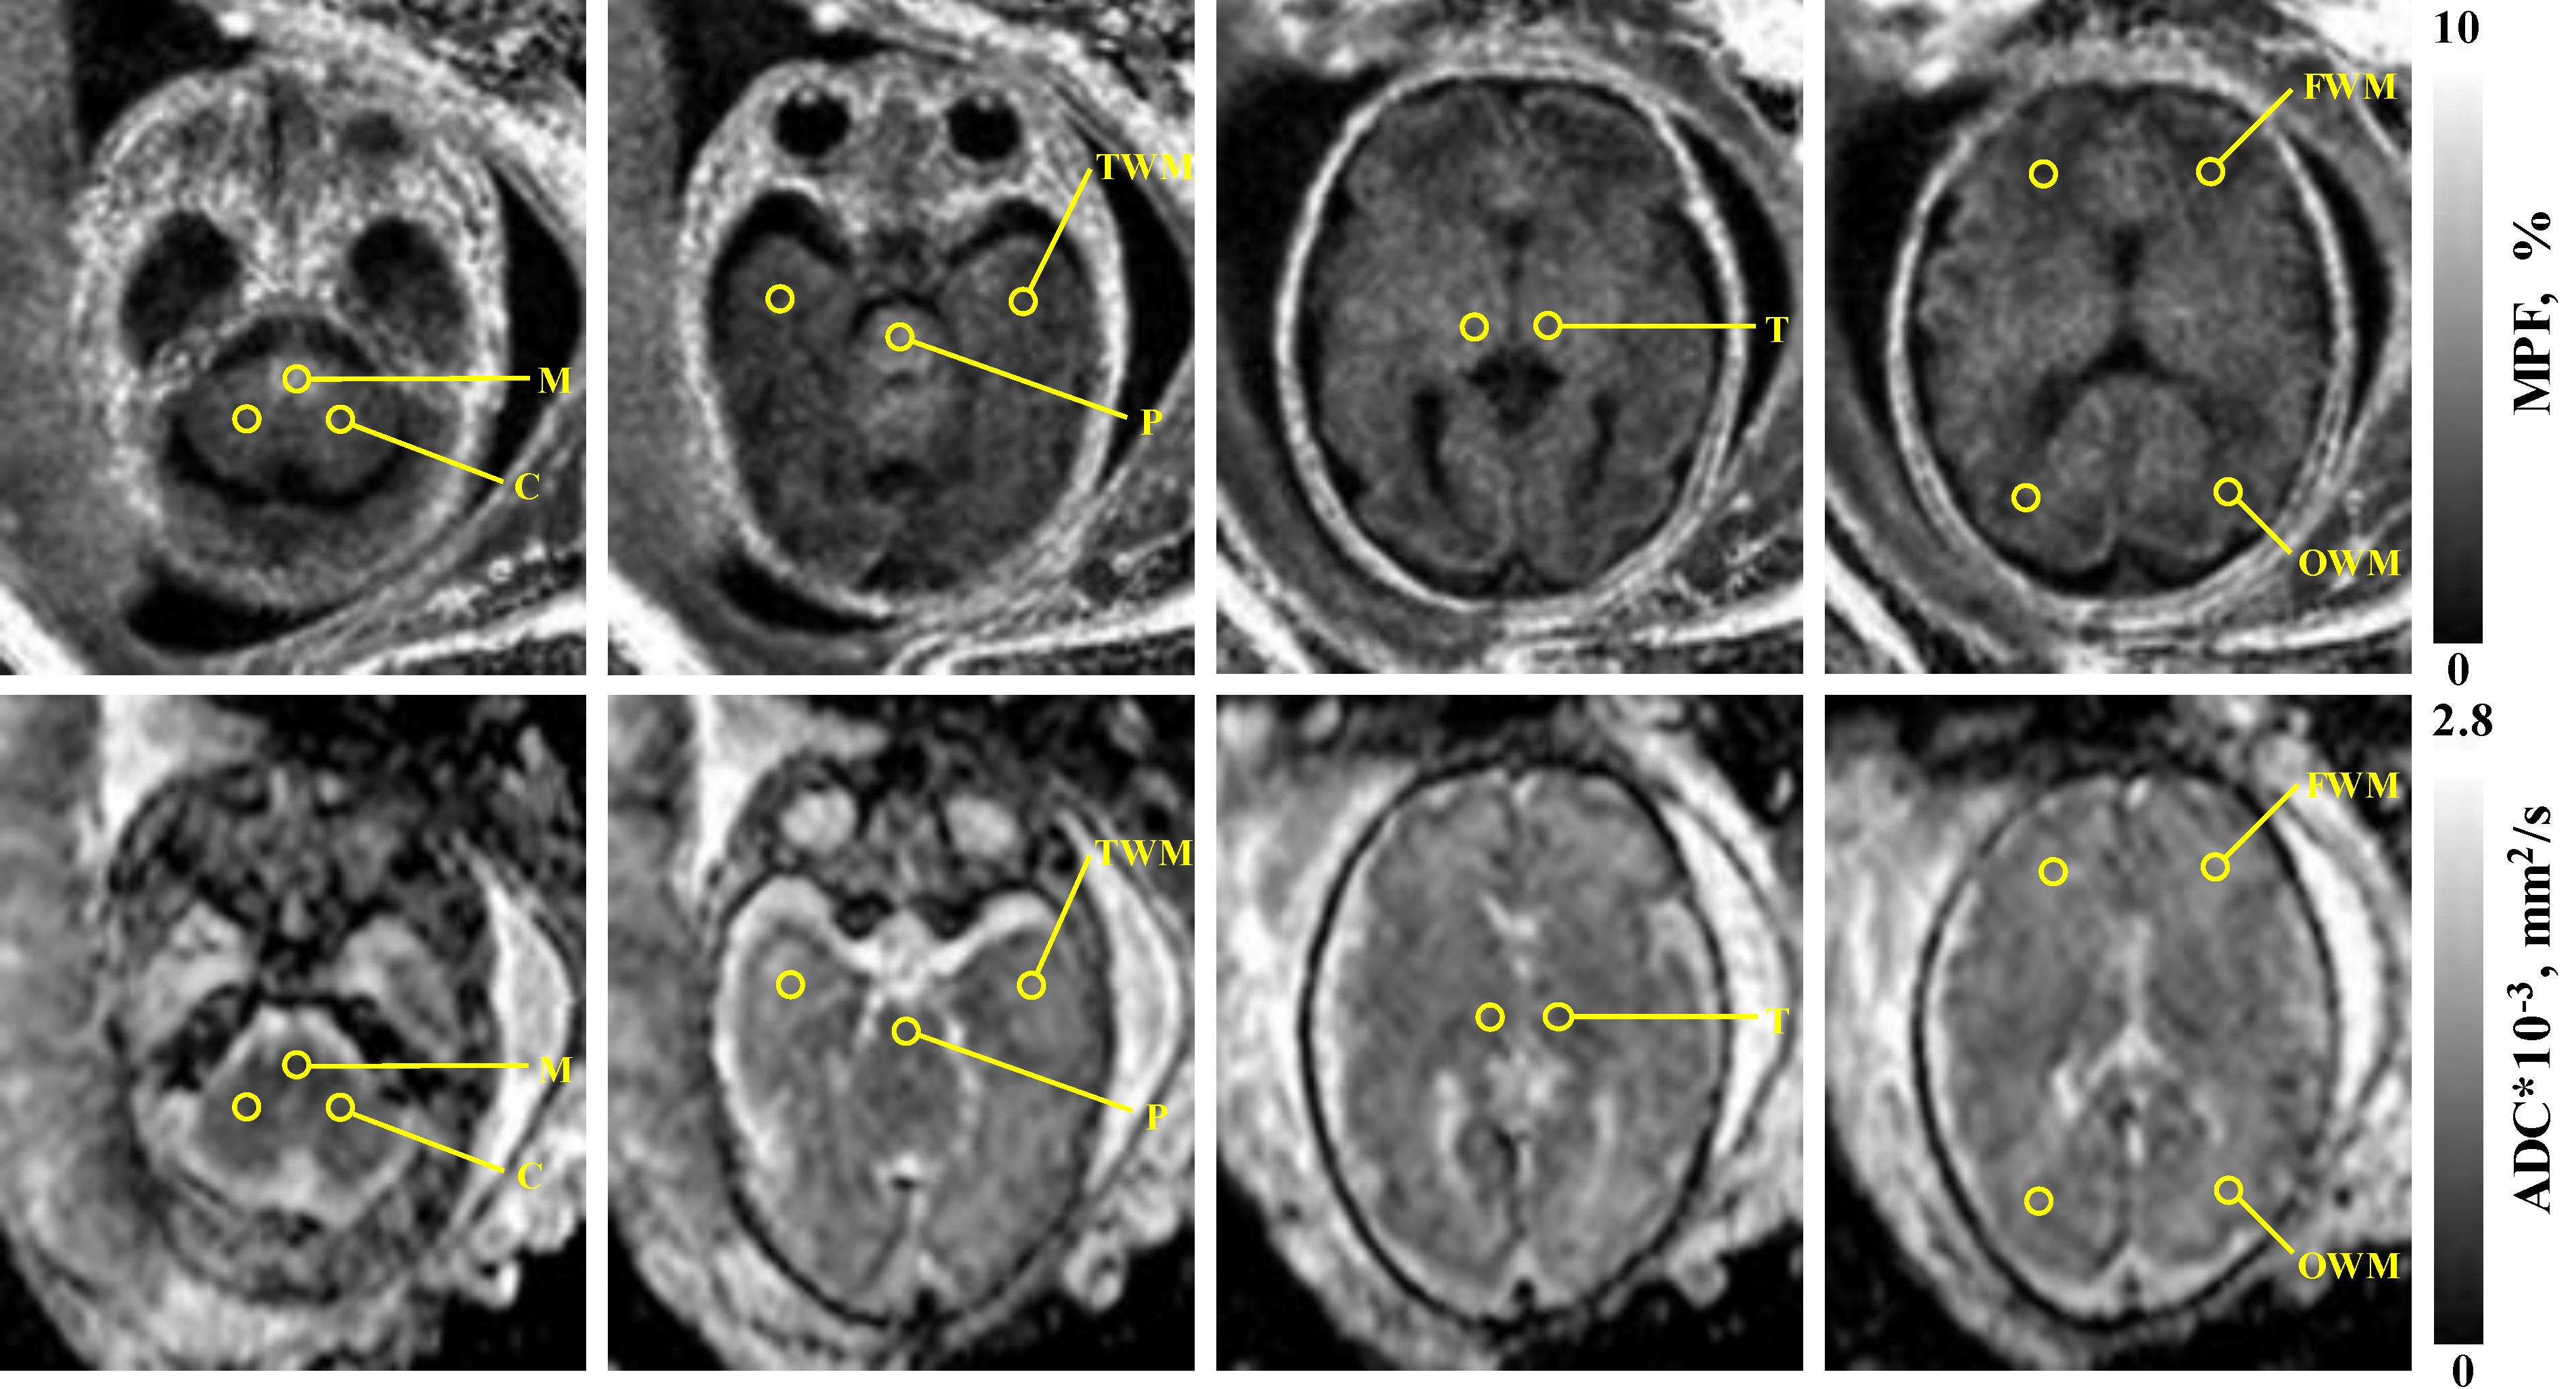
Image processing and analysis: MPF maps were reconstructed using the single-point algorithm.7 ADC maps were generated by the scanner’s software. Two operators measured ADC and MPF in the medulla, pons, cerebellum, thalamus, and frontal, occipital, and temporal cerebral white matter (WM). The scheme of the regions-of-interest placement is illustrated in Fig. 1.
Statistical analysis: Inter-observer agreement was assessed by the within-subject coefficient of variation (CV) and intraclass correlation coefficient (ICC) for each anatomic region. Mixed repeated-measures ANOVA was used to compare MPF and ADC between brain structures (within-subject factor) and pregnancy trimesters (between-subject factor). Pairwise differences were assessed by Tukey post-hoc test. Associations between ADC, MPF, and GA were tested using the Pearson correlation coefficient (r). Correlation coefficients were compared using Hotelling-Williams test. Significance was defined as P<0.05.
RESULTS
Inter-observer agreement in MPF and ADC measurements was good-to-excellent with ICC ranging between 0.71-0.97 and CV of 4-9%. ANOVA identified highly significant effects of the brain structure (F=74.2, P<0.0001 for ADC; F=216.0, P<0.0001 for MPF), pregnancy trimester (F=11.1, P=0.002 for ADC; F= 41.1, P<0.0001 for MPF) and their interaction (F=7.7, P<0.0001 for ADC; F= 42.0, P<0.0001).
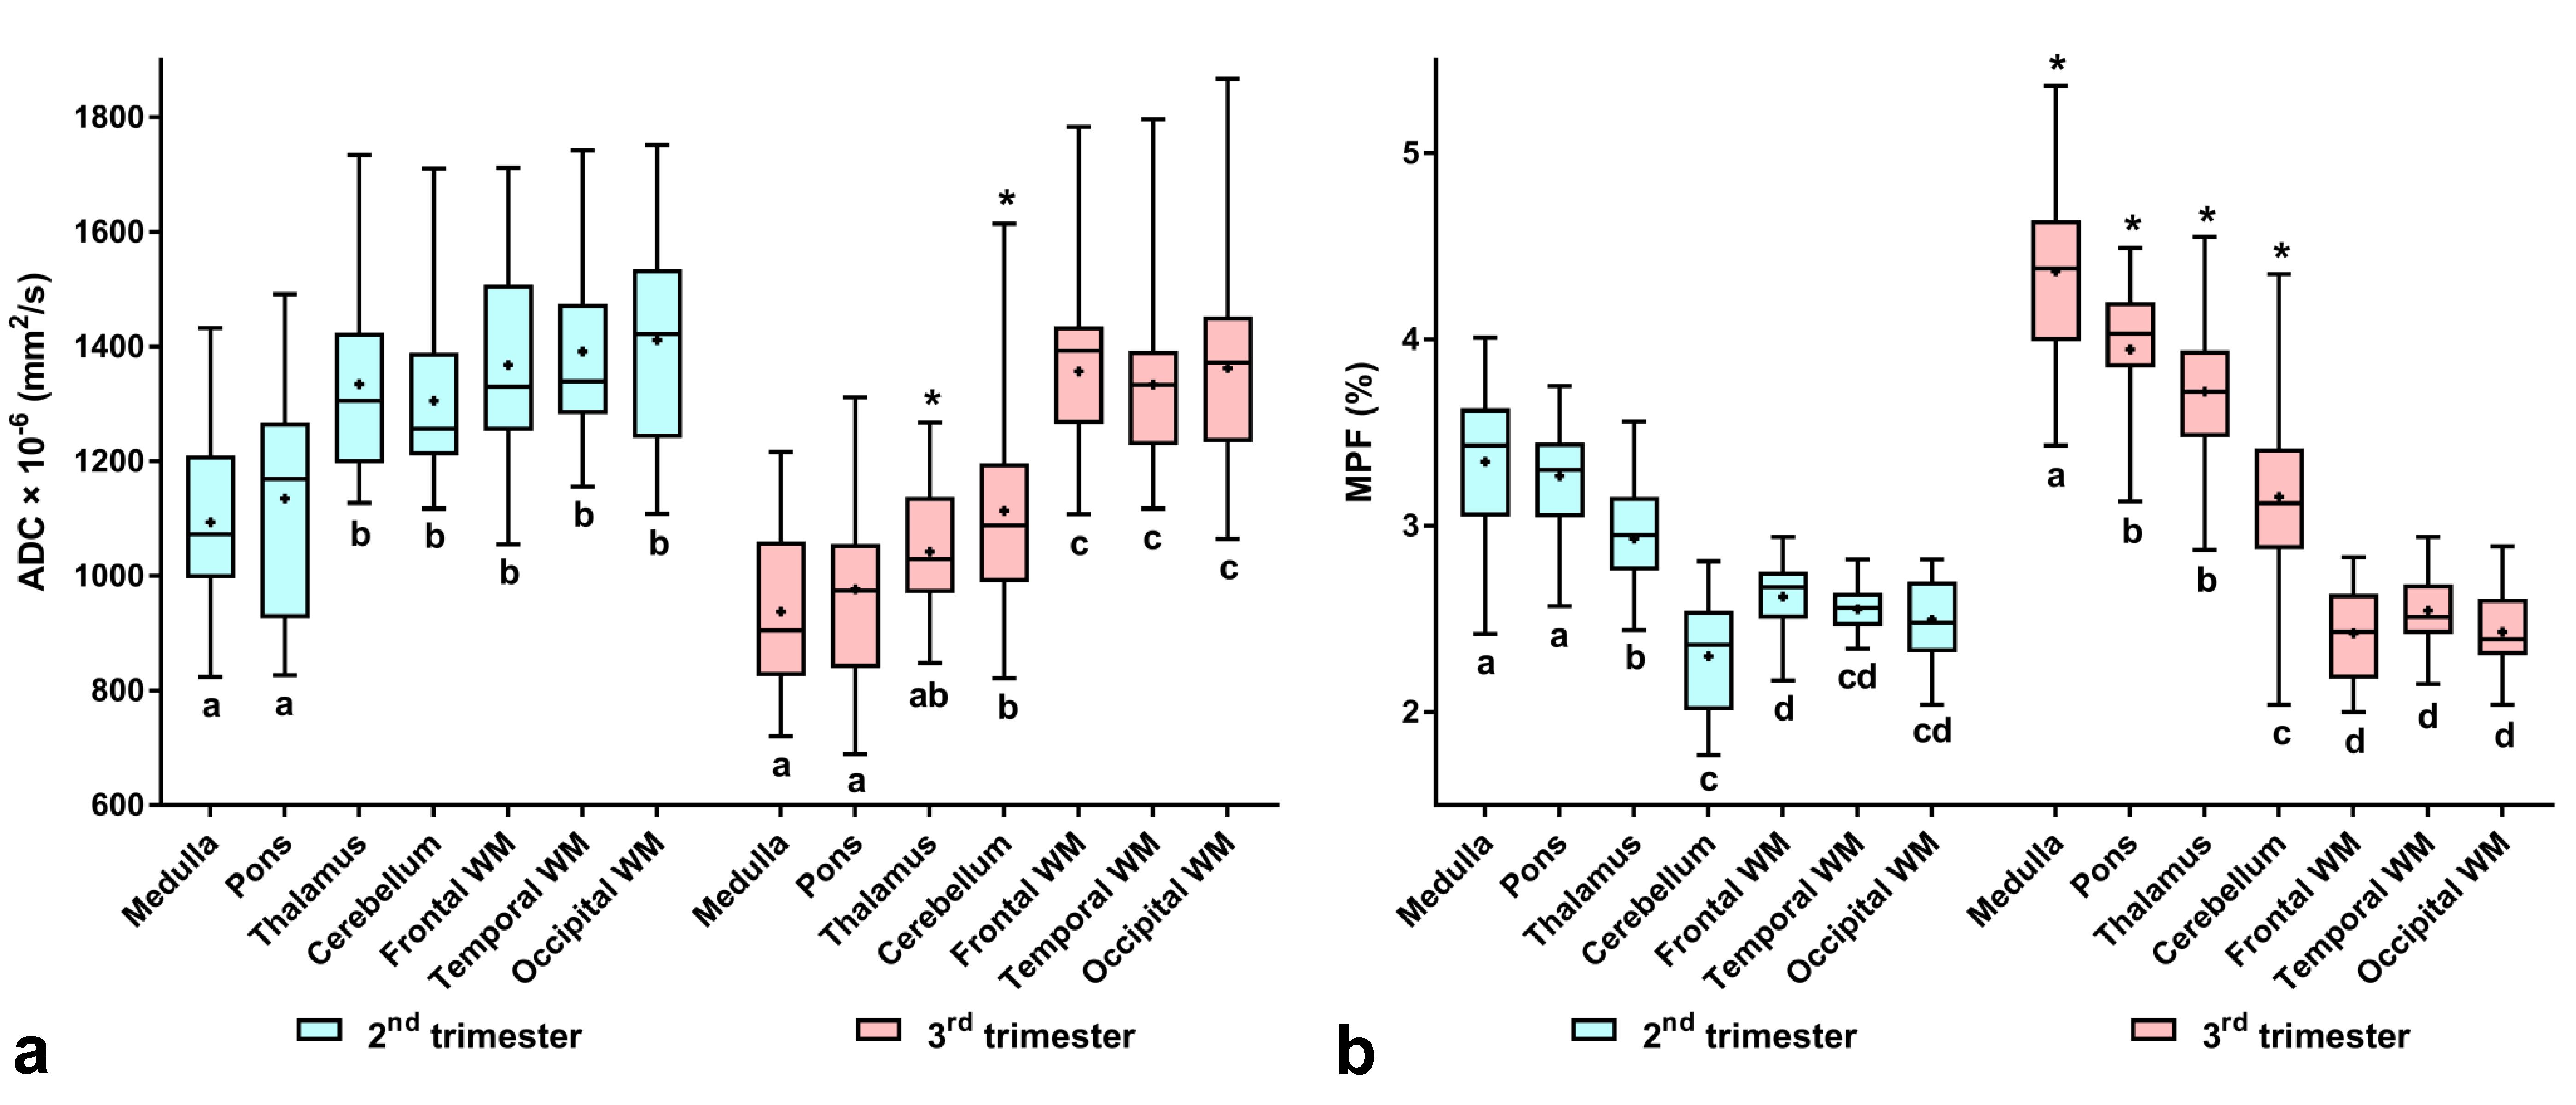
Mean MPF and ADC across trimesters and structures are summarized in Fig. 2. From 2nd to 3rd trimester, MPF significantly increased in the medulla, pons, thalamus, and cerebellum. ADC significantly decreased in the thalamus and cerebellum. Both MPF and ADC showed an apparent pattern of divergence between brain structures in the 3rd trimester compared to the 2nd one (Fig. 2). Within this pattern, MPF demonstrated more pairwise distinctions, which appeared statistically significant (Fig. 2). ADC and MPF in 2nd trimester were significantly different between the two groups, one of which included brainstem structures (medulla and pons) with higher MPF and lower ADC and another contained the thalamus, cerebellum, and cerebral WM with lower MPF and higher ADC. Additionally, MPF in the thalamus was intermediate between the above groups, being significantly different from both. In the 3rd trimester, cerebral WM showed significantly lower MPF and higher ADC than any other structure. Notably, the difference in MPF between the medulla and pons became significant in the 3rd trimester with the largest value in the medulla.
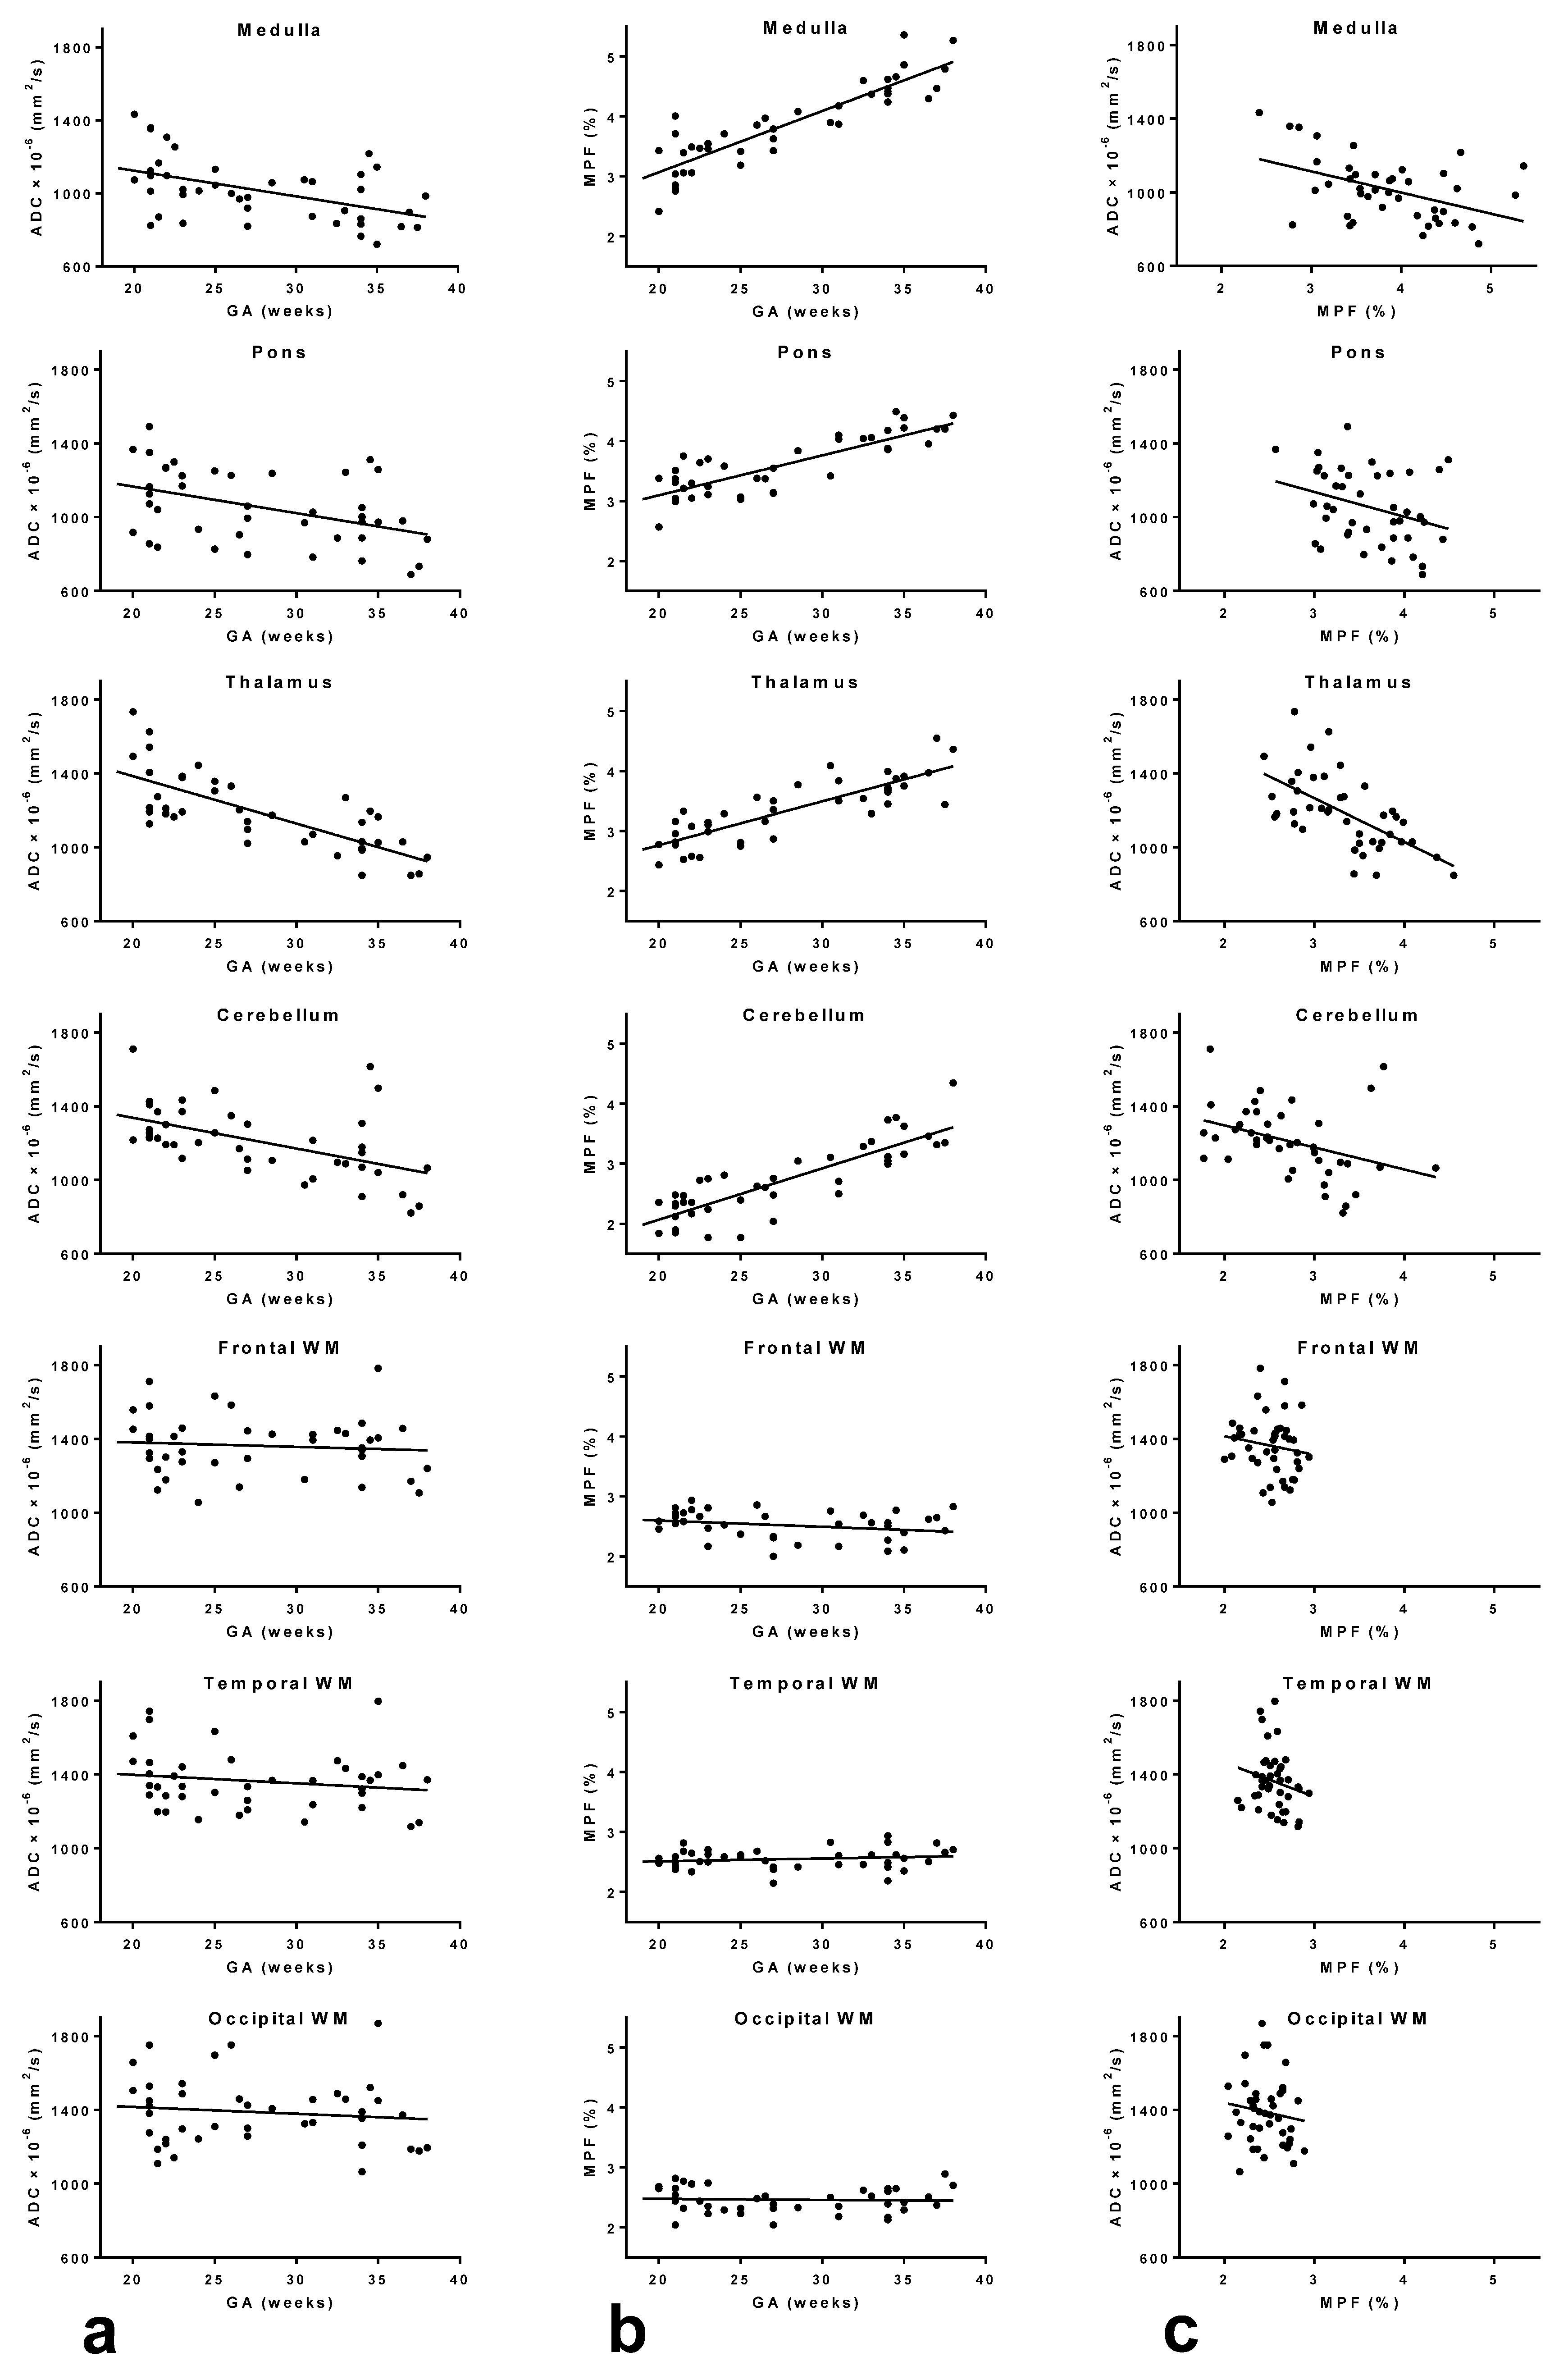
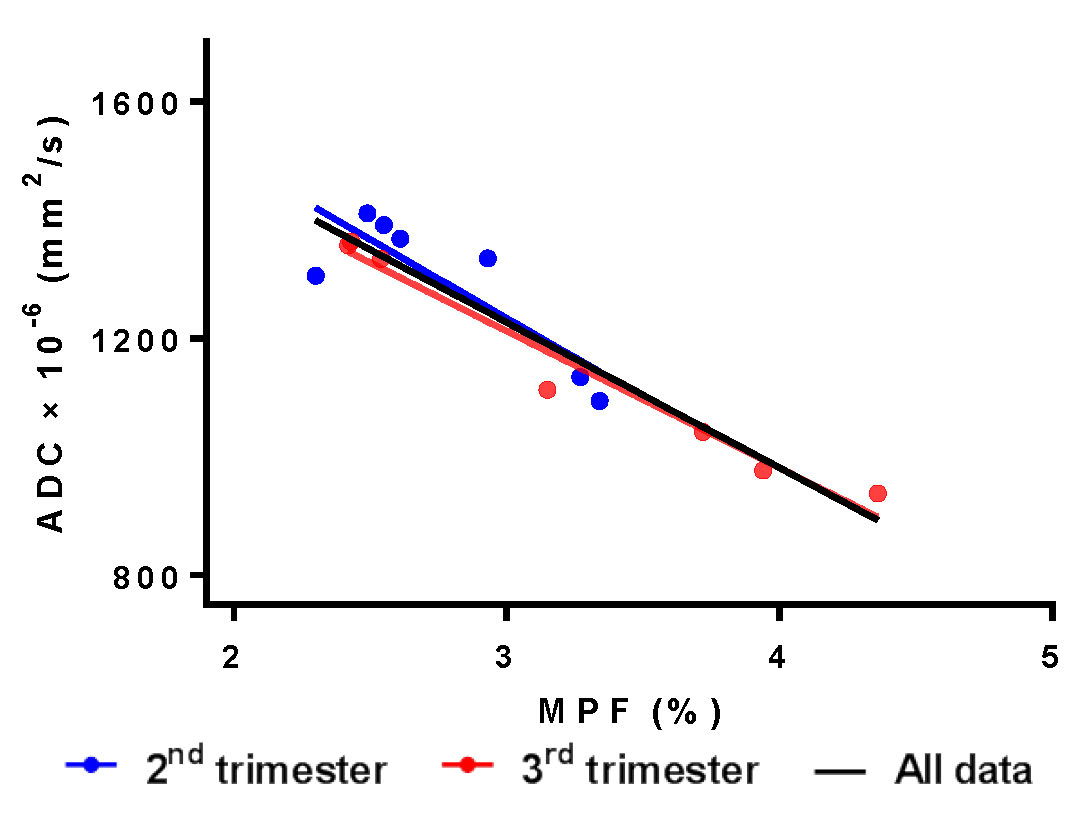
MPF (r range 0.83-0.89, P<0.001) and ADC (r range -0.43--0.75, P≤0.004) significantly correlated with GA and each other (r range -0.32--0.60, P≤0.04) in the medulla, pons, thalamus, and cerebellum (Fig. 3). No significant correlations and distinctions between regions and trimesters were observed for cerebral WM. Correlations with GA were significantly stronger for MPF compared to ADC in the medulla, pons, and cerebellum (P<0.003). Structure-averaged MPF and ADC values strongly correlated (r=0.95, P<0.001) (Fig. 4).
CONCLUSIONS
MPF and ADC demonstrated qualitatively similar but quantitatively different spatiotemporal patterns associated with changes in the brain structures with known prenatal onset of myelination (brainstem, thalamus, and cerebellum), as opposed to cerebral WM, which appears unmyelinated in the fetal brain.8-10 MPF provided a more sensitive measure of the fetal brain myelination.Acknowledgements
This study was supported by the Ministry of Education and Science of the Russian Federation within the State Assignment Project No. 18.2583.2017/4.6. Drs. Korostyshevskaya and Savelov received salary support from the Federal Agency of Scientific Organizations of the Russian Federation (Project No. 0333-2017-0003). Software for reconstruction of MPF maps was distributed under support of NIH grant 1R24NS104098-01A1.References
1. Righini A, Bianchini E, Parazzini C, et al. Apparent diffusion coefficient determination in normal fetal brain: a prenatal MR imaging study. AJNR Am J Neuroradiol 2003;24:799-804.
2. Bui T, Daire JL, Chalard F, et al. Microstructural development of human brain assessed in utero by diffusion tensor imaging. Pediatr Radiol 2006;36:1133-1140.
3. Schneider JF, Confort-Gouny S, Le Fur Y, et al. Diffusion-weighted imaging in normal fetal brain maturation. Eur Radiol 2007;17:2422-2429.
4. Schneider MM, Berman JI, Baumer FM, et al. Normative apparent diffusion coefficient values in the developing fetal brain. AJNR Am J Neuroradiol 2009;30:1799-1803.
5. Yarnykh VL, Prihod'ko IY, Savelov AA, Korostyshevskaya AM. Quantitative assessment of normal fetal brain myelination using fast macromolecular proton fraction mapping. AJNR Am J Neuroradiol. 2018;39:1341-1348.
6. Korostyshevskaya AM, Savelov AA, Papusha LI, Druy AE, Yarnykh VL. Congenital medulloblastoma: Fetal and postnatal longitudinal observation with quantitative MRI. Clin Imaging 2018;52:172-176.
7. Yarnykh VL. Fast macromolecular proton fraction mapping from a single off-resonance magnetization transfer measurement. Magn Reson Med 2012;68:166-178.
8. Yakovlev PI, Lecours AR. The myelogenetic cycles of regional maturation of the brain. In: Minkowski A, ed. Regional development of the brain in early life. Oxford, UK: Blackwell; 1967:3-70.
9. Kinney HC, Brody BA, Kloman AS, Gilles FH. Sequence of central nervous system myelination in human infancy. II. Patterns of myelination in autopsied infants. J Neuropathol Exp Neurol 1988 ;47:217-234.
10. Hasegawa M, Houdou S, Mito T, Takashima S, Asanuma K, Ohno T. Development of myelination in the human fetal and infant cerebrum: a myelin basic protein immunohistochemical study. Brain Dev 1992;14:1-6.
Figures