0626
Dynamic glucoCEST MRI detects regional changes in cerebral glucose uptake in Alzheimer’s disease at 3T1Department of Biomedical Engineering, City University of Hong Kong, Hong Kong, China, 2F.M. Kirby Research Center for Functional Brain Imaging, Kennedy Krieger Research Institute, Baltimore, MD, United States, 3Russell H. Morgan Department of Radiology and Radiological Science, The Johns Hopkins University School of Medicine, Baltimore, MD, United States, 4Department of Electrical and Electronic Engineering, The University of Hong Kong, Hong Kong, China
Synopsis
Alzheimer’s disease (AD) is affecting over 50 million people globally. Altered glucose uptake is an early hallmark in AD. Here, we apply glucoCEST, in particular, dynamic glucose enhanced (DGE) MRI to study regional glucose uptake in AD at 3T. First, we optimize saturation parameters, and then we apply these parameters to study glucose uptake in AD mice. Moreover, we use a piecewise exponential fitting to extract specific changes related to glucose uptake and utilization. Results showed a global and regional decrease in cerebral glucose uptake in AD mice compared to WT, which could be an effective mean for early diagnosis.
Introduction
Cerebral glucose uptake is one of the hallmarks of Alzheimer’s disease (AD) in mice overexpressing amyloid precursor protein (APP) (1, 2). We and others have demonstrated that glucose chemical exchange saturation transfer (glucoCEST) or dynamic glucose enhanced (DGE) MRI are capable of detecting glucose uptake and perfusion-related parameters in brain (3-13). Most of the DGE studies are performed at high fields (≥7T), where the CEST contrast is different from that at 3T, but a preliminary study at 3T has been published (14). Here, we aim to optimize and characterize glucoCEST and DGE at 3T. We found that saturation parameters and contributions to the DGE signal are quite different from those at high field. Furthermore, we applied optimized DGE saturation parameters to study glucose uptake in AD mice and quantitatively analyzed these findings by a piecewise exponential fitting. A lower glucose uptake was found in the brain of AD mouse compare to the age-matched WT, which could be valuable for AD diagnosis.Methods
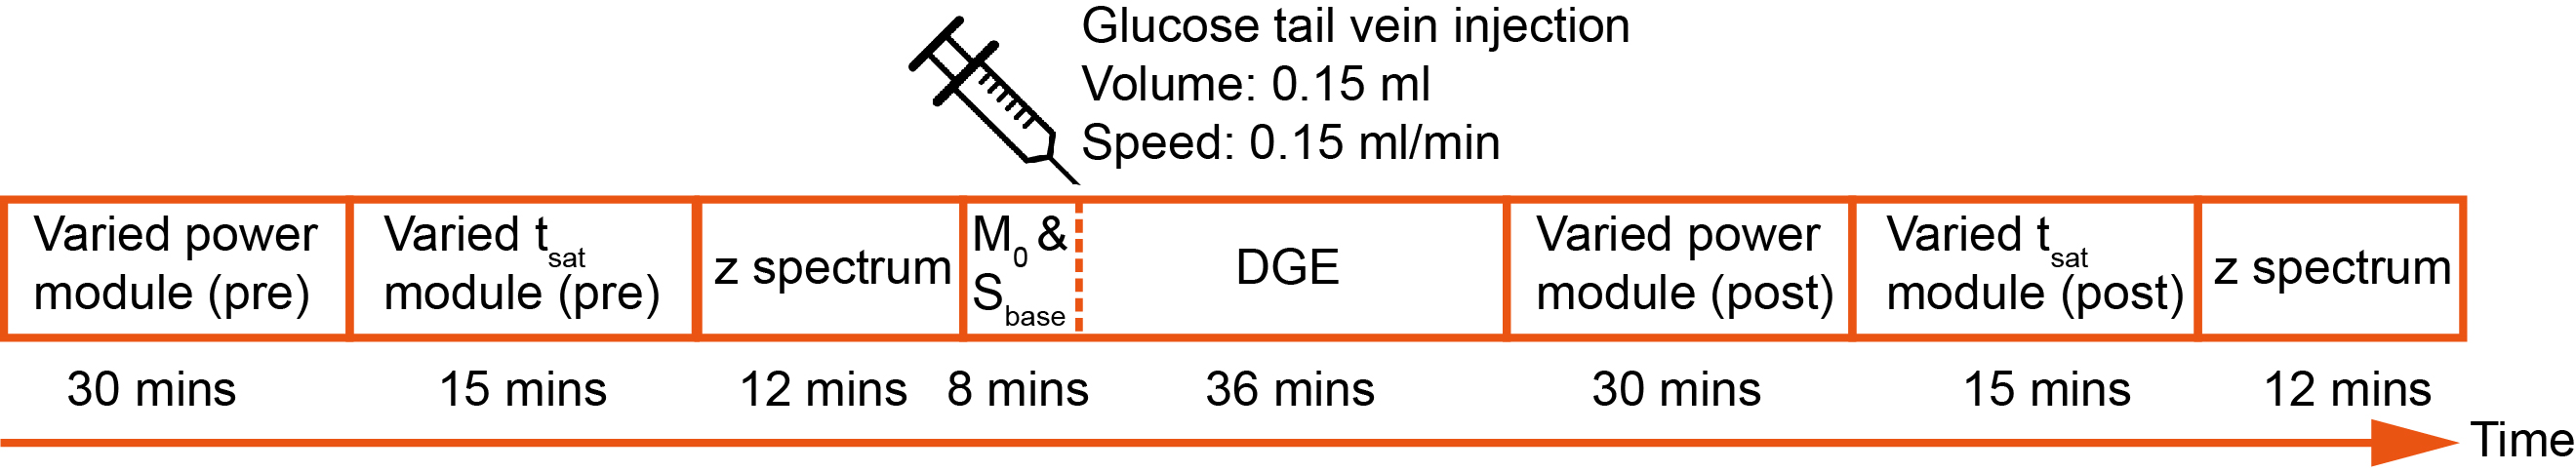
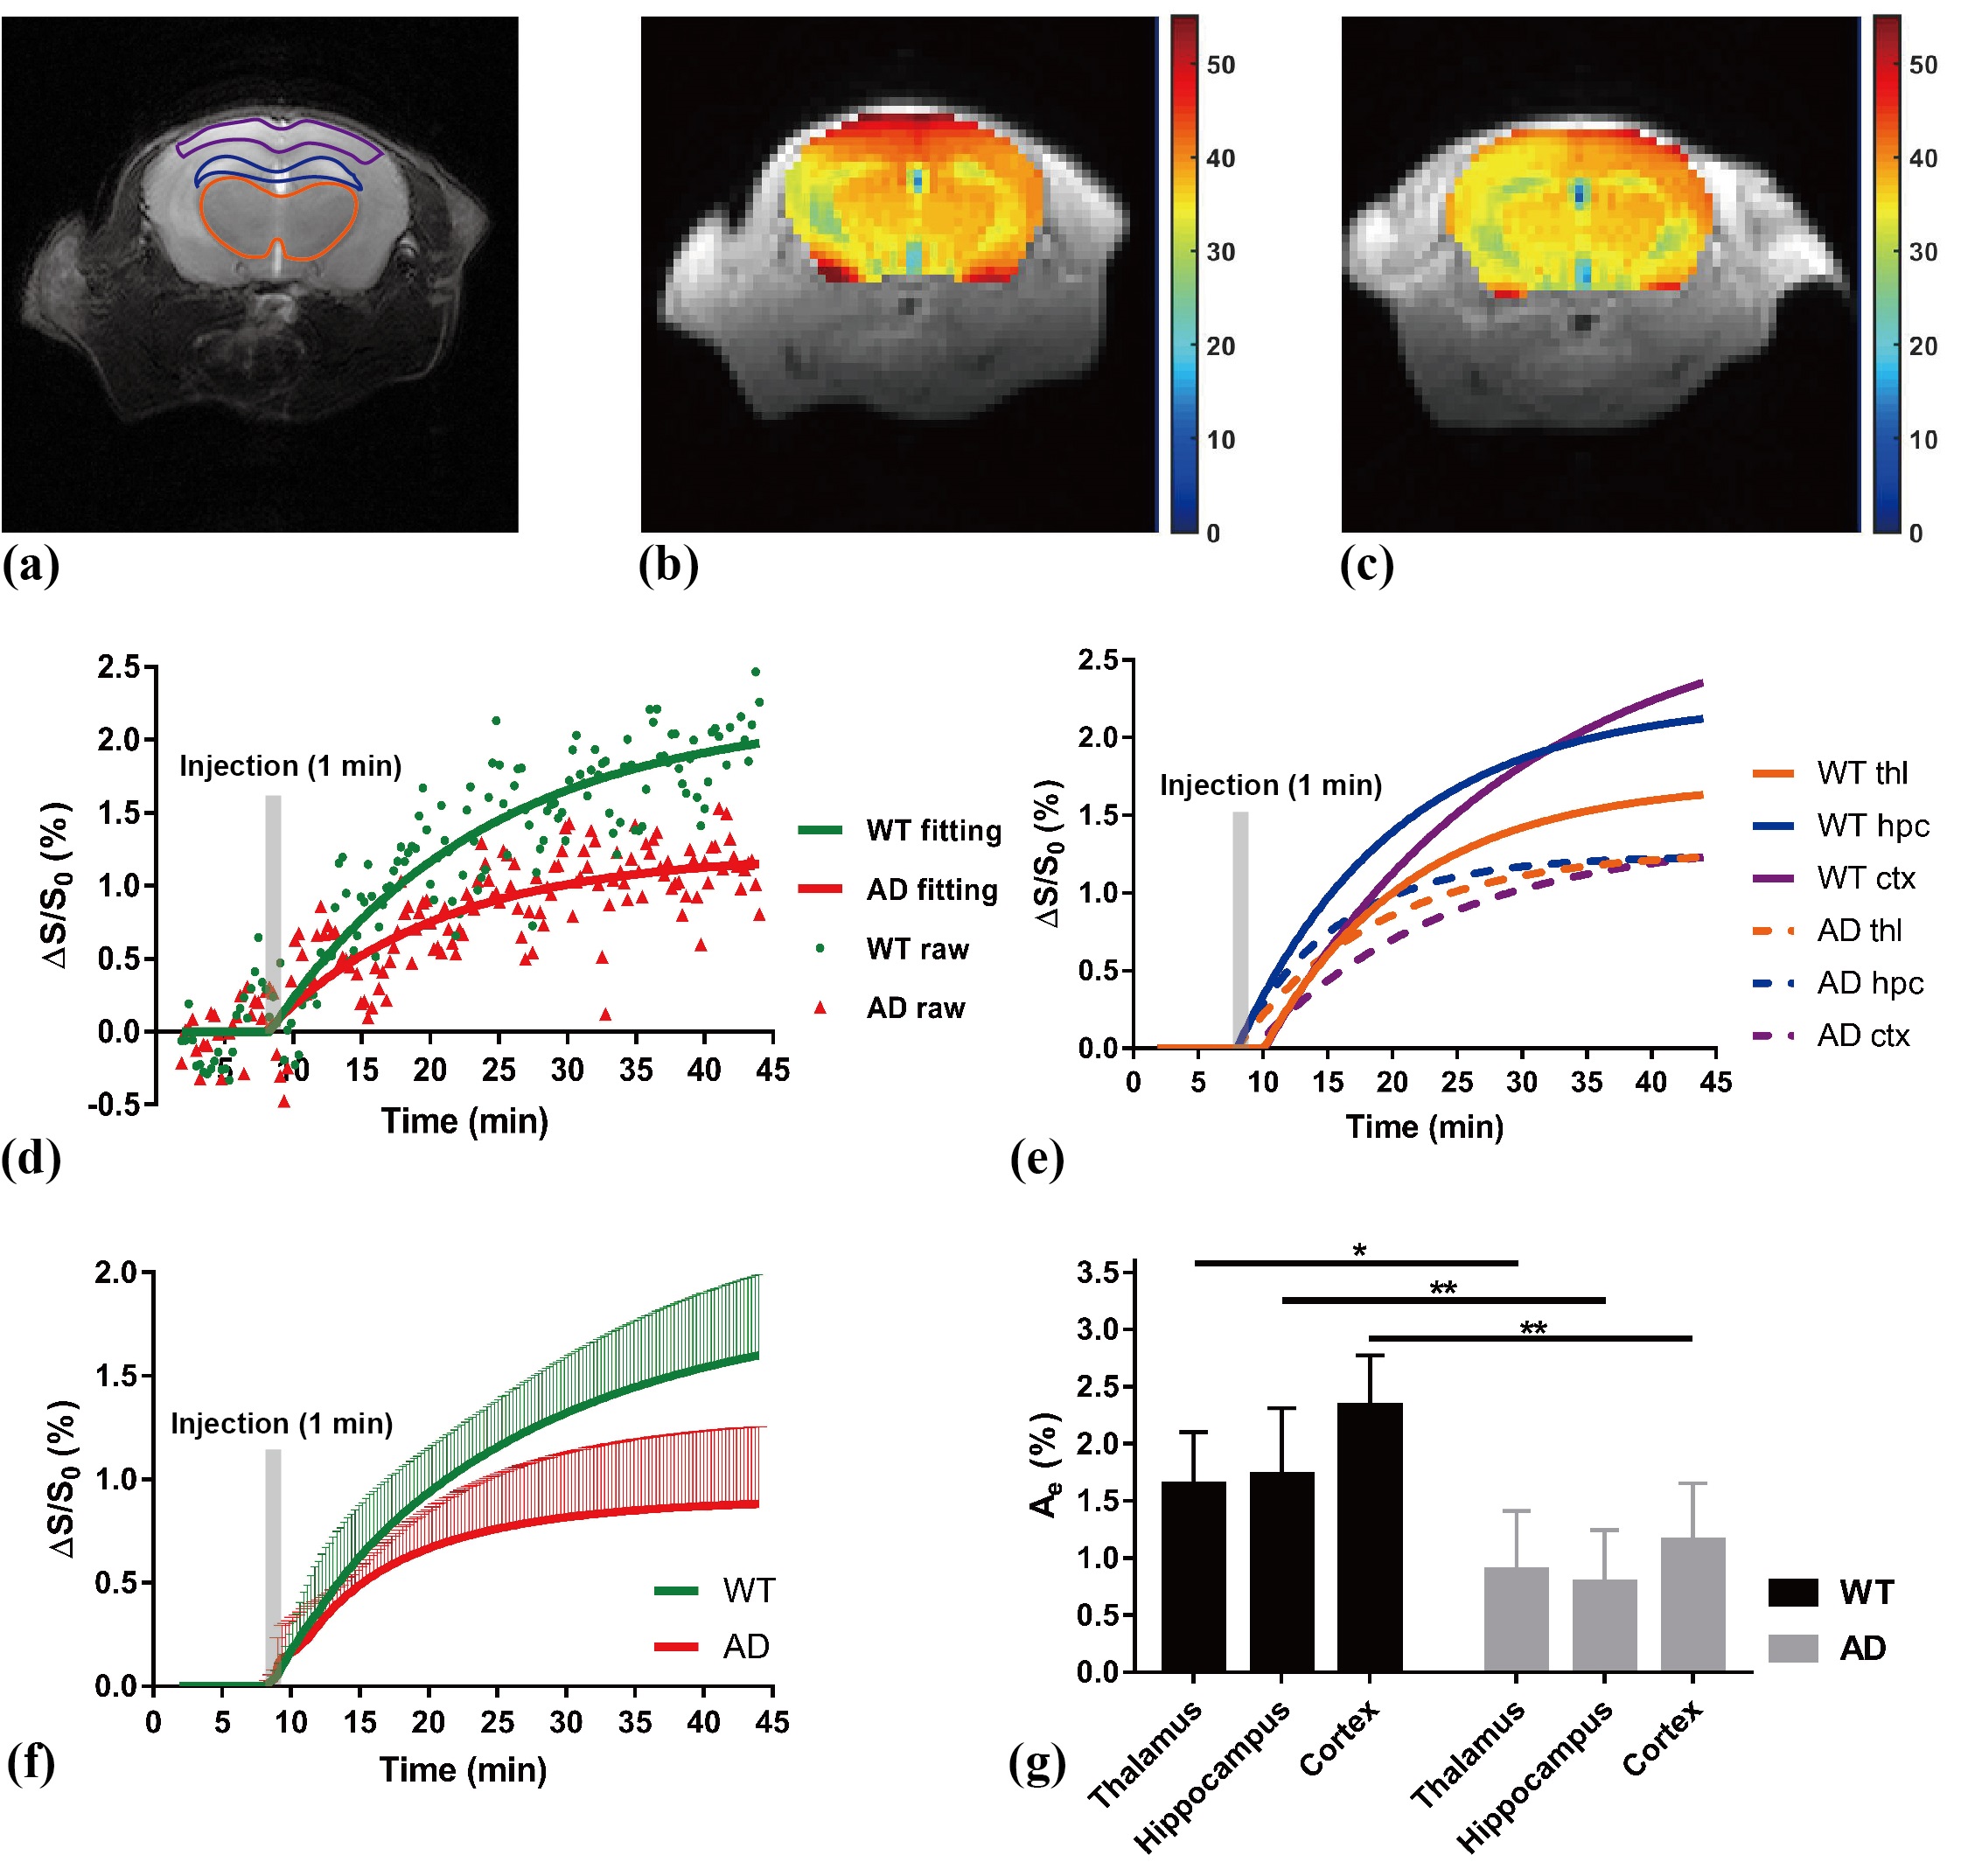
AD (APP/PS1) mice (n=5) and age-matched WT mice (n=5) at 18-month-old were imaged on a horizontal bore 3T animal scanner (Bruker BioSpec) equipped with a quadrature transmit coil and a mouse brain surface coil. For continuous-wave (CW) saturation power (B1) optimization, DGE images were acquired at a frequency of 1.2 ppm with B1 values from 0 to 2.0 μT with a fixed saturation time (tsat)=2 s. In tsat optimization, images were acquired with saturation time varied from 0.5 to 4 s with 0.5 s step size and a fixed B1=0.6 μT. All images were acquired using a RARE sequence with RARE factor=16 and image size=64×64. The detailed acquisition scheme is shown in Fig. 1. DGE curve was fitted by a piecewise exponential model:$$DGE = \begin{cases}0 & t < t_{r}\\A_{e}\cdot(1-exp(-t/T)) & t \geq t_{r}\end{cases}$$ where tr indicates the time cerebral glucose starts to rising, T is the reciprocal of rising rate and Ae represents the amplitude of glucose uptake at equilibrium. Area-under-curve (AUC) maps were also calculated to evaluate the results (5).Results
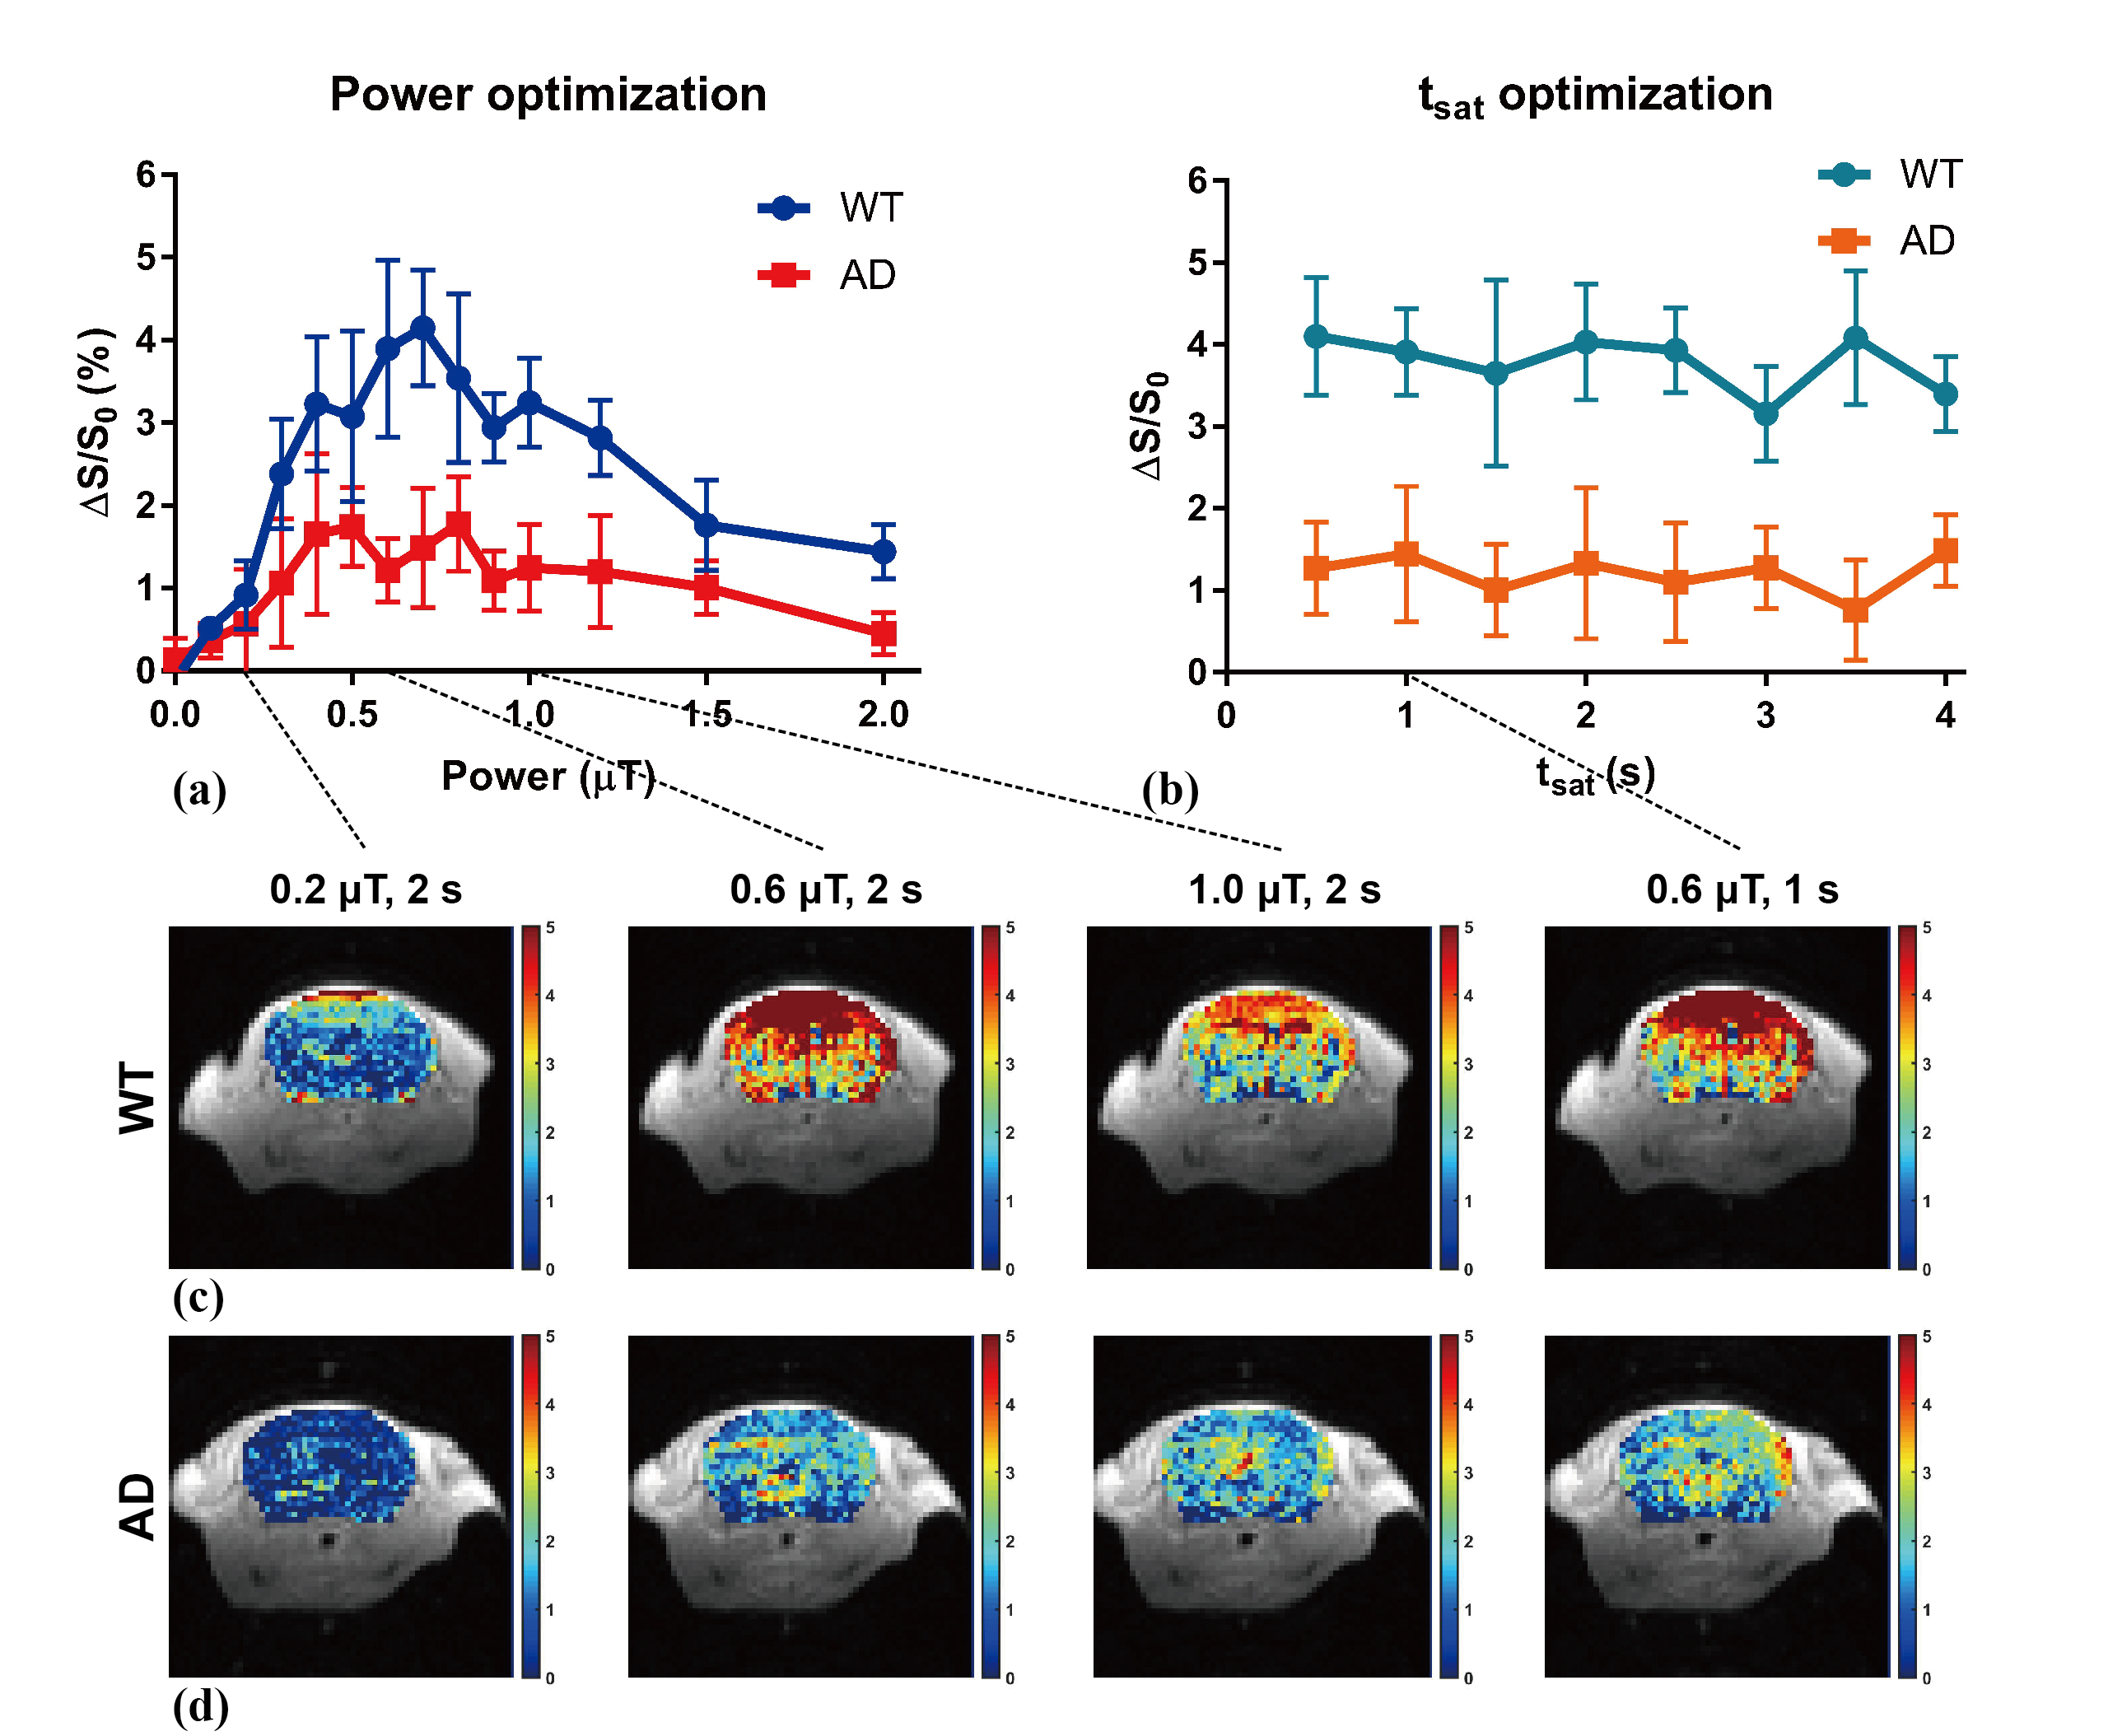
We found that the optimum value of B1 at 1.2 ppm offset is between 0.5 and 0.7 μT on both WT and AD mice (Fig.2a). The enhancement remained steady when tsat is less than 2 s. Therefore, we chose saturation parameters of B1=0.6 μT and tsat=2 s in the DGE experiment. The fitting model can match the raw DGE data quite well (Fig 3d). In both raw and fitting results, a lower glucose uptake was observed in AD compared to WT. Interestingly, regional uptakes in thalamus, hippocampus and cortex are consistently lower in AD (Fig. 3e), which are significantly lower than WT according to Ae comparison (Fig. 3g). The largest decrease in DGE signal amplitude was found in cortex, namely 1.18±0.37%. This lower glucose uptake in AD than in WT was consistently observed in multiple animals (n=5; Fig. 3f). The regional differences in glucose uptake are shown in AUC maps (20 minutes) (Fig. 3b and c).Discussion
We and others have shown the DGE technique to study the neural pathology related to glucose uptake, especially in brain tumors. Our study highlights several new aspects. First, we optimized DGE saturation parameters at 1.2 ppm for CW-CEST and found that the optimal B1 at around 0.5 to 0.7 μT at 3T vs at >1.5 μT at high field (6, 7), which may result from scaling effect of strong MTC and DS (15). Second, we fitted the DGE data using a piecewise model, which assist us compare the DGE curve between AD and WT mouse. This provides some useful fitted parameters, such as tr and Ae, which are related to glucose perfusion in mouse brain. Third, we observed that the DGE signal was consistently lower in AD mice compared to WT mice. Interestingly, we found that the regional (such as thalamus, hippocampus and cortex) glucoCEST contrast of AD mice was significantly (Fig. 3g, P<0.05, <0.01 and <0.01 respectively) lower than that of WT mice. Overall, the hippocampus had the lowest glucoCEST contrast among these regions.Conclusion
We optimized and applied DGE to study glucose uptake and utilization in AD and WT mice at 3T. The results showed that both saturation parameters and CEST contrast are different from those at high field. Moreover, we applied an exponential fitting to analyze the DGE data to study regional changes. We observed a significantly lower glucose uptake in AD mouse, especially in hippocampus, cortex and thalamus. These findings at 3T are valuable for clinical translation of DGE, especially for early diagnosis in AD and disease stratification.Acknowledgements
CityU 9610362, 9042620, 7200516, 7004859 and 6000612.References
[1] Niwa K, Kazama K, Younkin SG, Carlson GA, Iadecola C. Alterations in cerebral blood flow and glucose utilization in mice overexpressing the amyloid precursor protein. Neurobiology of disease 2002;9(1):61-68.
[2] Beglopoulos V, Tulloch J, Roe A, Daumas S, Ferrington L, Watson R, et al. Early detection of cryptic memory and glucose uptake deficits in pre-pathological APP mice. Nature communications 2016;7:11761
[3] Chan KW, McMahon MT, Kato Y, Liu G, Bulte JW, Bhujwalla ZM, et al. Natural D-glucose as a biodegradable MRI contrast agent for detecting cancer. Magn Reson Med 2012;68(6):1764-1773.
[4] Walker-Samuel S, Ramasawmy R, Torrealdea F, Rega M, Rajkumar V, Johnson SP, et al. In vivo imaging of glucose uptake and metabolism in tumors. Nat Med 2013;19(8):1067.
[5] Jin T, Mehrens H, Hendrich KS, Kim S-G. Mapping brain glucose uptake with chemical exchange-sensitive spin-lock magnetic resonance imaging, J Cereb Blood Flow Metab 2014;34(8):1402-1410.
[6] Xu X, Chan KW, Knutsson L, Artemov D, Xu J, Liu G, et al. Dynamic glucose enhanced (DGE) MRI for combined imaging of blood–brain barrier break down and increased blood volume in brain cancer. Magn Reson Med 2015;74(6):1556-1563.
[7] Xu X, Yadav NN, Knutsson L, Hua J, Kalyani R, Hall E, et al. Dynamic glucose-enhanced (DGE) MRI: translation to human scanning and first results in glioma patients. Tomography: a journal for imaging research 2015;1(2):105.
[8] Schuenke P, Paech D, Koehler C, Windschuh J, Bachert P, Ladd ME, et al. Fast and quantitative T1ρ-weighted dynamic glucose enhanced MRI. Scientific Reports 2017;7:42093.
[9] Tolomeo D, Micotti E, Serra SC, Chappell M, Snellman A, Forloni G. Chemical exchange saturation transfer MRI shows low cerebral 2-deoxy-D-glucose uptake in a model of Alzheimer’s Disease. Scientific Reports 2018;8(1):9576.
[10] Jin T, Mehrens H, Wang P, Kim S-G. Chemical exchange-sensitive spin-lock MRI of glucose analog 3-O-methyl-d-glucose in normal and ischemic brain. J Cereb Blood Flow Metab 2018;38(5):869-880.
[11] Paech D, Schuenke P, Koehler C, Windschuh J, Mundiyanapurath S, Bickelhaupt S, et al. T1ρ-weighted Dynamic Glucose-enhanced MR Imaging in the Human Brain. Radiology 2017;285(3):914-922.
[12] Schuenke P, Koehler C, Korzowski A, Windschuh J, Bachert P, Ladd ME, et al. Adiabatically prepared spin-lock approach for T1ρ-based dynamic glucose enhanced MRI at ultrahigh fields. Magn Reson Med 2017;78(1):215-225.
[13] Sehgal AA, Li Y, Lal B, Yadav NN, Xu X, Xu J, et al. CEST MRI of 3-O-methyl-D-glucose uptake and accumulation in brain tumors. Magn Reson Med 2018.
[14] Xu X, Sehgal A, Yadav NN, Knutsson L, Laterra J, Pomper M, et al. Dynamic Glucose Enhanced Imaging at 3T: First Human Data. Proceedings of the 25th Annual Meeting of the ISMRM, 2017, Honolulu, p.0193.
[15] Chen L, Barker PB, Weiss RG, van Zijl PC, Xu J. Creatine and phosphocreatine mapping of mouse skeletal muscle by a polynomial and Lorentzian line-shape fitting CEST method. Magn Reson Med 2018.
Figures