0625
White Matter Damage of Alzheimer’s Disease using Magnetization Transfer Imaging1Department of Computer Science, State University of New York at Binghamton, Binghamton, NY, United States, 2Department of Psychology, University of Pittsburgh, Pittsburgh, PA, United States, 33. Department of Psychiatry and Neurology, University of Pittsburgh, Pittsburgh, PA, United States, 4Department of Radiation Oncology, Washington University, Saint Louis, WA, United States
Synopsis
The magnetization transfer rate has not been widely used as a biomarker for Alzheimer’s disease (AD). In this study, we measured the magnetization transfer rates in the cardiovascular health study (CHS) cognition study (CHS-CS) cohort at 1.5 T by acquiring T1 maps with and without off-resonance saturation. The magnetization transfer rates were analyzed both cross-sectionally and longitudinally. The longitudinal analysis indicated that damage to white matter regions in the frontal lobe may be associated with AD progression. The study findings demonstrated that the magnetization transfer rate of frontal white matter may be a promising biomarker for
Introduction
Biomarkers for Alzheimer’s disease (AD) are crucial for early diagnosis and treatment monitoring once therapies become available. The magnetization transfer rate is the rate at which the tissue magnetization is transferred to surrounding macromolecules and is a biomarker for tissue health. The magnetization transfer rate has been explored but not widely used to study AD 1,2. The purpose of this study was to determine if the magnetization transfer rate is useful as an imaging biomarker for detecting and monitoring the progression of AD.Theory
Brain tissue T1 maps can be measured with ($$$T_{1sat}$$$) and without off-resonance saturation ($$$T_{1nosat}$$$) pulses. The difference of the inverse T1 maps ($$$1/T_{1sat} - 1/T_{1nosat}$$$, see Equations below) reflects the forward magnetization transfer rate ($$$k_{for}$$$) from tissue to macromolecules that is a measure of tissue health. 3
$$\frac{1}{T_{1nosat}}=\frac{1}{T_{1t}}+\frac{f}{\lambda} [1]$$
$$\frac{1}{T_{1sat}}=\frac{1}{T_{1t}}+\frac{f}{\lambda}+k_{for} [2]$$
$$k_{for}=\frac{1}{T_{1sat}}-\frac{1}{T_{1nosat}} [3]$$
where $$$f$$$ is the perfusion rate, $$$\lambda$$$ is the tissue-blood partition coefficient, and
$$$k_{for}$$$ is the forward magnetization transfer rate
from tissue to macromolecular water protons.
Methods
All MRIs were performed on a GE Signa 1.5 T MRI (Version LX) at the University of Pittsburgh MR Research Center. Sixty-three elderly volunteers from the cardiovascular health study (CHS) cognition study (CHS-CS) including 20 normal cognition (NC) subjects (84.40 ± 4.38 years, 10 females), 18 mild cognitive impairment (MCI) patients (84.40 ± 3.30 years, 12 females) and 25 AD patients (84.77 ± 3.01 years, 20 females) were included in the baseline analysis; 53 participants (15 stable-NC, 12 NC-to-MCI, 12 stable-MCI, and 14 MCI/AD-to-AD participants) were included in the longitudinal analysis.
T1 maps were measured using inversion recovery (IR) and multi-slice echo planar imaging [twelve inversion times (TIs) from 0.02-2.6 s], with and without off-resonance RF saturation (10 kHz offset). The raw IR images from twelve inversion times with and without off-resonance RF saturation were motion corrected and co-registered. $$$T_{1sat}$$$ and $$$T_{1nosat}$$$ maps for each subject were calculated using the TIs pertaining to each slice (i.e., adjusted for slice acquisition time). A noniterative algorithm was used to calculate $$$T_{1sat}$$$ and $$$T_{1nosat}$$$. $$$k_{for}$$$ was calculated based on $$$T_{1sat}$$$ and $$$T_{1nosat}$$$ maps using Eq. [3]. $$$k_{for}$$$ images were transferred to the standard brain space using SPM8. $$$k_{for}$$$ maps were compared on a voxel-by-voxel basis among the NC, MCI, and AD groups using SPM8’s general linear model and controlling for age and gender. The longitudinal change of $$$k_{for}$$$ was compared on a voxel-by-voxel basis among the four longitudinal groups using SPM8’s general linear model and controlling for age, gender and years between baseline and follow-up scans. For both the cross-sectional and longitudinal analyses, a voxel-level p value of 0.01 was used to threshold the statistical maps. A cluster-level p value of 0.05 was used to guard against false positives from multiple comparisons.
To verify the longitudinal changes of $$$k_{for}$$$, regional analyses were performed for the clusters derived from the longitudinal analysis with the same covariates adjusted in the voxel-based analysis.
Results
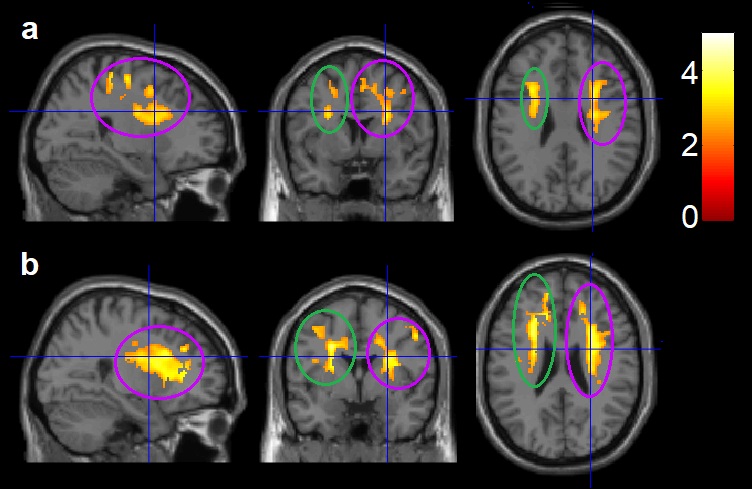
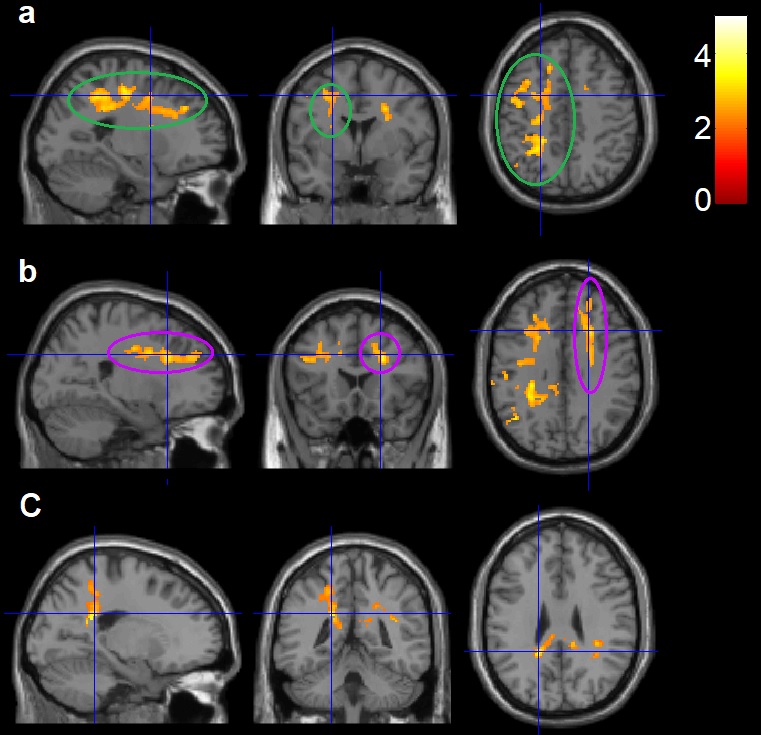
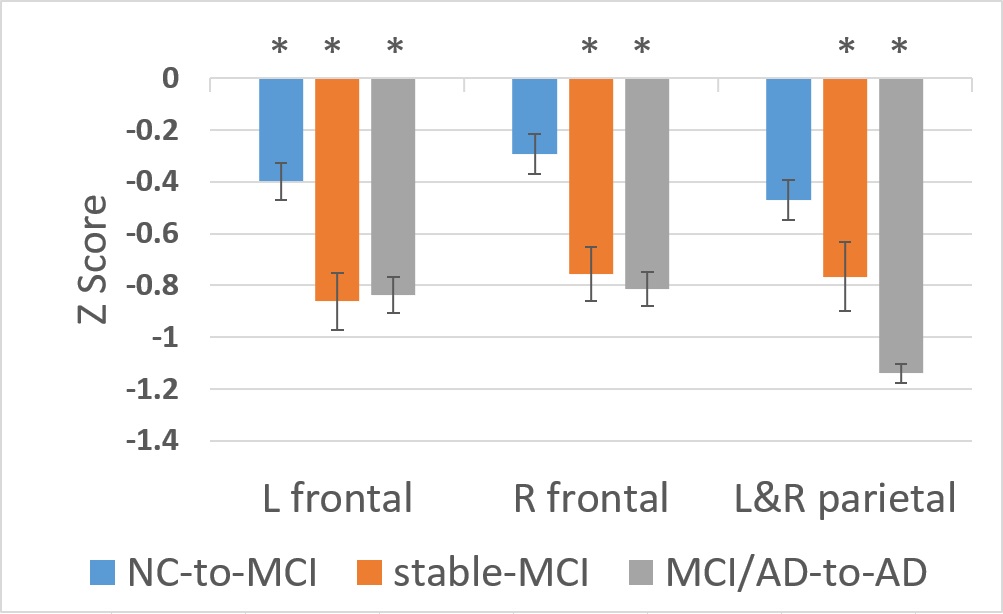
Compared to the NC and MCI groups, the AD group exhibited a significant decrease of $$$k_{for}$$$ values at the frontal white matter (WM) and internal capsule areas (Fig. 1a-1b). Compared to the stable NC subjects, the stable MCI and MCI/AD-to-AD groups exhibited significantly larger longitudinal decrease in $$$k_{for}$$$ in the frontal and parietal WM areas on a voxel-based analysis (Fig. 2a-2c). In the left frontal WM regions, the NC-to-MCI, stable MCI and MCI/AD-to-AD groups exhibited significantly larger longitudinal decrease in $$$k_{for}$$$ when compared to the stable NC group (Fig. 3). In the right frontal and parietal WM regions, only the stable MCI and MCI/AD-to-AD groups exhibited significantly larger longitudinal decreases in $$$k_{for}$$$ (Fig. 3). Years between baseline and follow-up scans were significantly associated with the longitudinal change in $$$k_{for}$$$.Discussion
$$$k_{for}$$$ in the frontal WM region was related to the development and diagnosis of AD in this study. This is consistent with the reduced peak heights of magnetization transfer ratio (MTR) histograms of MCI and AD patients in the frontal WM regions 1. The MTR was related to the executive functioning of cognitive impairment in normal elderly 4. Interestingly, the quantitative MTR of WM tracts was shown to be correlated with diffusion tension imaging in predicting the transition from MCI to AD 5. Frontal WM damage, measured using mean diffusivity and fractional anisotropy, was frequently reported in AD 6-8. Our results support the involvement of frontal WM in the progression of AD, highlighting magnetization transfer rate of frontal white matter as a promising biomarker and disconnection of fibers as a potential mechanism.Acknowledgements
This work was supported by grants AG20098 and AG15928 from the National Institute on Aging (NIA) and by contracts N01-HC-85239, N01-HC-85079 through N01-HC-85086, N01-HC-35129, N01 HC-15103, N01 HC-55222, N01-HC-75150, N01-HC-45133, and grant HL080295 from the National Heart, Lung, and Blood Institute (NHLBI), with additional contributions from the National Institute of Neurological Disorders and Stroke (NINDS). The research was also supported by the State University of New York at Binghamton, Nevada Cancer Institute, the University of Pittsburgh, and Washington University in St. Louis.References
- van der Flier, W.M., et al., Magnetization transfer imaging in normal aging, mild cognitive impairment, and Alzheimer's disease. Ann Neurol, 2002. 52(1): p. 62-7.
- Seiler, S., S. Ropele, and R. Schmidt, Magnetization transfer imaging for in vivo detection of microstructural tissue changes in aging and dementia: a short literature review. J Alzheimers Dis, 2014. 42 Suppl 3: p. S229-37.
- W. Zhang et al., NMR measurement of perfusion using arterial spin labeling without saturation of macromolecular spins. MRM 33:370-376 (1995).
- Seiler, S., et al., Magnetization transfer ratio relates to cognitive impairment in normal elderly. Front Aging Neurosci, 2014. 6: p. 263.
- Makovac, E., et al., Quantitative Magnetization Transfer of White Matter Tracts Correlates with Diffusion Tensor Imaging Indices in Predicting the Conversion from Mild Cognitive Impairment to Alzheimer's Disease. J Alzheimers Dis, 2018. 63(2): p. 561-575.
- Bozzali, M., et al., White matter damage in Alzheimer's disease assessed in vivo using diffusion tensor magnetic resonance imaging. J Neurol Neurosurg Psychiatry, 2002. 72(6): p. 742-6.
- Choi, S.J., et al., Diffusion tensor imaging of frontal white matter microstructure in early Alzheimer's disease: a preliminary study. J Geriatr Psychiatry Neurol, 2005. 18(1): p. 12-9.
- Hoy, A.R., et al., Microstructural white matter alterations in preclinical Alzheimer's disease detected using free water elimination diffusion tensor imaging. PLoS One, 2017. 12(3): p. e0173982.
Figures