0624
Progressive alterations in structural topological properties in T2DM with and without mild cognitive impairment1Department of Radiology, Tongji Hospital, Tongji Medical College, HUST, Wuhan, China, 2Department of Neurology, Tongji Hospital, Tongji Medical College, HUST, Wuhan, China, 3GE Healthcare, MR Research China, Beijing, China
Synopsis
This study aims to investigate the topological
organization in T2DM with and without impairment, and characterize its
relationships with clinical measurements. Forty T2DM patients were divided into
two sub-groups(impaired and normal cognition), together with ten healthy
controls, were imaged at a 3T scanner. We found that the T2DM patients with
cognitive impairment had decreased global efficiency, local efficiency, but
increased shortest path length than those with normal cognition and healthy controls.
Decreased nodal properties were also detected. Decreased clustering
coefficients correlated with the neuropsychological assessment and disease
duration. The structural topological properties research shows potential
feasibility in characterizing intrinsic alterations of diabetic encephalopathy.
Introduction/Purpose
Type 2 diabetes mellitus (T2DM) is a chronic metabolic disease. Patients with T2DM have considerably higher risk of developing cognitive impairment. Diffusion Tensor Imaging (DTI) studies have revealed widespread white-matter integrity alterations and its correlation with neuropsychological function for T2DM patients.1 Moreover, graph theory studies have shown disrupted topological organization of both functional and structural brain networks.2,3 However, whether the cognitive dysfunction will have impact on the topological properties of brain networks for T2DM patients is still not clear. Thus, the purpose of this study is to investigate the topological organization alterations in T2DM patients with and without cognitive impairment, and characterized its relationships with clinical measurements.Methods
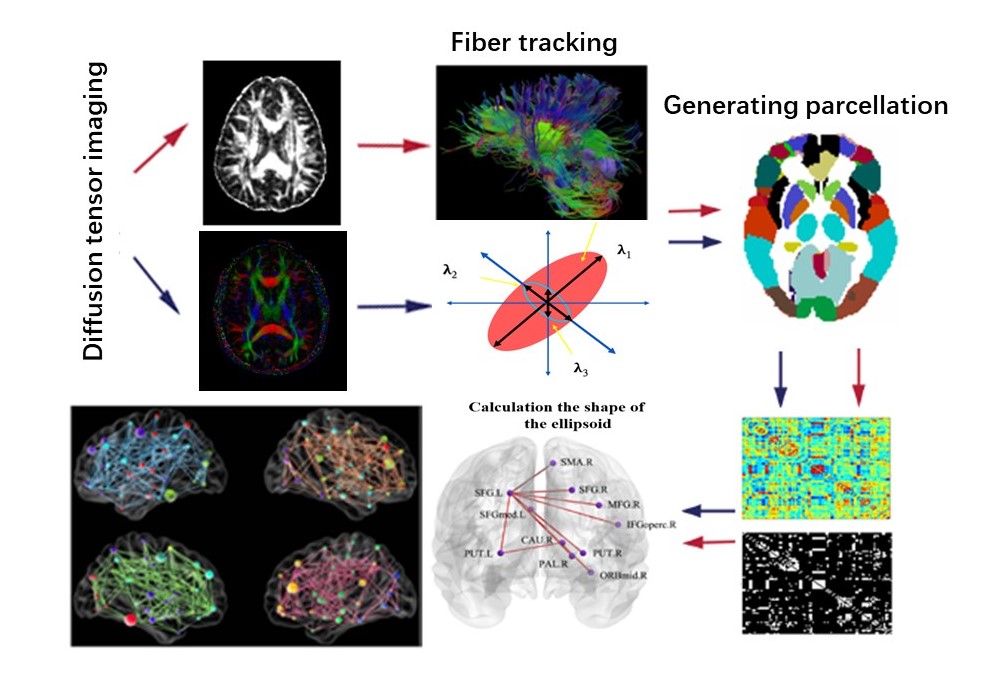
Patients: With approval of the Institutional Review Board, 40 T2DM patients (based on diagnostic criteria of American Diabetes Association; 52-72 years) were recruited and divided into mild cognitive impairment (DM-MCI, n=20, 62.9±5.5years) and normal cognition (DM-NC, n=20, 59.1±6.4years) groups based on clinic symptoms and a battery of neuropsychological tests (Montreal Cognitive Assessment, Mini-Mental State Examination, Trail Making Tests, Auditory Verbal Learning Test, Hachinski test, and Activity of Daily Living test. These tests were performed at 2-week intervals in 10 patients, and the intra-rater reliability was 92%). Ten healthy controls (50-70 years) were also enrolled in the study for comparison. Measurement of blood biochemistry, including plasma fasting/postprandial glucose and glycated hemoglobin A1c (HbA1c) levels were recorded. Imaging: On a 3T MRI scanner (Discovery MR750, GE Healthcare, Waukesha, Wisconsin, USA) with a 32-channel head coil, axial DTI images were obtained using a single-shot diffusion-weighted echo planar imaging sequence (TR/TE = 8500/66.3 ms, FOV = 25.6×25.6 cm2, 70 slices, 64 diffusion-weighted directions with a b-value of 1000 s/mm2). Data preprocessing: Procedures included the eddy current and motion corrections, diffusion tensor tensor (fractional anisotropy, mean diffusivity, and eigenvalues) calculation. Brain network construction: The 90 regions of interest (ROIs) from Automated Anatomical Labeling (AAL) template4 were defined as network nodes. The seed number was set as 2. Diffusion MRI tractography was performed using the Diffusion Toolkit software (http://www.trackvis.org/dtk/). All tracts in the DTI dataset were computed by seeding each voxel with the threshold of FA>0.2 and turned an angle <45 degrees. As a result, all fiber pathways between the 90 ROIs in the brain were constructed using deterministic tractography method. Several common graph measurements were analyzed, including global efficiency (Eg), local efficiency (Eloc), clustering coefficient (Cp), shortest path length (Lp), and small-word parameters (λ, γ, σ). To determine the regional characteristics of the structural network, we also computed the nodal efficiency in T2DM patients with and without MCI. The network analyses were performed and visualized using GRETNA5 and BrainNet Viewer6 softwares. For global parameters, a 2-tailed Student’s t-test was applied with a statistical significance set at p<0.05; for nodal parameters, a false-discovery rate (FDR) correction was applied for multiple comparisons. The flowchart of structural network construction was showed in Fig.1.Results
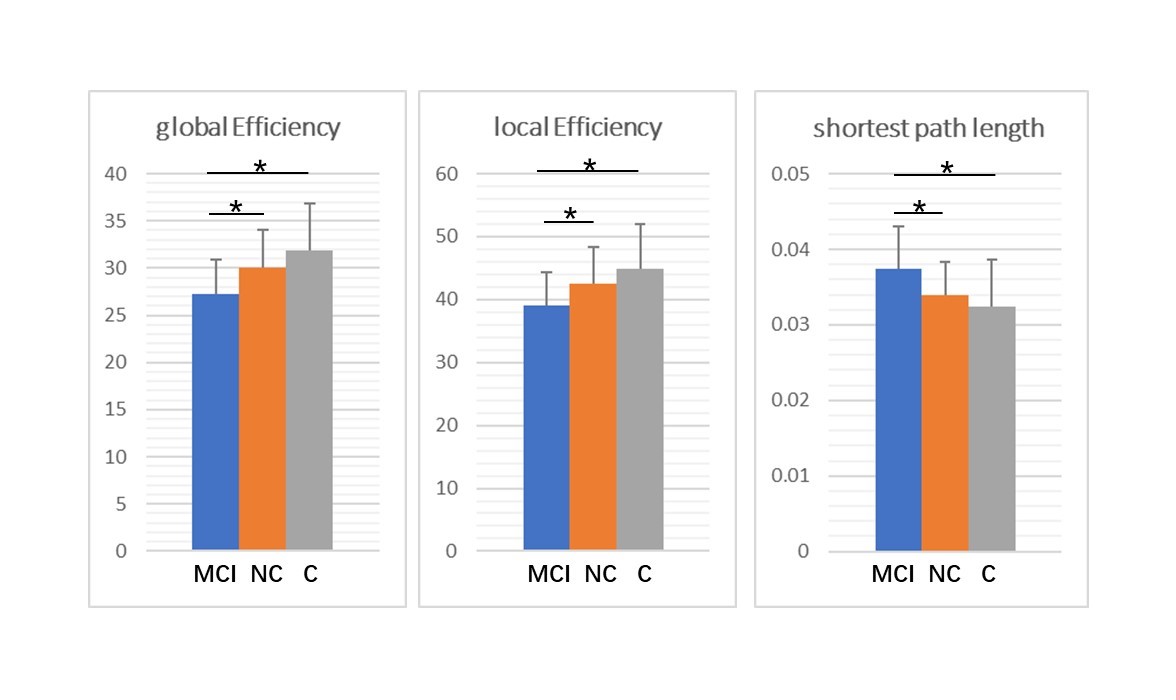
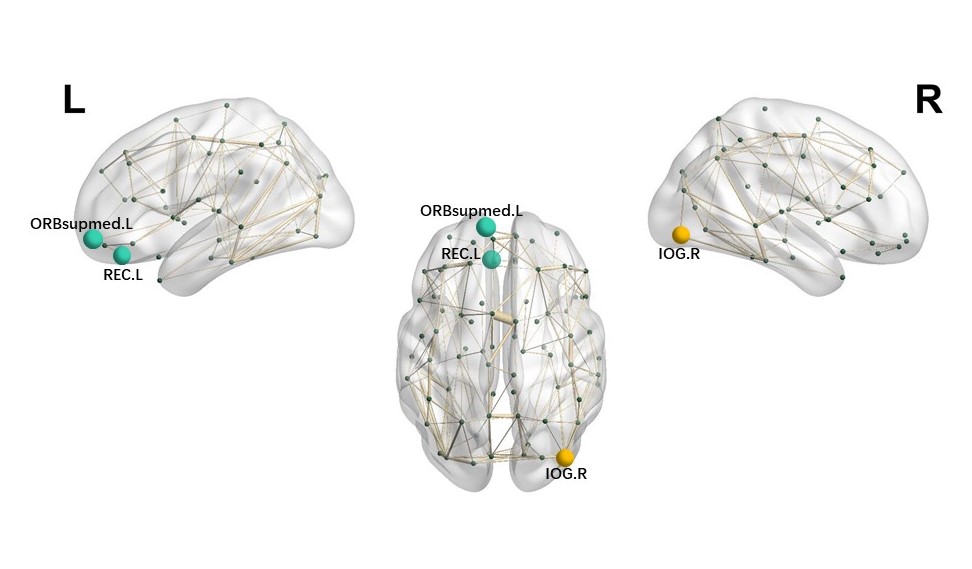
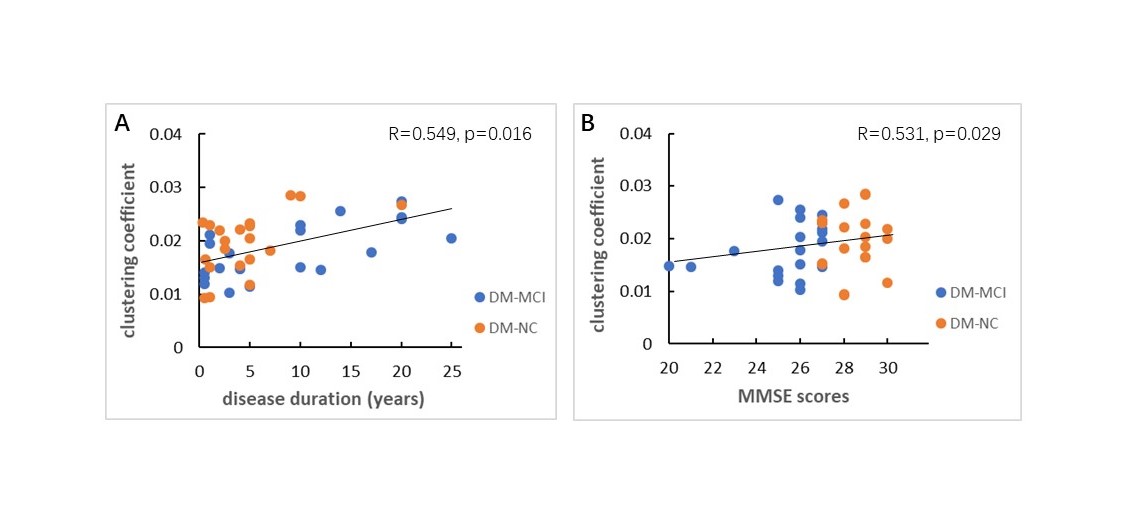
The DM-MCI group had higher level of HbA1c (8.22±1.60%) than the DM-NC group (6.97±1.26%, p=0.003), longer duration (8.18±1.55 years) than the DM-NC group (6.83±1.07 years, p=0.040). Global network properties: All the three groups exhibited economical small-world organization (σ=2.73±0.20, 2.68±0.18, and 2.71±0.153, for DM-MCI, DM-NC and HC, respectively). No significant between-group difference was detected. Compared with the controls and DM-NC group, the DM-MCI group exhibited significant decrease in Eg (p=0.027) , Eloc (p=0.050) values, and significant increase in Lp (p=0.032) value. The DM-NC group didn’t show significant difference in Eg, Eloc, or Lp than the controls. (Fig.2). Regional efficiency: Schematic drawings (Fig.3) showed brain regions with significant reduced group effect in nodal efficiency between DM-MCI and DM-NC groups (p<0.05 , FDR corrected). The most significantly decreased nodal efficiency were found in the left superior frontal gyrus(medial orbital). Other regions with decreased nodal efficiency were mainly distributed in the left gyrus rectus and the right inferior occipital gyrus. Decreased clustering coefficients has been correlated with the neuropsychological assessment and disease duration in all the T2DM patients (Fig.4).Discussion and Conclusions
The disrupted topological organization of structural networks (measured by Eg, Eloc, Cp and Lp) were found in T2DM patients with MCI compared with HCs. However, these topological properties were relatively preserved in those T2DM subjects with normal cognition compared with HCs. The small-world properties were exhibited preserved in T2DM patients with or without MCI. Moreover, decreased nodal properties were detected in the DM-MCI group than the DM-NC group. The structural topological properties research can contribute to understand the intrinsic alterations of diabetic encephalopathy, including cognitive impairment.Acknowledgements
Funding: This project was supported by the National Natural Science Funds of China (Grants No. 81601480 and 81471230).References
1. Xiong Y, Sui Y, Xu Z, et al. A diffusion tensor imaging study on white matter abnormalities in patients with type 2 diabetes using tract-based spatial statistics. AJNR Am J Neuroradiol. 2016;37(8):1462-9.
2. Reijmer YD, Leemans A, Brundel M, et al. Disruption of the cerebral white matter network is related to slowing of information processing speed in patients with type 2 diabetes. Diabetes. 2013; 62: 2112–5.
3. Zhang J, Liu Z, Li Z, et al. Disrupted white matter network and cognitive decline in type 2 diabetes patients. J Alzheimers Dis. 2016; 53: 185–95.
4. Tzourio-Mazoyer N, Landeau B, Papathanassiou D, et al. Automated anatomical labeling of activations in SPM using a macroscopic anatomical parcellation of the MNI MRI single-subject brain. Neuroimage. 2002;15(1):273-89.
5. Wang J, Wang X, Xia M, et al. GRETNA: a graph theoretical network analysis toolbox for imaging connectomics. Frontiers in human neuroscience, 9, 386.
6. Xia M, Wang J, He Y. BrainNet Viewer: A Network Visualization Tool for Human Brain Connectomics. PLoS ONE 8: e68910.
Figures