0623
Tau Propagation Pattern Is Suggested Through Associations with Structural Tract Alterations: A Data Driven Approach1Indiana University, School of Medicine, Indianapolis, IN, United States, 2Department of Epidemiology and Biostatistics, Indiana University, School of Public Health, Bloomington, IN, United States
Synopsis
To test the hypothesis that the propagation of tau is facilitated by microstructural alterations in white-matter tracts, we applied a data driven approach to study the “upstream tau – tract alteration – downstream tau” associations throughout the whole brain using tau positron emission tomography (tau-PET) and diffusion MRI (dMRI). The discovered pathways of spread support the characteristic pattern observed in Braak staging.
Introduction
Tau neurofibrillary tangles, a hallmark lesion of Alzheimer’s disease (AD), progress in predictable topographical patterns.1 Although animal studies have provided evidence that tau spreads via synaptic connectivity,2-3 it is unresolved whether tau propagates in the same way in human disease. Determining the mechanism of tau pathology spread in humans will critically inform our understanding of AD pathophysiology and help us define new treatment targets. A recent study explored association between tract alteration using dMRI and downstream tau depositions in human,4 but was restricted to a specific tract using prior knowledge (e.g. hippocampal cingulum bundle) and is not clear whether it could be generalized to the wider spread of tau throughout the cortex. Here we test the hypothesis that tau propagation is facilitated by microstructural alterations in white-matter tracts that can be detected with dMRI. We studied the “upstream tau–tract alteration–downstream tau” associations throughout the whole brain using tau-PET and dMRI with a data driven approach.Methods
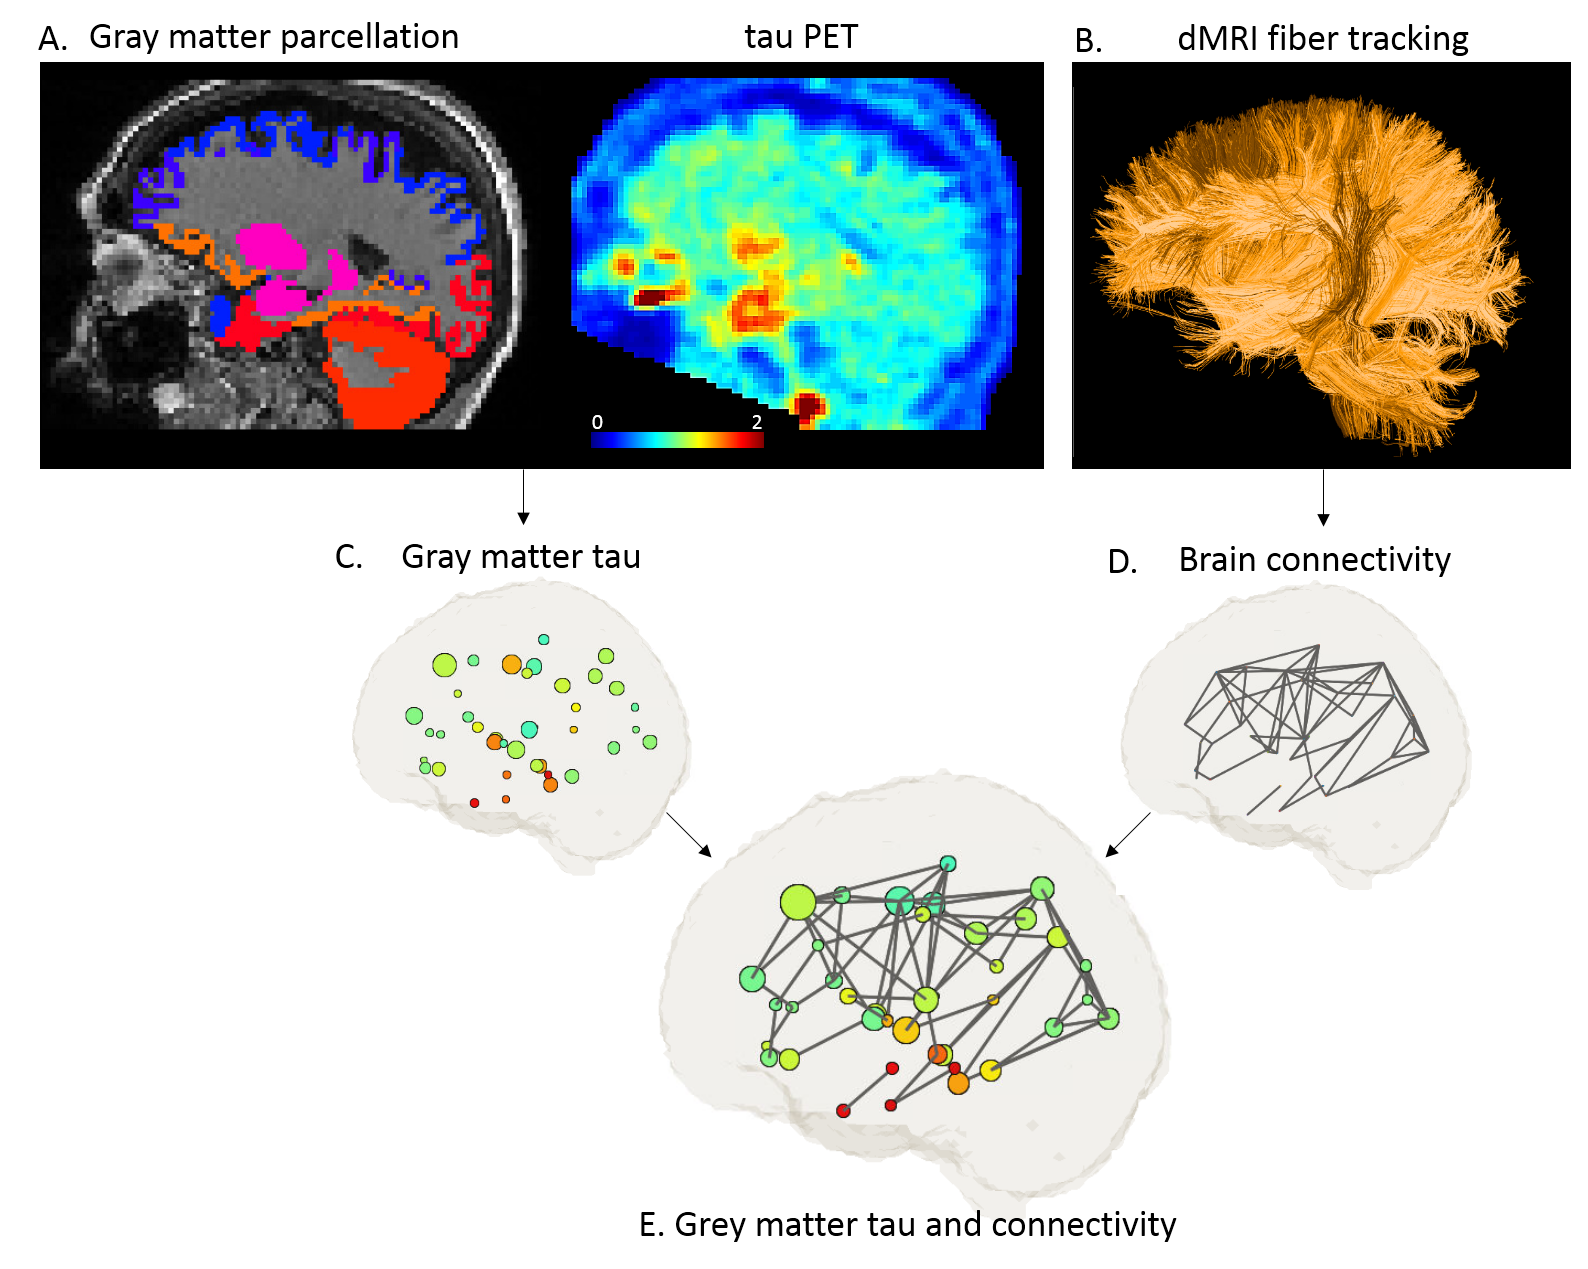
This study included sixty-two older (>50 yo) adults: 44 cognitively normal individuals and 18 with mild cognitive impairment. All subjects underwent both tau-PET ([18F]Flortaucipir PET) and MRI exams that included anatomical T1-weighted imaging (MPRAGE) and dMRI. dMRI was acquired at 2mm isotropic resolution and contained 144 diffusion directions at 5 b-values (0, 250, 1000, 2000, 3250, 5000 s/mm2). Figure 1 illustrates the image processing pipeline. For each subject, 42 gray matter ROIs were parcellated on MPRAGE (FreeSurfer with Desikan/Killiany atlas) in each hemisphere, and tau-PET deposition from standardized uptake value ratio images (SUVR) was quantified in each ROI. Then all maps were brought to the dMRI space (Figure 1A&C). In the dMRI space, fiber tracking was performed (MRtrix3) and structural connectivity between ROIs were extracted (Figure 1B&D). Tract-specific measures of diffusion metrics, i.e. fractional anisotropy (FA), mean diffusivity (MD), axial diffusivity (Da) and radial diffusivity (Dr) were derived. Together, ROI-wise tau deposition in grey matter and tract-wise diffusion in connecting white matter were prepared for the subsequent group analysis (Figure 1E).
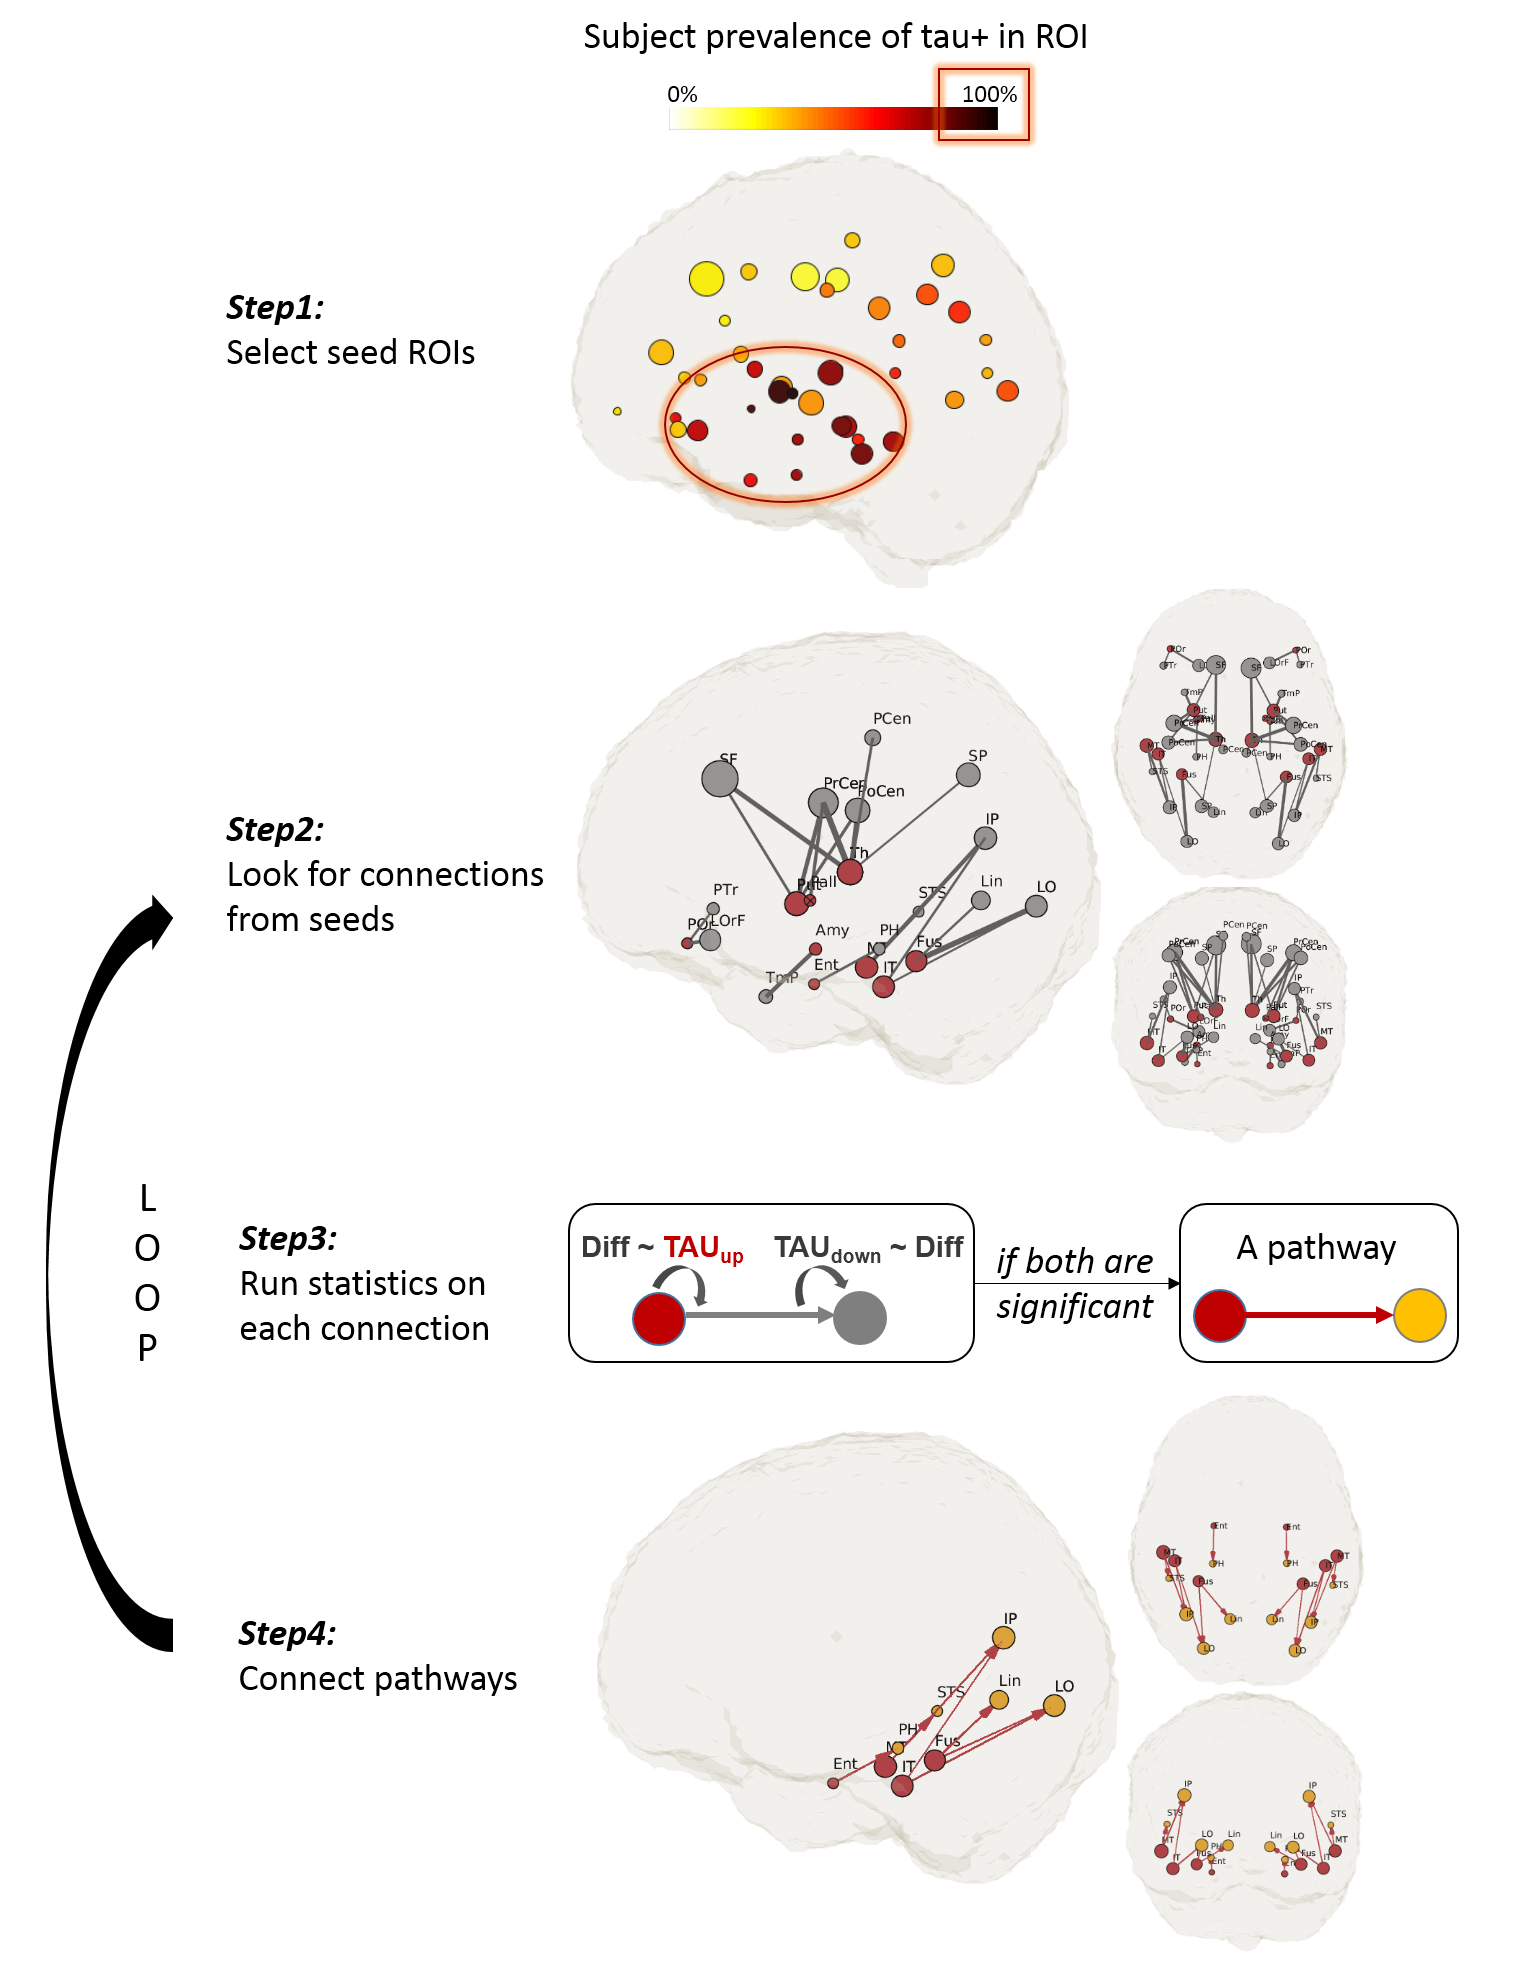
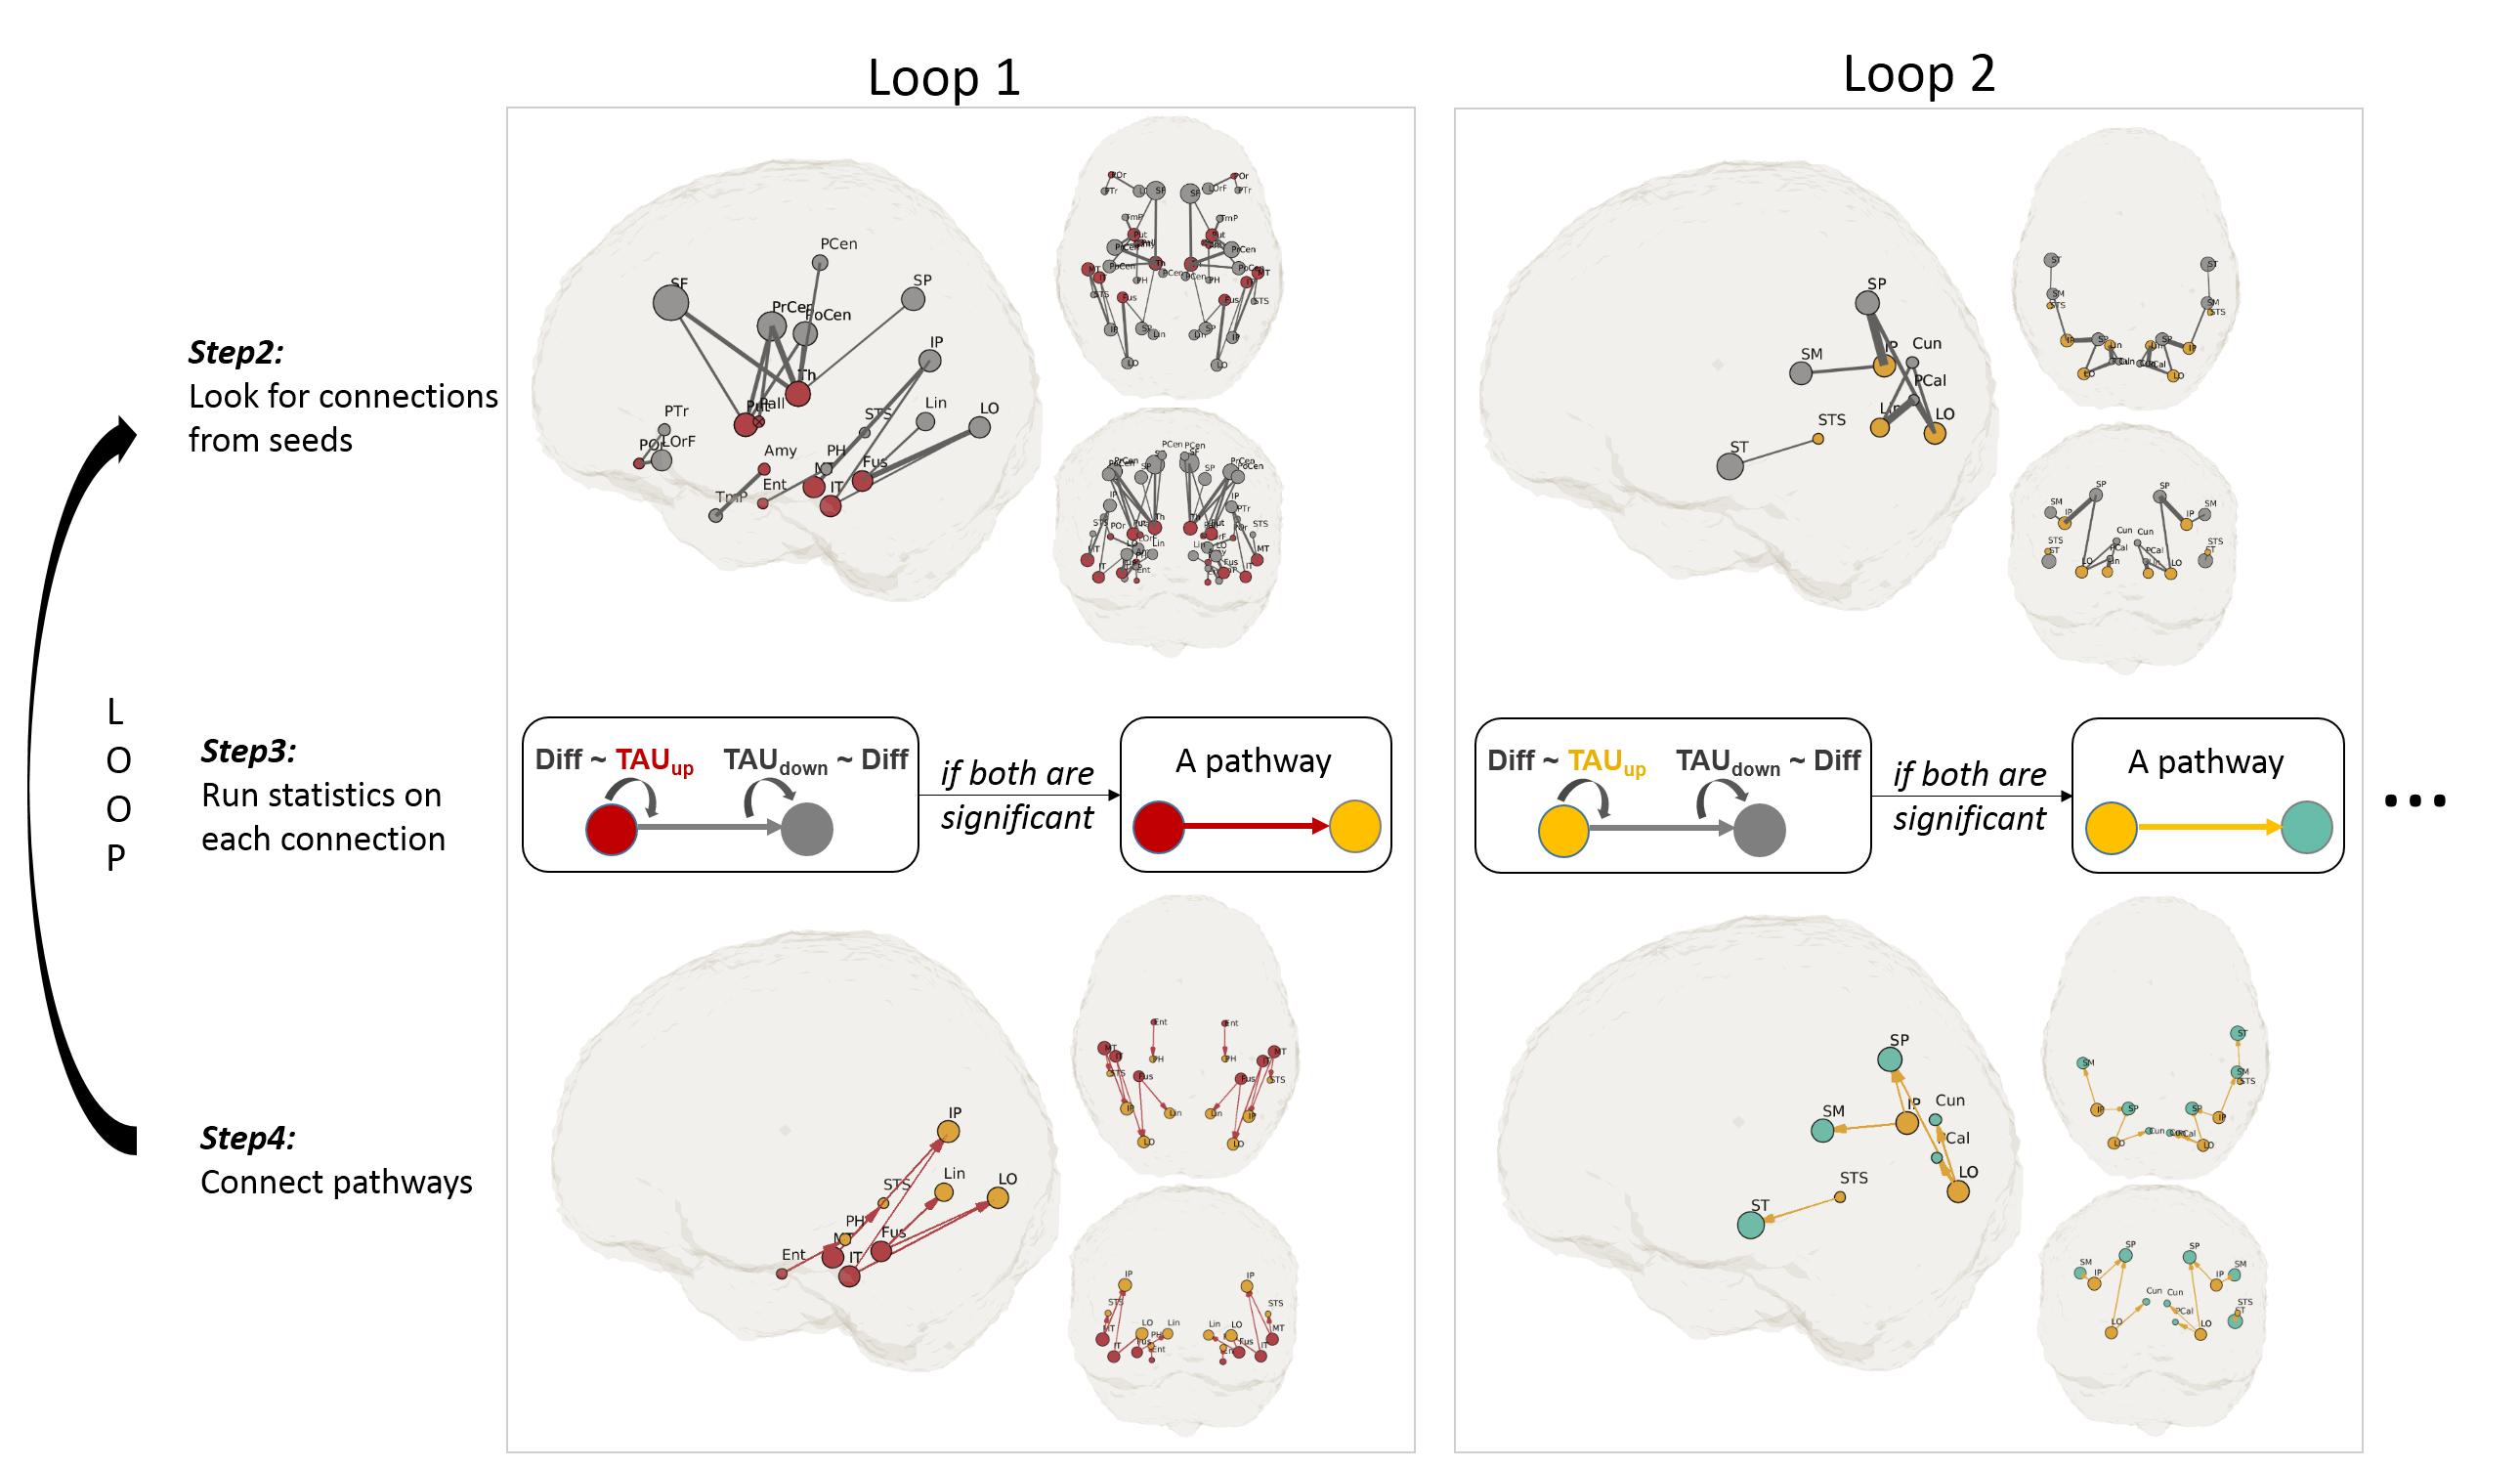
To test the hypothesis that tau propagates via disrupting tract integrity, we searched for pathways that demonstrate such associations. Figure 2 illustrates the diagram of the searching process. To determine starting ROIs (i.e., seeds), we plotted the prevalence of tau+ (SUV tauroi>1.23) in all ROIs across subjects (Figure 2,Step1). Seed ROIs were selected with a prevalence > 80%. Then the algorithm looks for downstream connections from the seeds (Figure 2,Step2). For each connection, we tested if a “upstream tau (tauup)–>tract diffusion (diff)–>downstream tau (taudown)” association exists (Figure 2,Step3). Two generalized linear regressions were performed: first, tauup was treated as the input and diff was treated as the observation; secondly, diff was treated as the input and taudown as the observation. We considered a tau propagation pathway exists if both associations are significant (p<0.05) (Figure 2,Step4). The searching continued by looping Step2 to Step4 till no further pathways could be found.
Results
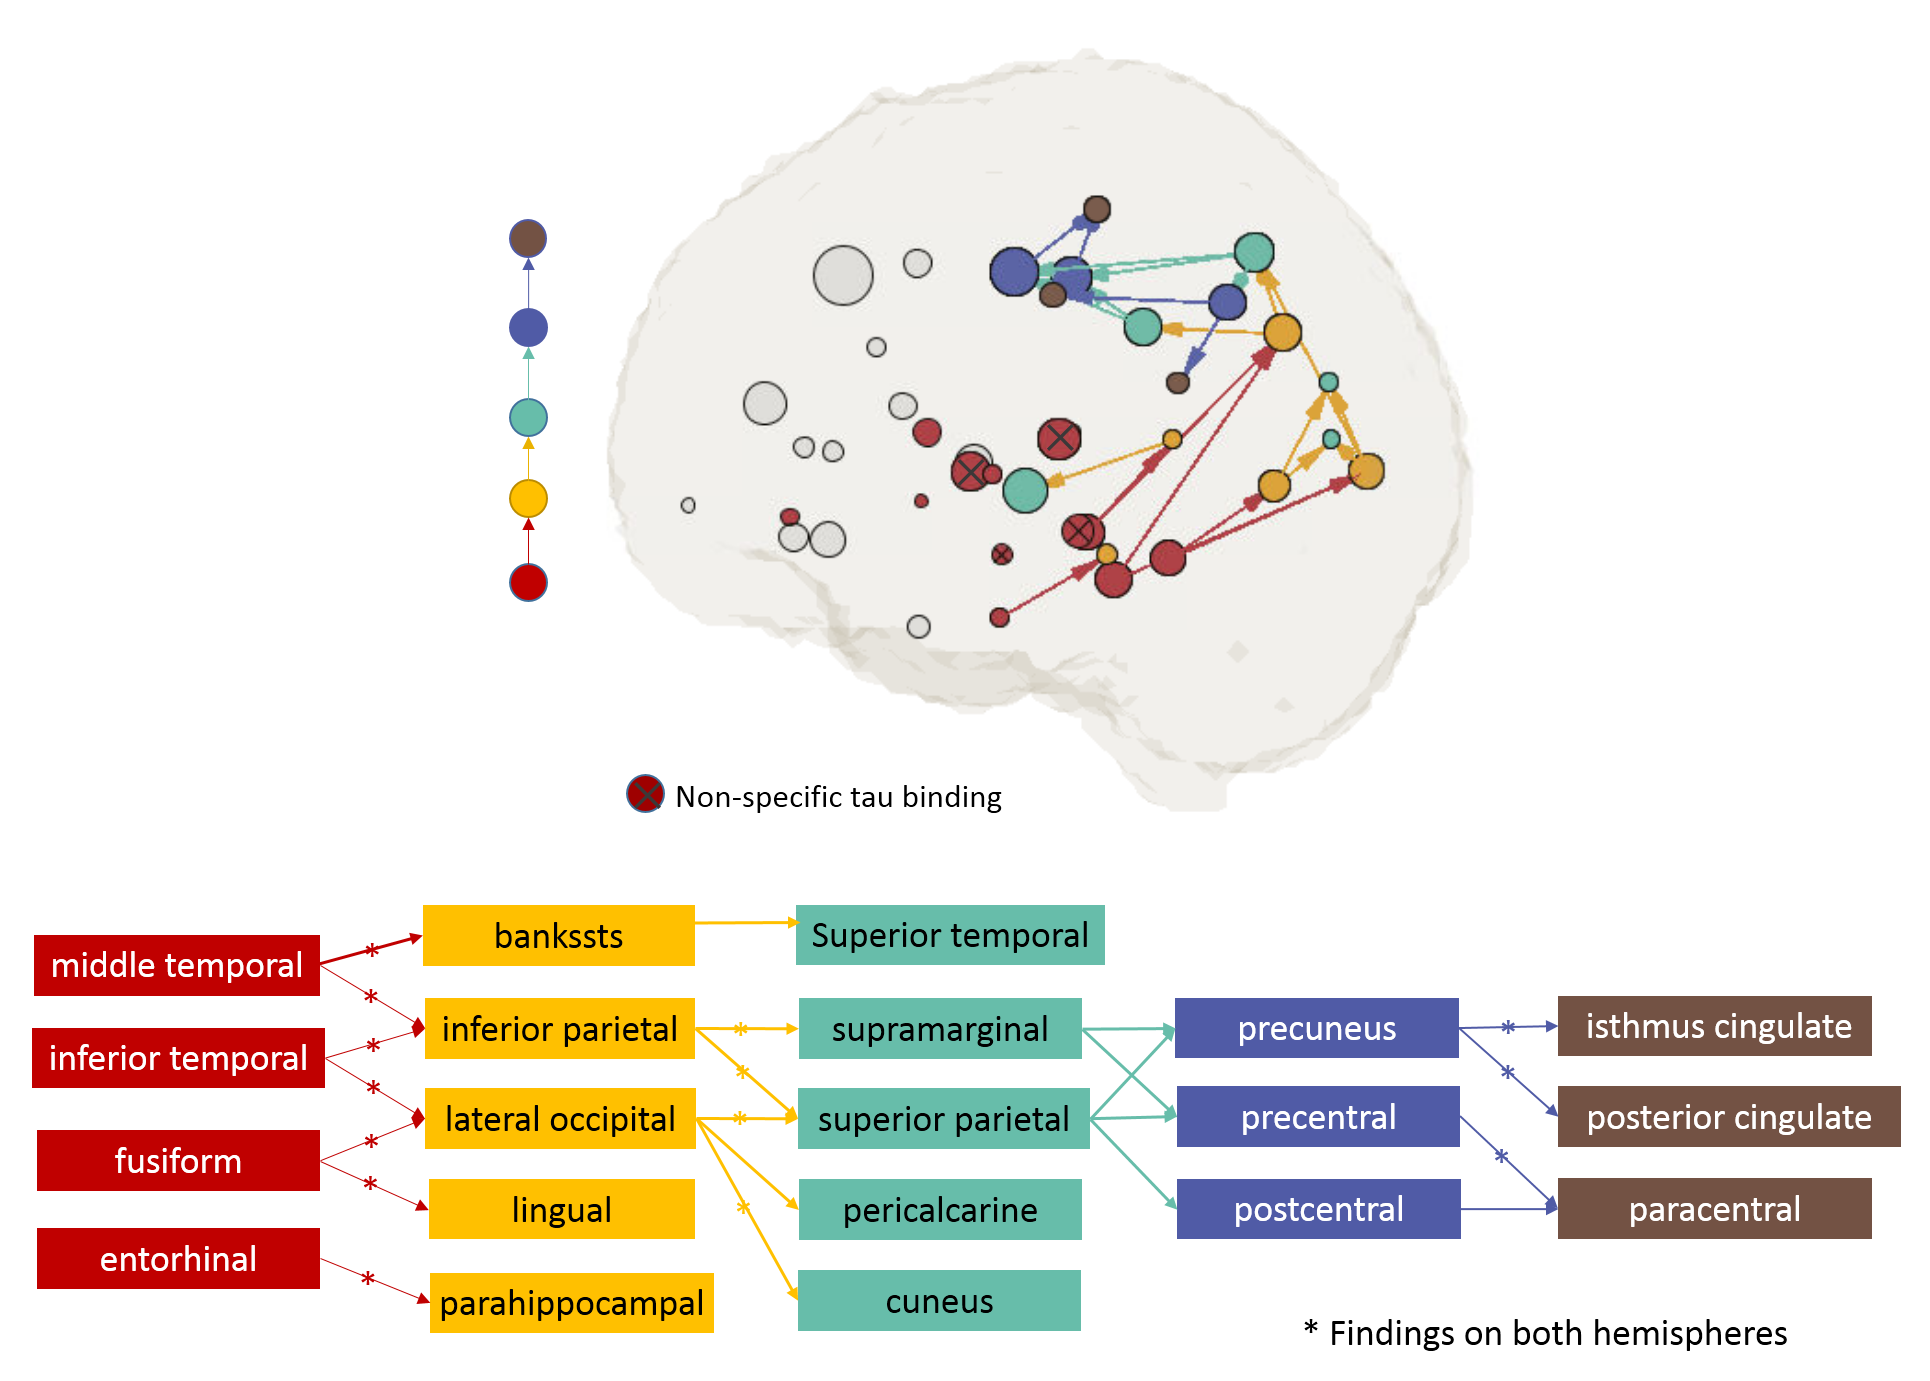
Figure 3 shows pathways found by the first two iterations and Figure 4 shows all the valid pathways (top figure). In this study, MD was found to be a most sensitive metric (results not shown) and was used in the searching analysis. The propagation started from 14 seed ROIs (red nodes) clustered mainly in the middle temporal lobe. Although all possible white-matter connections from the seed ROIs could extend across the whole brain (Figure 2,Step2), the valid pathways focused posteriorly (Figure 2,Step4). As the searching advanced, the valid pathways continued posteriorly and then superiorly, and eventually stopped in the postcentral region (Figure 4, brown ROIs). The ROIs involved in these valid pathways were listed in Figure 4 (bottom). Out of 22 pathways, 14 were found in both hemispheres, noted with a star. Higher tau was consistently associated with lower MD in all pathways, indicating compromised tract integrity. Some of the seed ROIs are known to have non-specific tau binding (i.e. pallidum, caudate, putamen, thalamus, noted with red ⦻ in Figure 4). These ROIs consistently showed no significant spreading pathways in our analysis.Discussion
Using a cohort of individuals representing the AD continuum (i.e., cognitively normal with or without AD risk factors and mild cognitive impairment), we demonstrated that the tau depositions were associated with compromised white-matter integrity in the structural connections. The pattern of associations support the characteristic pattern of neuropathological staging of AD.1,5,6 Furthermore, without applying any prior knowledge but simply tracking down these associations, a consistent propagation pattern was revealed. Our results provide in vivo evidence that tau is very likely to spread through these vulnerable pathways. Future directions are to replicate our results in a larger population (e.g. ADNI data), and to study the influence of amyloid status.Acknowledgements
This work was supported by the National Institutes of Health R01 AG053993; P30 AG010133, R01 AG019771, and K01 AG049050 and by Donors Cure foundation.References
- Braak, H. & Braak, E. Neuropathological stageing of Alzheimer-related changes. Acta Neuropathol. 82, 239–259 (1991).
- Ahmed, Z. et al. A novel in vivo model of tau propagation with rapid and progressive neurofbrillary tangle pathology: the pattern of spread is determined by connectivity, not proximity. Acta Neuropathol. 127, 667–683 (2014).
- Khan, U. A. et al. Molecular drivers and cortical spread of lateral entorhinal cortex dysfunction in preclinical Alzheimer’s disease. Nat. Neurosci. 17, 304–311 (2014).
- Jacobs HIL, Hedden T, Schultz AP, Sepulcre J, Perea RD, Amariglio RE, Papp KV, Rentz DM, Sperling RA, Johnson KA. Structural tract alterations predict downstream tau accumulation in amyloid-positive older individuals. Nat Neurosci. 2018 Mar;21(3):424-431.
- Schöll M, Lockhart SN, Schonhaut DR, O'Neil JP, Janabi M, Ossenkoppele R, Baker SL, Vogel JW, Faria J, Schwimmer HD, Rabinovici GD, Jagust WJ. PET Imaging of Tau Deposition in the Aging Human Brain. Neuron. 2016 Mar 2;89(5):971-982.
- Braak H, Del Tredici K. Alzheimer's pathogenesis: is there neuron-to-neuron propagation? Acta Neuropathol. 2011 May;121(5):589-95.
Figures