0622
Intracranial Pulse Wave Velocity in Alzheimer’s Disease using Flow Encode Split and Low Rank Reconstructed 4D Flow MRILeonardo A Rivera-Rivera1, Sterling C Johnson2, Chuck Illingworth2, and Kevin M Johnson1,3
1Department of Medical Physics, University of Wisconsin-Madison, Madison, WI, United States, 2Department of Medicine, University of Wisconsin-Madison, Madison, WI, United States, 3Department of Radiology, University of Wisconsin-Madison, Madison, WI, United States
Synopsis
Experimental, clinical and epidemiologic evidence shows vascular factors play a role in Alzheimer’s Disease (AD); however, whether
Introduction:
Cerebral hemodynamics are altered in Alzheimer’s disease (AD)1; however, the pathologic mechanisms and involvement of different compartments of the vascular network are not well understood. Diseases such as arteriosclerosis as well as aging diminish vascular compliance and will lead to arterial stiffness, a well-established risk factor for cardiovascular morbidity.2 Arterial wall stiffness can be assessed using pressure pulse wave velocity (PWV) which is routinely done by measuring the rate at which pressure waves move from carotid to femoral arteries.3 To probe the brain vasculature, intracranial PWV measures would be ideal. It may be possible to derive intracranial PWV from MRI flow measurements but a high temporal resolution is required. With comprehensive volumetric coverage and simultaneous recording of flows throughout the vascular tree, 4D flow MRI seems ideally suited for intracranial PWV measurements. However, standard techniques lack the temporal resolution for PWV measures. This work explores 3D radial 4D flow with a local low-rank approach4 and interleaved encoding splitting to increase the achievable temporal resolution. Preliminary results are shown for intracranial PWV estimation in AD patients.Methods:
Subjects: Study groups are summarized in Figure 1. The Impact group was defined as a cognitively healthy late-middle-aged group enriched for risk factors that predispose to AD. MRI: Volumetric, time-resolved phase contrast (PC) MRI data with 4-point balanced encoding were acquired on a 3.0T system (MR750, GE Healthcare) with an 8-channel head coil (Excite HD Brain Coil, GE Healthcare), with a 3D radially undersampled sequence5, with the following imaging parameters Venc =80cm/s, imaging volume =22x22x10cm3, TR/TE =7.4/2.7ms, scan time ~7min. Images were acquired with interleaved flow encoding; however, during reconstruction, these encodes were split and assigned independently to cardiac frames. Flow encoded images were reconstructed to 80 frames using iterative SENSE with ESPIRiT sensitivity maps and a local low-rank constraint.4, 6 Reconstructions were performed with block shifting of a 4x4x4 block and a manually tuned regularization parameter. The spatial resolution was 1.7mm isotropic, and the average temporal resolution from all subjects was 12.4±1.6ms. PWV analysis: Cardiac waveform and distance measurements were performed in a customized MATLAB tool7 (Mathworks, Natick, MA) on the dynamic data. The vascular tree was extracted using a centerline process, with local cross-sectional cut-planes automatically placed in every centerline point perpendicular to the axial direction of the vessel. Cardiac waveforms in the cervical and petrous internal carotid artery (ICA) were recorded and interpolated to 400 time-points. The temporal shift between these waveforms was determined by computing the time-to-upstroke (TTU), which is the point of maximum acceleration on the upstroke of the waveform. PWV was defined as vessel length between measured waveform locations over the temporal shift. PWV measurements in left and right ICAs were averaged. Group differences were assessed using ANOVA followed by post-hoc analysis. P<0.05 was set as the threshold for statistical significance.Results:
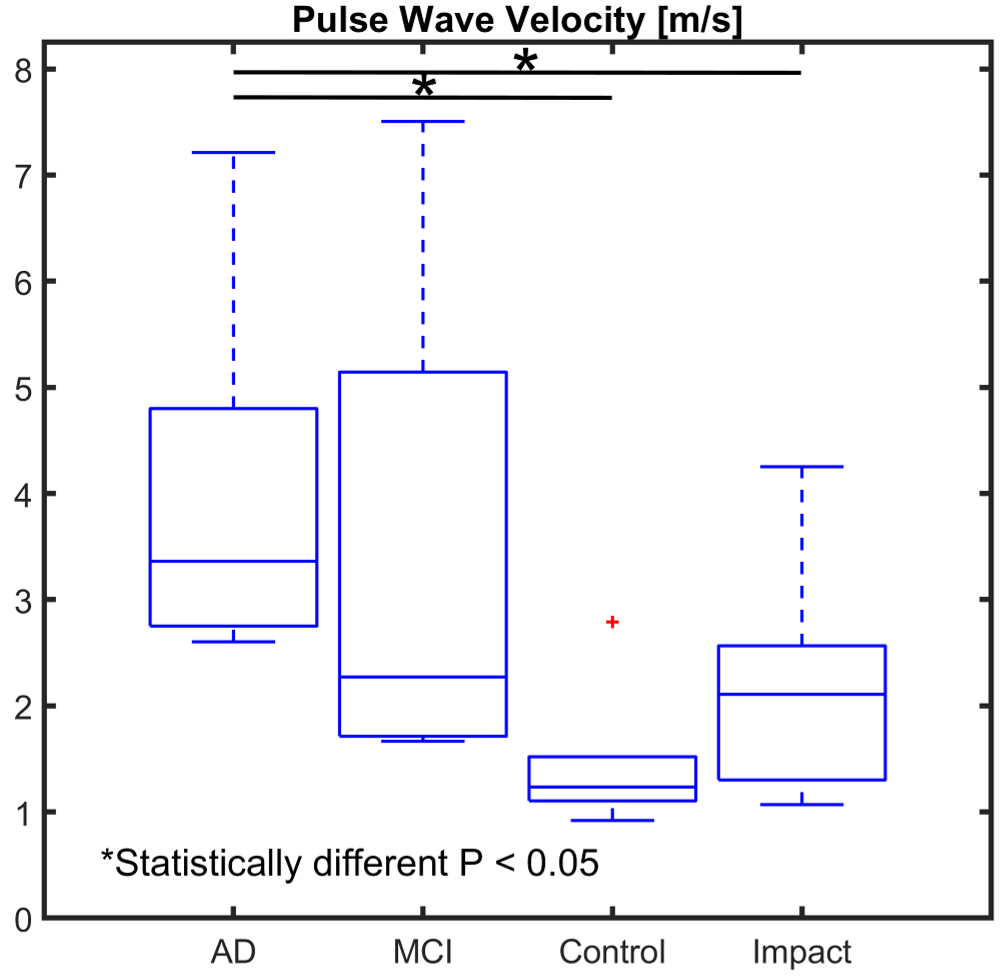
Figure 2 shows cardiac waveforms from the ICA in a normal subject using a.) low and b.) high temporal resolution reconstructions. In the low-resolution images a.) no temporal shift could be resolved. However, b.) a sub-TR temporal shift was measured in the high-resolution images for a PWV =6.59m/s. Figure 3 shows a group summary of the PWV measurements. Overall PWV was larger in AD and MCI groups than in control and impact groups. The impact group showed higher PWV than controls. Finally, the AD group had a statistically larger PWV when compared to control and impact groups. Figure 4 shows a scatter plot and linear regression models of PWV vs age. Both pathology and age appear to contribute to an increase PWV. With disease being a stronger contributor. The AD group is moderately described by a linear model with R2 =0.63.Discussion and Conclusions:
Sub-TR temporal shifts in the intracranial pulse wave are detectable using local low-rank reconstruction approaches, combined with interleaved encoding splitting in 4D flow MRI in the context of AD. Statistically higher apparent PWV in the AD group suggests arterial stiffening of the ICAs and macrovascular damage. Which support the hypothesis that functional changes to the arterial system are involved in the pathogenesis of AD. These preliminary findings agree with studies that report increased arterial stiffness in subjects with dementia of the vascular and AD types.8 The correspondence of the measured PWV to true pressure PWV remains unknown. The PWV magnitude was lower than 2D PC-MRI measures in long segments of the common carotid arteries9 suggesting overestimation of the temporal shifts. Further, temporal shifts are likely influenced by mechanisms such as wave reflections and vascular network resistance and may not directly represent vascular compliance.Acknowledgements
We gratefully acknowledge research support from GE Healthcare, and funding support from NIH grants R01NS066982, R01HL136965, P50-AG033514, and R01AG021155.References
- Berman SE, Rivera-Rivera LA, Clark RL, et al. Intracranial arterial four-dimensional flow is associated with metrics of brain health and Alzheimer's disease. Alzheimers Dement (Amst). 2015 Dec; 1(4): 420–428.
- Vlachopoulos C, Aznaouridis K, Stefanadis C. Prediction of cardiovascular events and all-cause mortality with arterial stiffness: a systematic review and meta-analysis. J Am Coll Cardiol. 2010 Mar 30;55(13):1318-27.
- Jeroncic A, Gunjaca G, Mrsic DB, et al. Normative equations for central augmentation index: assessment of inter-population applicability and how it could be improved. Sci Rep. 2016 May 27; 6:27016.
- Jimenez JE, Strigel RM, Johnson KM, et al. Feasibility of high spatiotemporal resolution for an abbreviated 3D radial breast MRI protocol. Magn Reson Med. 2018 Oct;80(4):1452-1466.
- Johnson KM, Lum DP, Turski PA, et al. Improved 3D Phase Contrast MRI with Off-resonance Corrected Dual Echo VIPR. Magn Reson Med. 2008 Dec; 60(6): 1329–1336.
- Uecker M, Lai P, Murphy MJ, et al. ESPIRiT--an eigenvalue approach to autocalibrating parallel MRI: where SENSE meets GRAPPA. Magn Reson Med. 2014 Mar;71(3):990-1001.
- Schrauben E, Wåhlin A, Ambarki K, et al. Fast 4D flow MRI intracranial segmentation and quantification in tortuous arteries. J Magn Reson Imaging. 2015 Nov;42(5):1458-64.
- Hanon O, Haulon S, Lenoir H, et al. Relationship between arterial stiffness and cognitive function in elderly subjects with complaints of memory loss. Stroke. 2005 Oct;36(10):2193-7.
- Kröner ES, Lamb HJ, Siebelink HM et al. Pulse wave velocity and flow in the carotid artery versus the aortic arch: effects of aging.J Magn Reson Imaging. 2014 Aug;40(2):287-93.
Figures
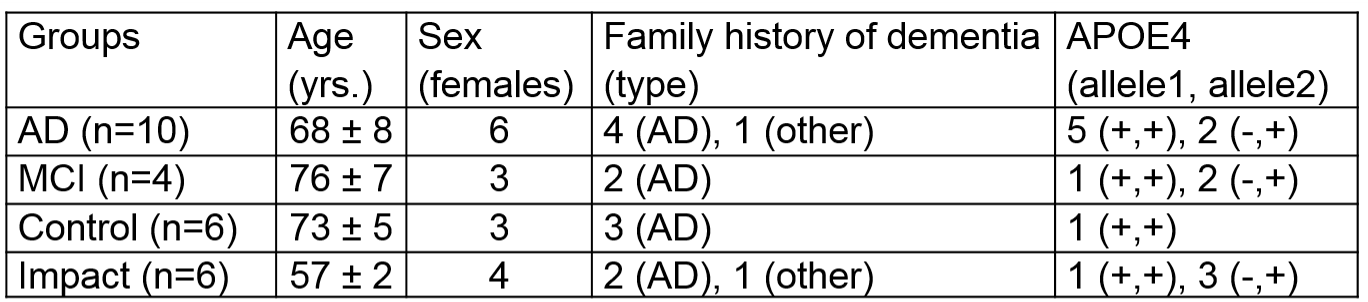
Figure
1: Summary
table of subjects groups. AD =
Alzheimer’s Disease, MCI = mild cognitively impaired, APOE4 = Apolipoprotein
E4.
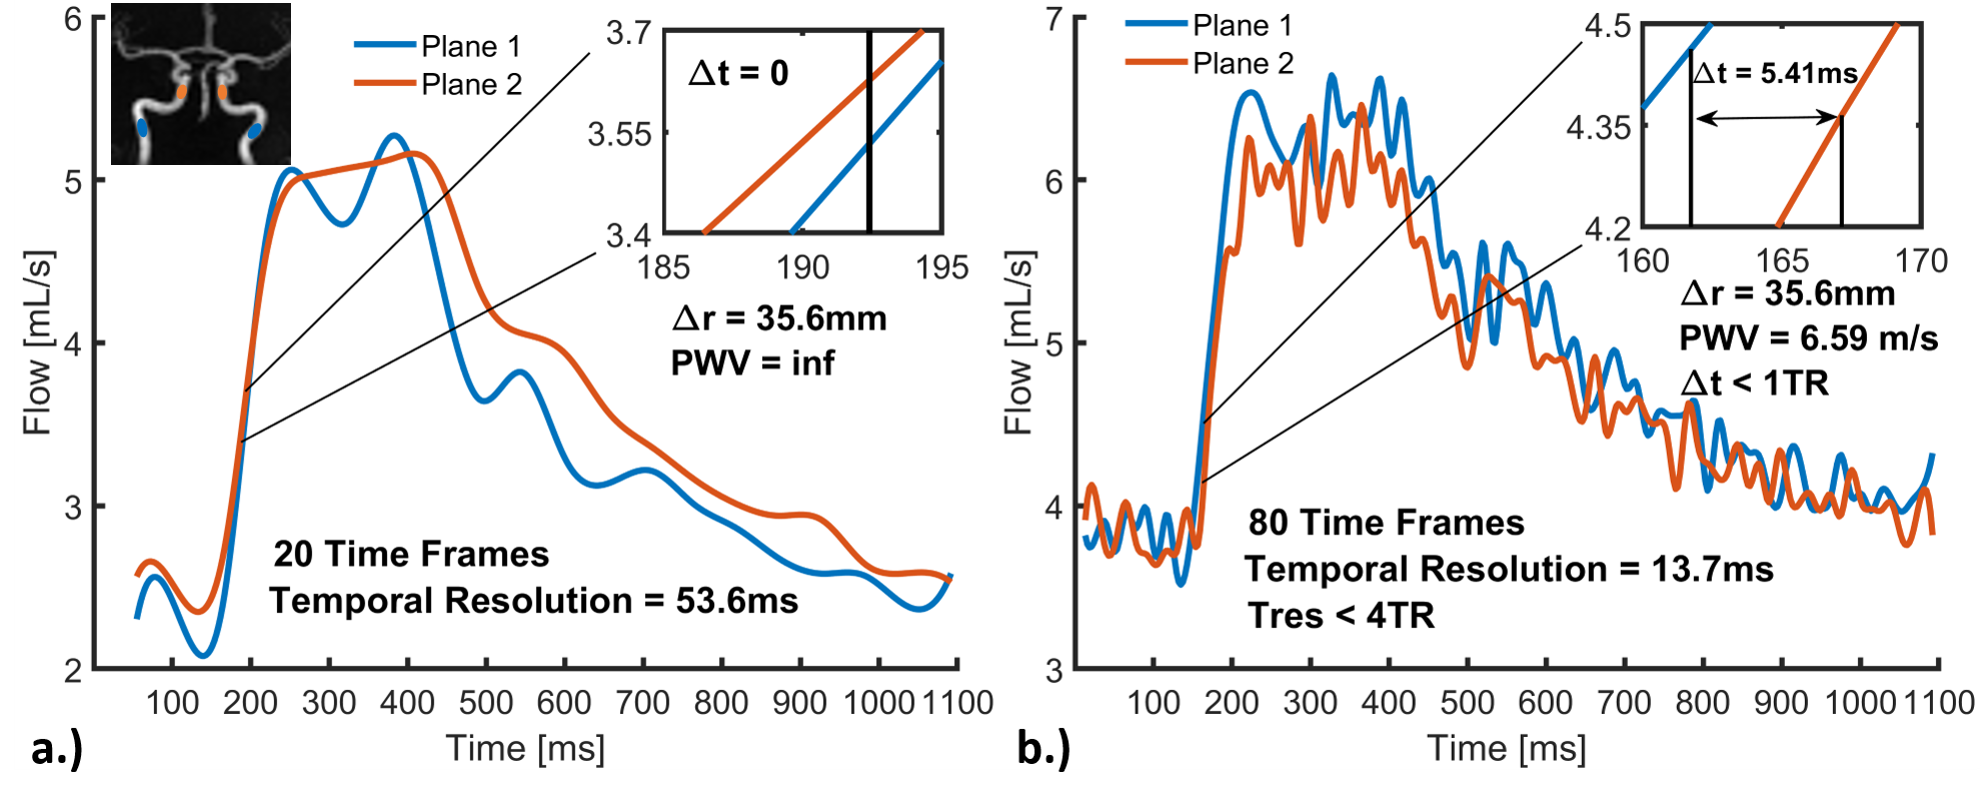
Figure 2: Cardiac waveforms from two measurement planes in a control subject (male, 67years-old). Plane 1 was located in the cervical aspect of the internal carotid artery (ICA), while Plane 2 in the petrous ICA. The vessel length across planes was 35.6mm. Velocity data were reconstructed using interleaved encoding splitting combined with a low-rank approach to 20 a.) and 80 b.) time frames and subsequently interpolated to 400 points. No delay between waveforms could be resolved with 20 frames a.). However, b.), a sub-TR delay and pulse wave velocity of 6.59m/s was measured in data from 80 time frames.
Figure
3: Box
plots showing the intracranial pulse wave velocity (PWV) in four different groups. The
average PWV per group were: 3.95 ± 1.56 in Alzheimer’s disease (AD) (n=10),
3.43 ± 2.76 in Mild Cognitively Impaired (MCI) (n=4), 1.47 ± 0.68 in controls
(n=6) and 2.23 ± 1.15 in impact (n=6). PWV was statistically larger in the AD group
when compared to control (P<0.001) and impact (P=0.032) groups.
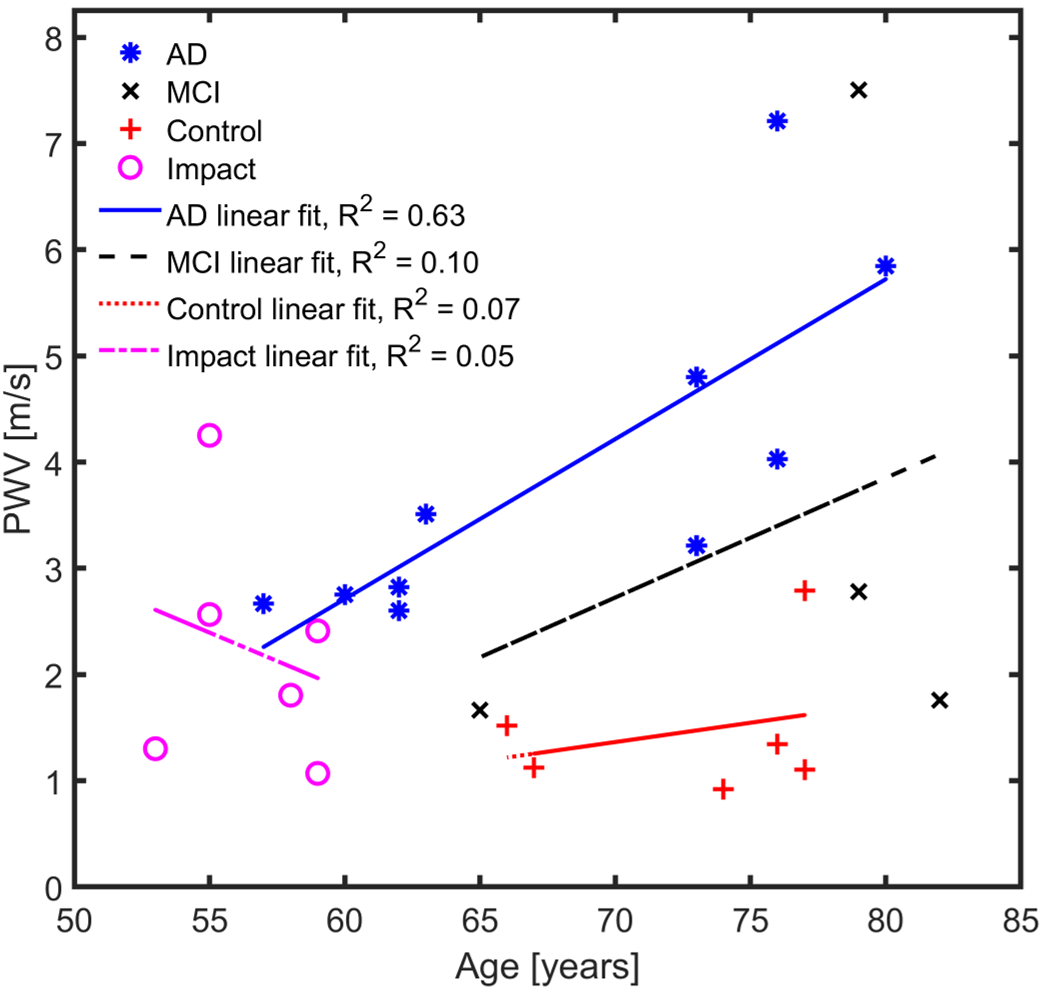
Figure 4: Scatter plot of intracranial pulse wave velocity (PWV) measurements and age of every subject including linear regression models for each group. PWV increases with increasing age and subject pathology. Disease effects are stronger than age effects. Linear models for control, impact and MCI groups showed poor correlations, while a moderate relationship is found in AD linear model (R2=0.63).