0621
Product-Ratios of Metabolite Concentrations as Potential Alzheimer’s Disease Biomarker1Physikalisch-Technische Bundesanstalt (PTB), Braunschweig and Berlin, Germany, 2Corporate Member of Freie Universität Berlin, Humboldt-Universität zu Berlin, and Berlin Institute of Health, Klinik und Hochschulambulanz für Neurologie, Charité - Universitätsmedizin Berlin, Berlin, Germany, 3Corporate Member of Freie Universität Berlin, Humboldt-Universität zu Berlin, and Berlin Institute of Health, NeuroCure Clinical Research Center, Charité - Universitätsmedizin Berlin, Berlin, Germany, 4Studies on Prevention of Alzheimer's Disease (StOP-AD) Centre, Douglas Mental Health University Institute, Montreal, QC, Canada, 5Department of Psychiatry, McGill University, Montreal, QC, Canada, 6Department of Neurology, University Medicine Greifswald, Greifswald, Germany
Synopsis
Previous studies have reported changes in the concentrations of several neurometabolites in Alzheimer’s disease (AD). Nevertheless, group differences of these metabolites between healthy controls, mild cognitively impaired, and AD patients remain small. The transition to ultrahigh fields enables the assessment of further metabolites, and some of them, like GABA and glutamate, have been observed to change in AD. In this study, the combination of several metabolite concentrations associated with AD into a product-ratio to serve as a stronger MRS biomarker for Alzheimer’s than individual concentrations of metabolites, and their relationship with volume of brain structures and memory performance is investigated.
Introduction
While the incidence of Alzheimer’s Disease (AD) worldwide increases1, disease-modifying therapies remain elusive and underlying mechanisms of the disease are still not understood. Due to its non-invasive nature, magnetic resonance spectroscopy (MRS) holds great potential as tool for investigation of neurochemical disease processes, therapy monitoring, and diagnosis. Previous MRS studies performed in AD reported mainly changes in the concentrations or creatine ratios of N-acetyl-aspartate (NAA), myo-inositol (Ins), and rarely total choline (Cho), with a change in the ratio between NAA and Ins being found as the strongest MRS derived predictor for AD2,3. Nevertheless, group differences of NAA/Ins ratios between cognitively healthy controls (HC), mild cognitively impaired (MCI) subjects, and AD patients are small. The transition of MRS to ultrahigh fields enables the quantification of additional metabolites interesting in AD – for example correlations between atrophy and concentrations of glutamate (Glu) and γ-amino-butyric acid (GABA) have been reported4. Therefore, we propose the combination of several metabolite concentrations associated with AD into a product-ratio to serve as a stronger MRS biomarker for AD than individual concentrations of metabolites. This study investigates the suitability of such product-ratios as biomarker, and examines their correlation with other AD biomarkers like volume of the right hippocampus (VrHC) and memory performance.Methods
All measurements were performed at a 7T whole body Magnetom MRI system (Siemens Healthineers, Erlangen, Germany) using a 1TX/32RX head coil (NOVA Medical, Wilmington, USA).
Cohort: So far, a subcohort of 74 subjects (36 HC, 17 MCI, 21 AD patients, mean age(SD): 71.6(7.2) years) from the NeuroMET cohort have undergone an MRI examination. All participants gave written, informed consent according to local ethics regulations.
Neuropsychological Testing: Participants memory performance was assessed using the German version of the Rey Auditory Verbal Learning Test5 (AVLT). Three scores were considered for further analyses: learning ability, delayed recall, and recognition.
Imaging: T1 weighted images were acquired using MP2RAGE6,7 (TR/TI1/TI2=5000ms/900ms/2700ms; α1/α2=7°/5°; resolution=0.75×0.75×0.75mm3). After image segmentation volumes of different cortical and subcortical structures were calculated using the Hammers atlas8 within CAT129. VrHC of individual subjects were then normalized10.
Spectroscopy: The MRS voxel (20×20×20mm3) was positioned in the posterior cingulate cortex, and localized RF calibration and 2nd order B0 shimming11 were performed prior to MRS measurements using SPECIAL12,13 (TE/TR=9ms/6500ms; 64 averages; VAPOR water suppression). A non-water-suppressed spectrum (4 averages) of the same voxel was acquired, as reference. Coil combination, frequency correction, and averaging were performed using an in house developed reconstruction algorithm. LCModel14 was employed for quantification. Metabolite concentrations were corrected for CSF fraction within the voxel and relaxation. Metabolite concentrations with Cramer-Rao lower bounds (CRLBs) >20% were excluded from further analysis.
Statistics: Both, individual metabolite concentrations and concentration ratios were compared between groups and unpaired t-tests were performed. Furthermore, the significance of correlations between either quantity and the VrHC as well as performance on the AVLT were investigated. All correlations were adjusted for age and sex.
Results and Discussion
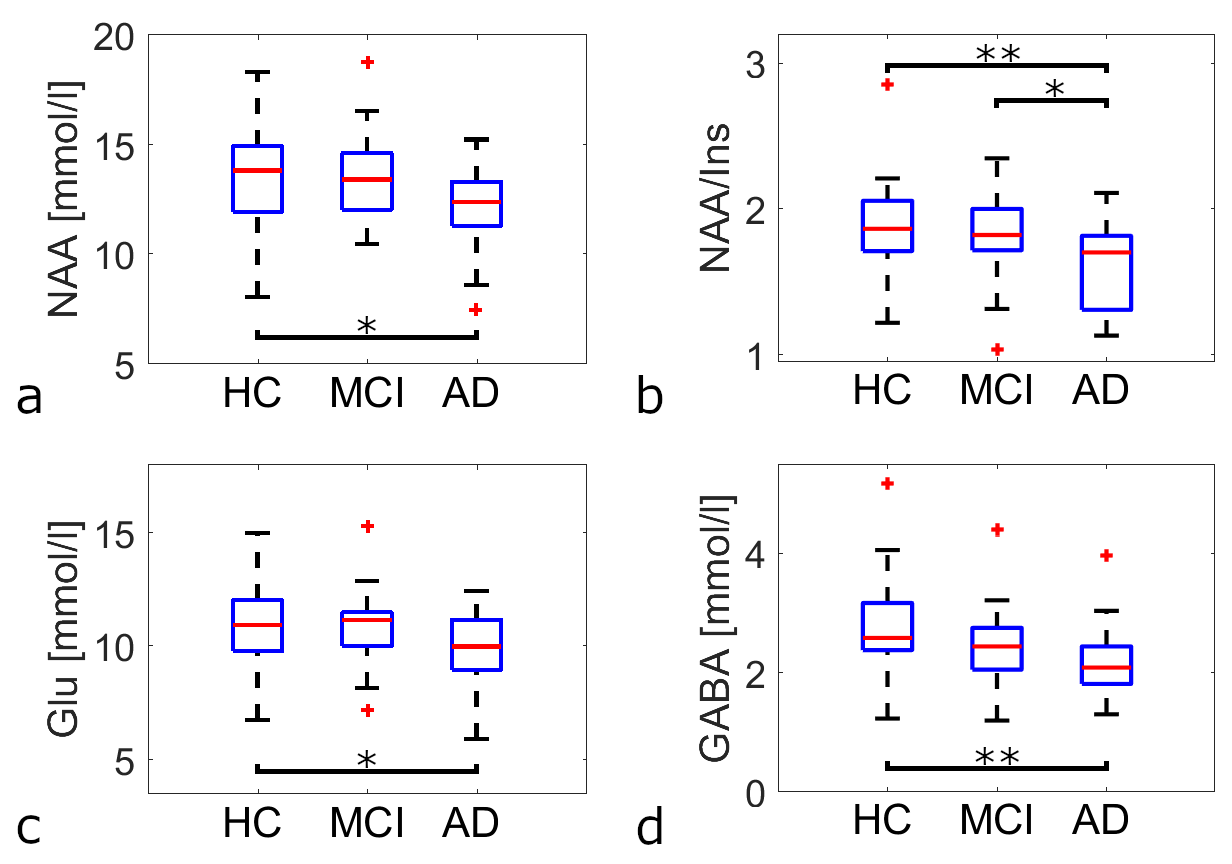
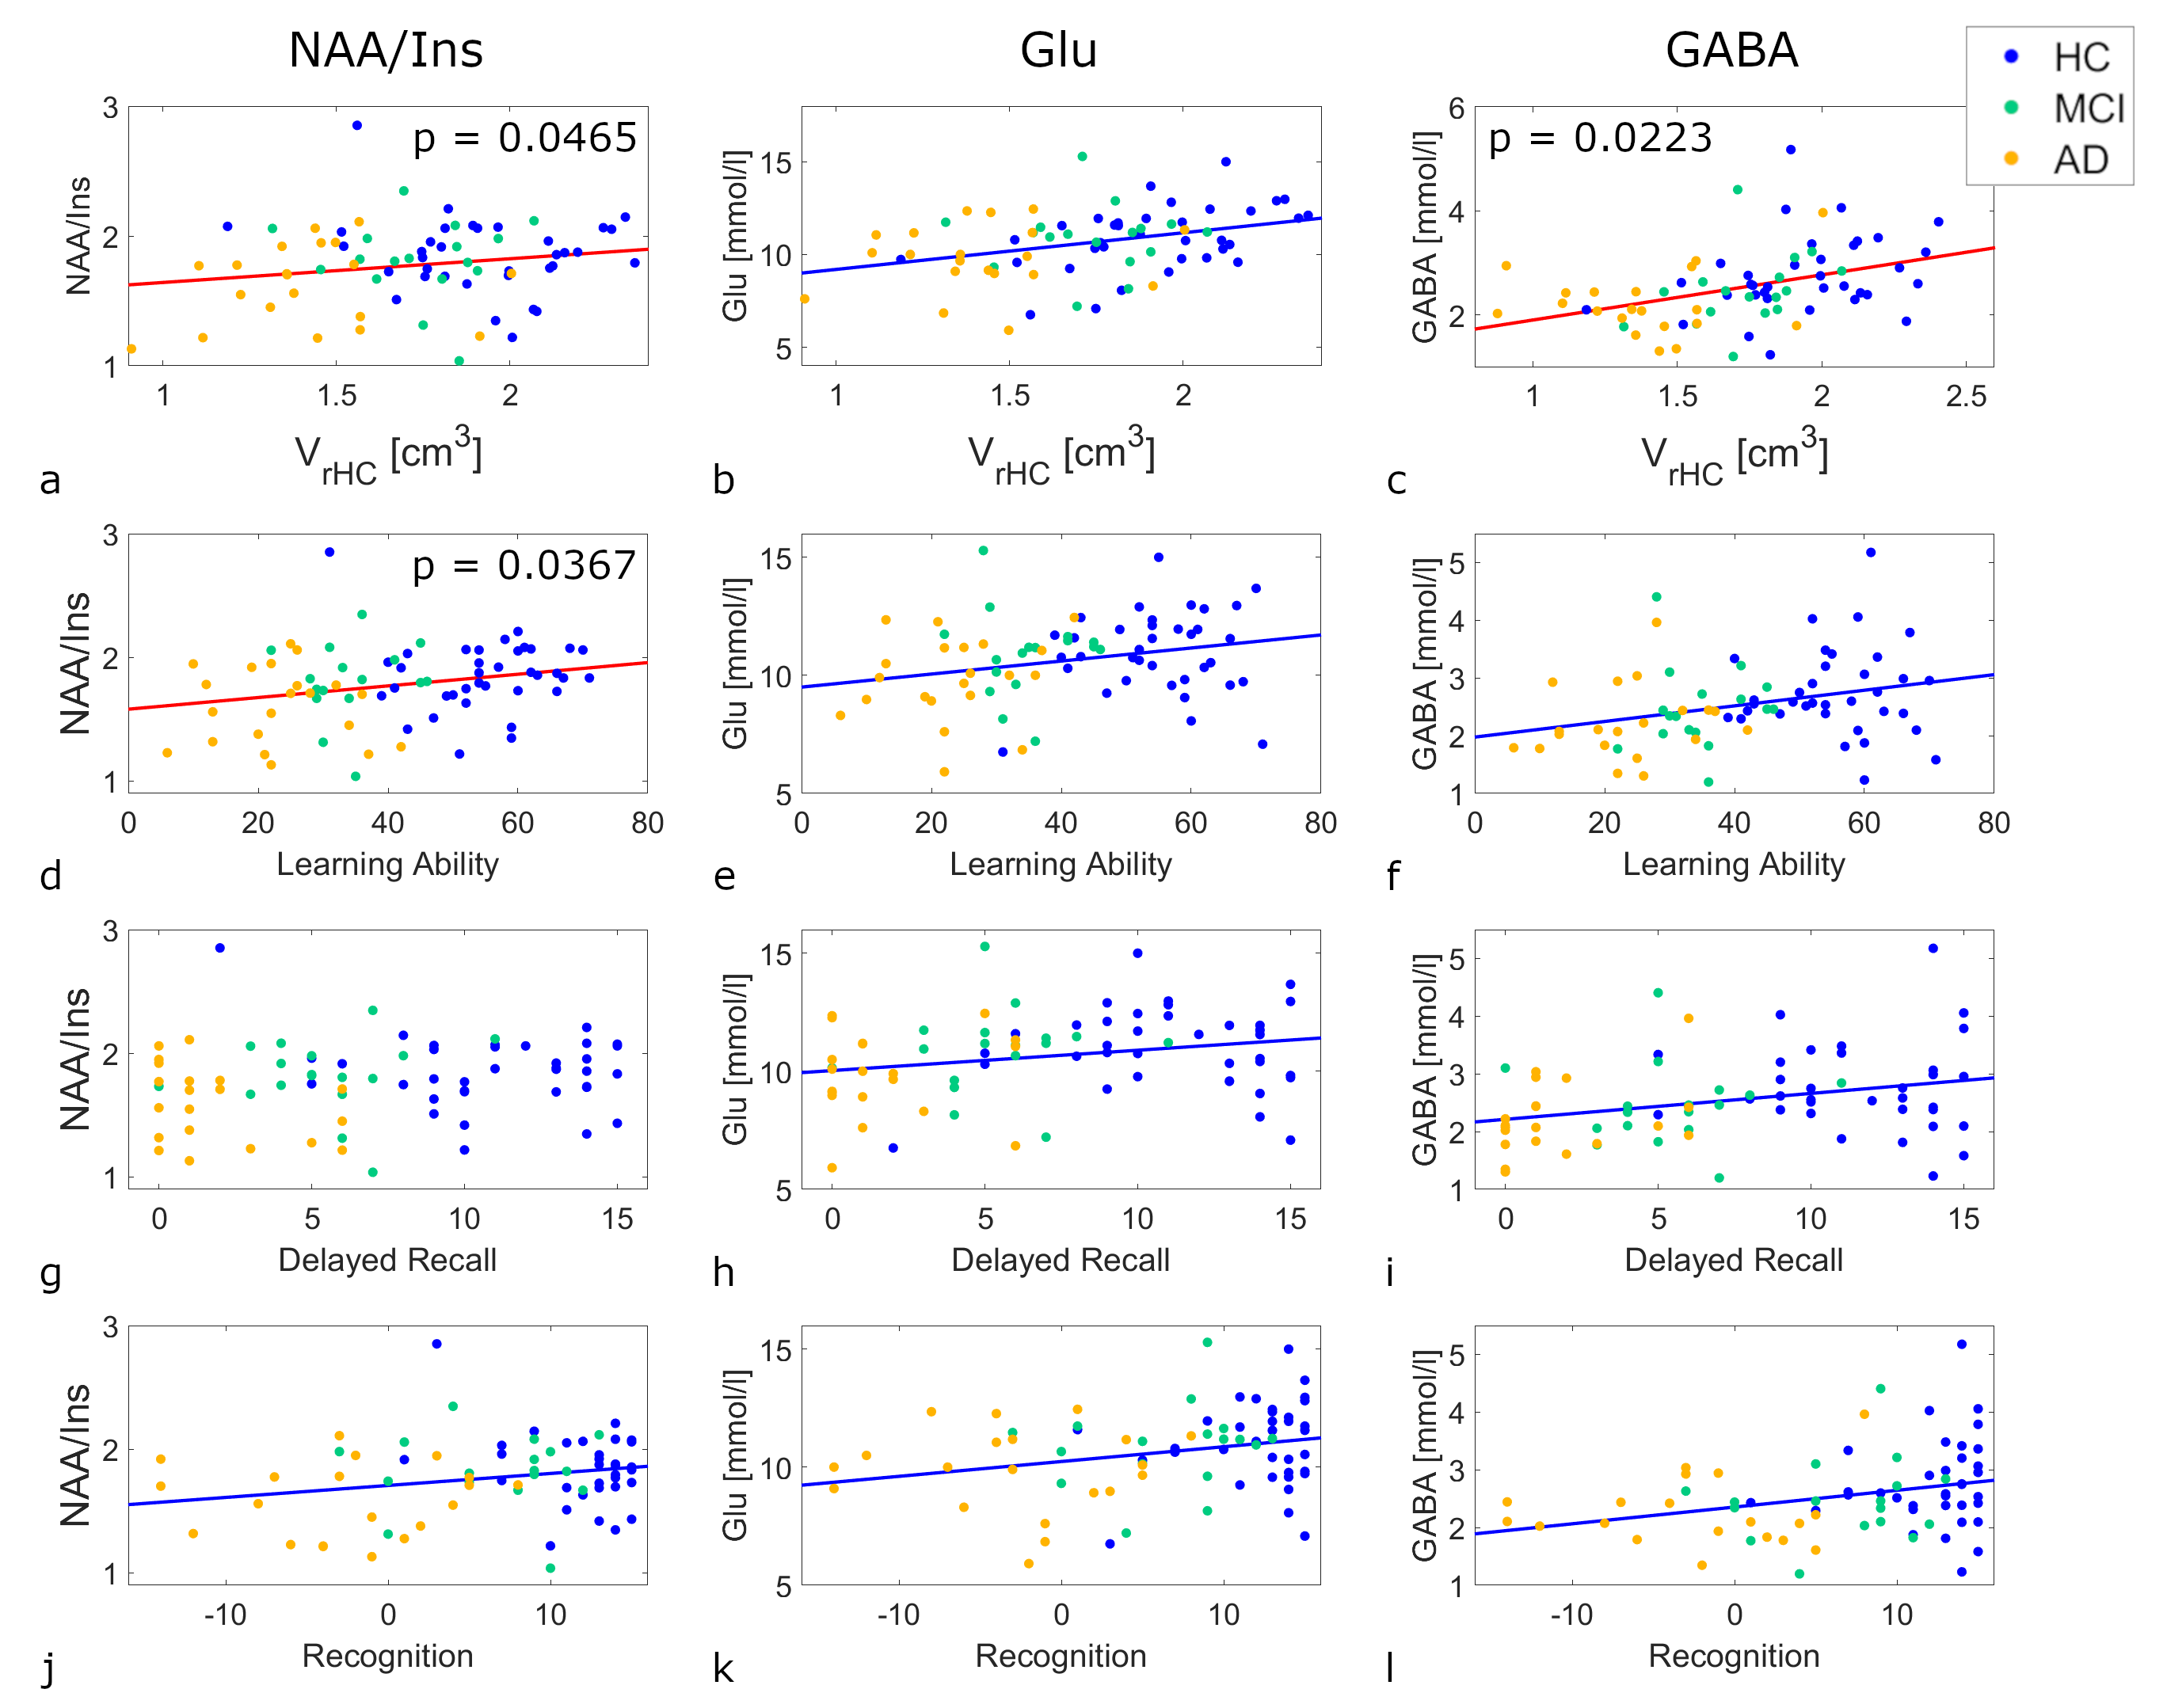
The high spectral quality achieved by SPECIAL and careful RF calibration and B0 shimming, allowed for robust quantification even of less distinctive metabolites, such as Glu or GABA. Group differences in neurometabolite concentrations are displayed in Figure 1. Significant differences can be seen between HC and AD in concentrations of NAA, Glu, and GABA, as well as the ratio NAA/Ins. Furthermore, a statistically significant difference between MCI and AD patients was found in the NAA/Ins ratio. In Figure 2 the NAA/Ins ratio and the Glu and GABA concentrations are plotted versus the VrHC (top) and their performance on the AVLT. A number of trends are observed (blue lines), but after adjustment for age and sex only the correlations of VrHC with NAA/Ins and GABA and NAA/Ins with learning ability remain significant.
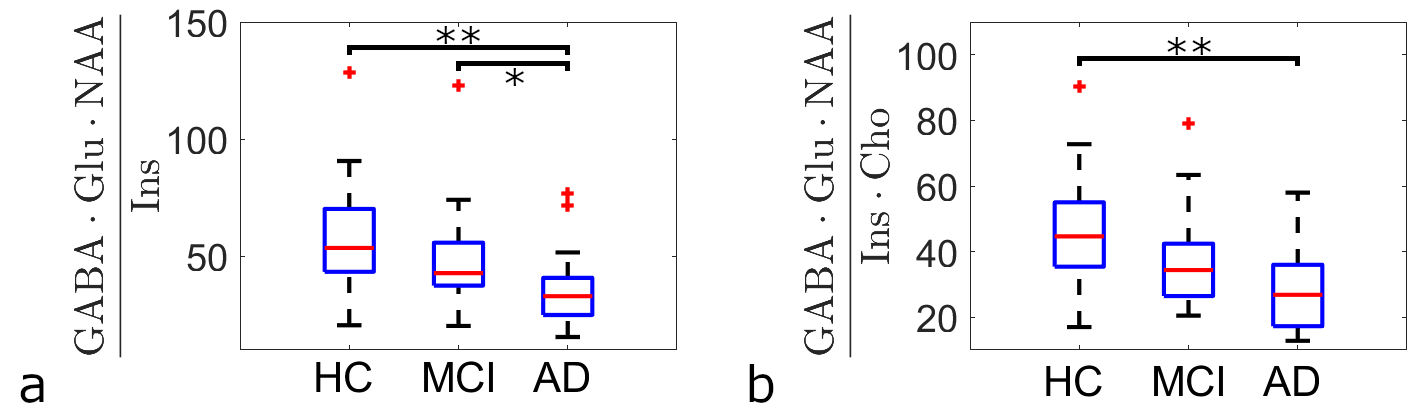
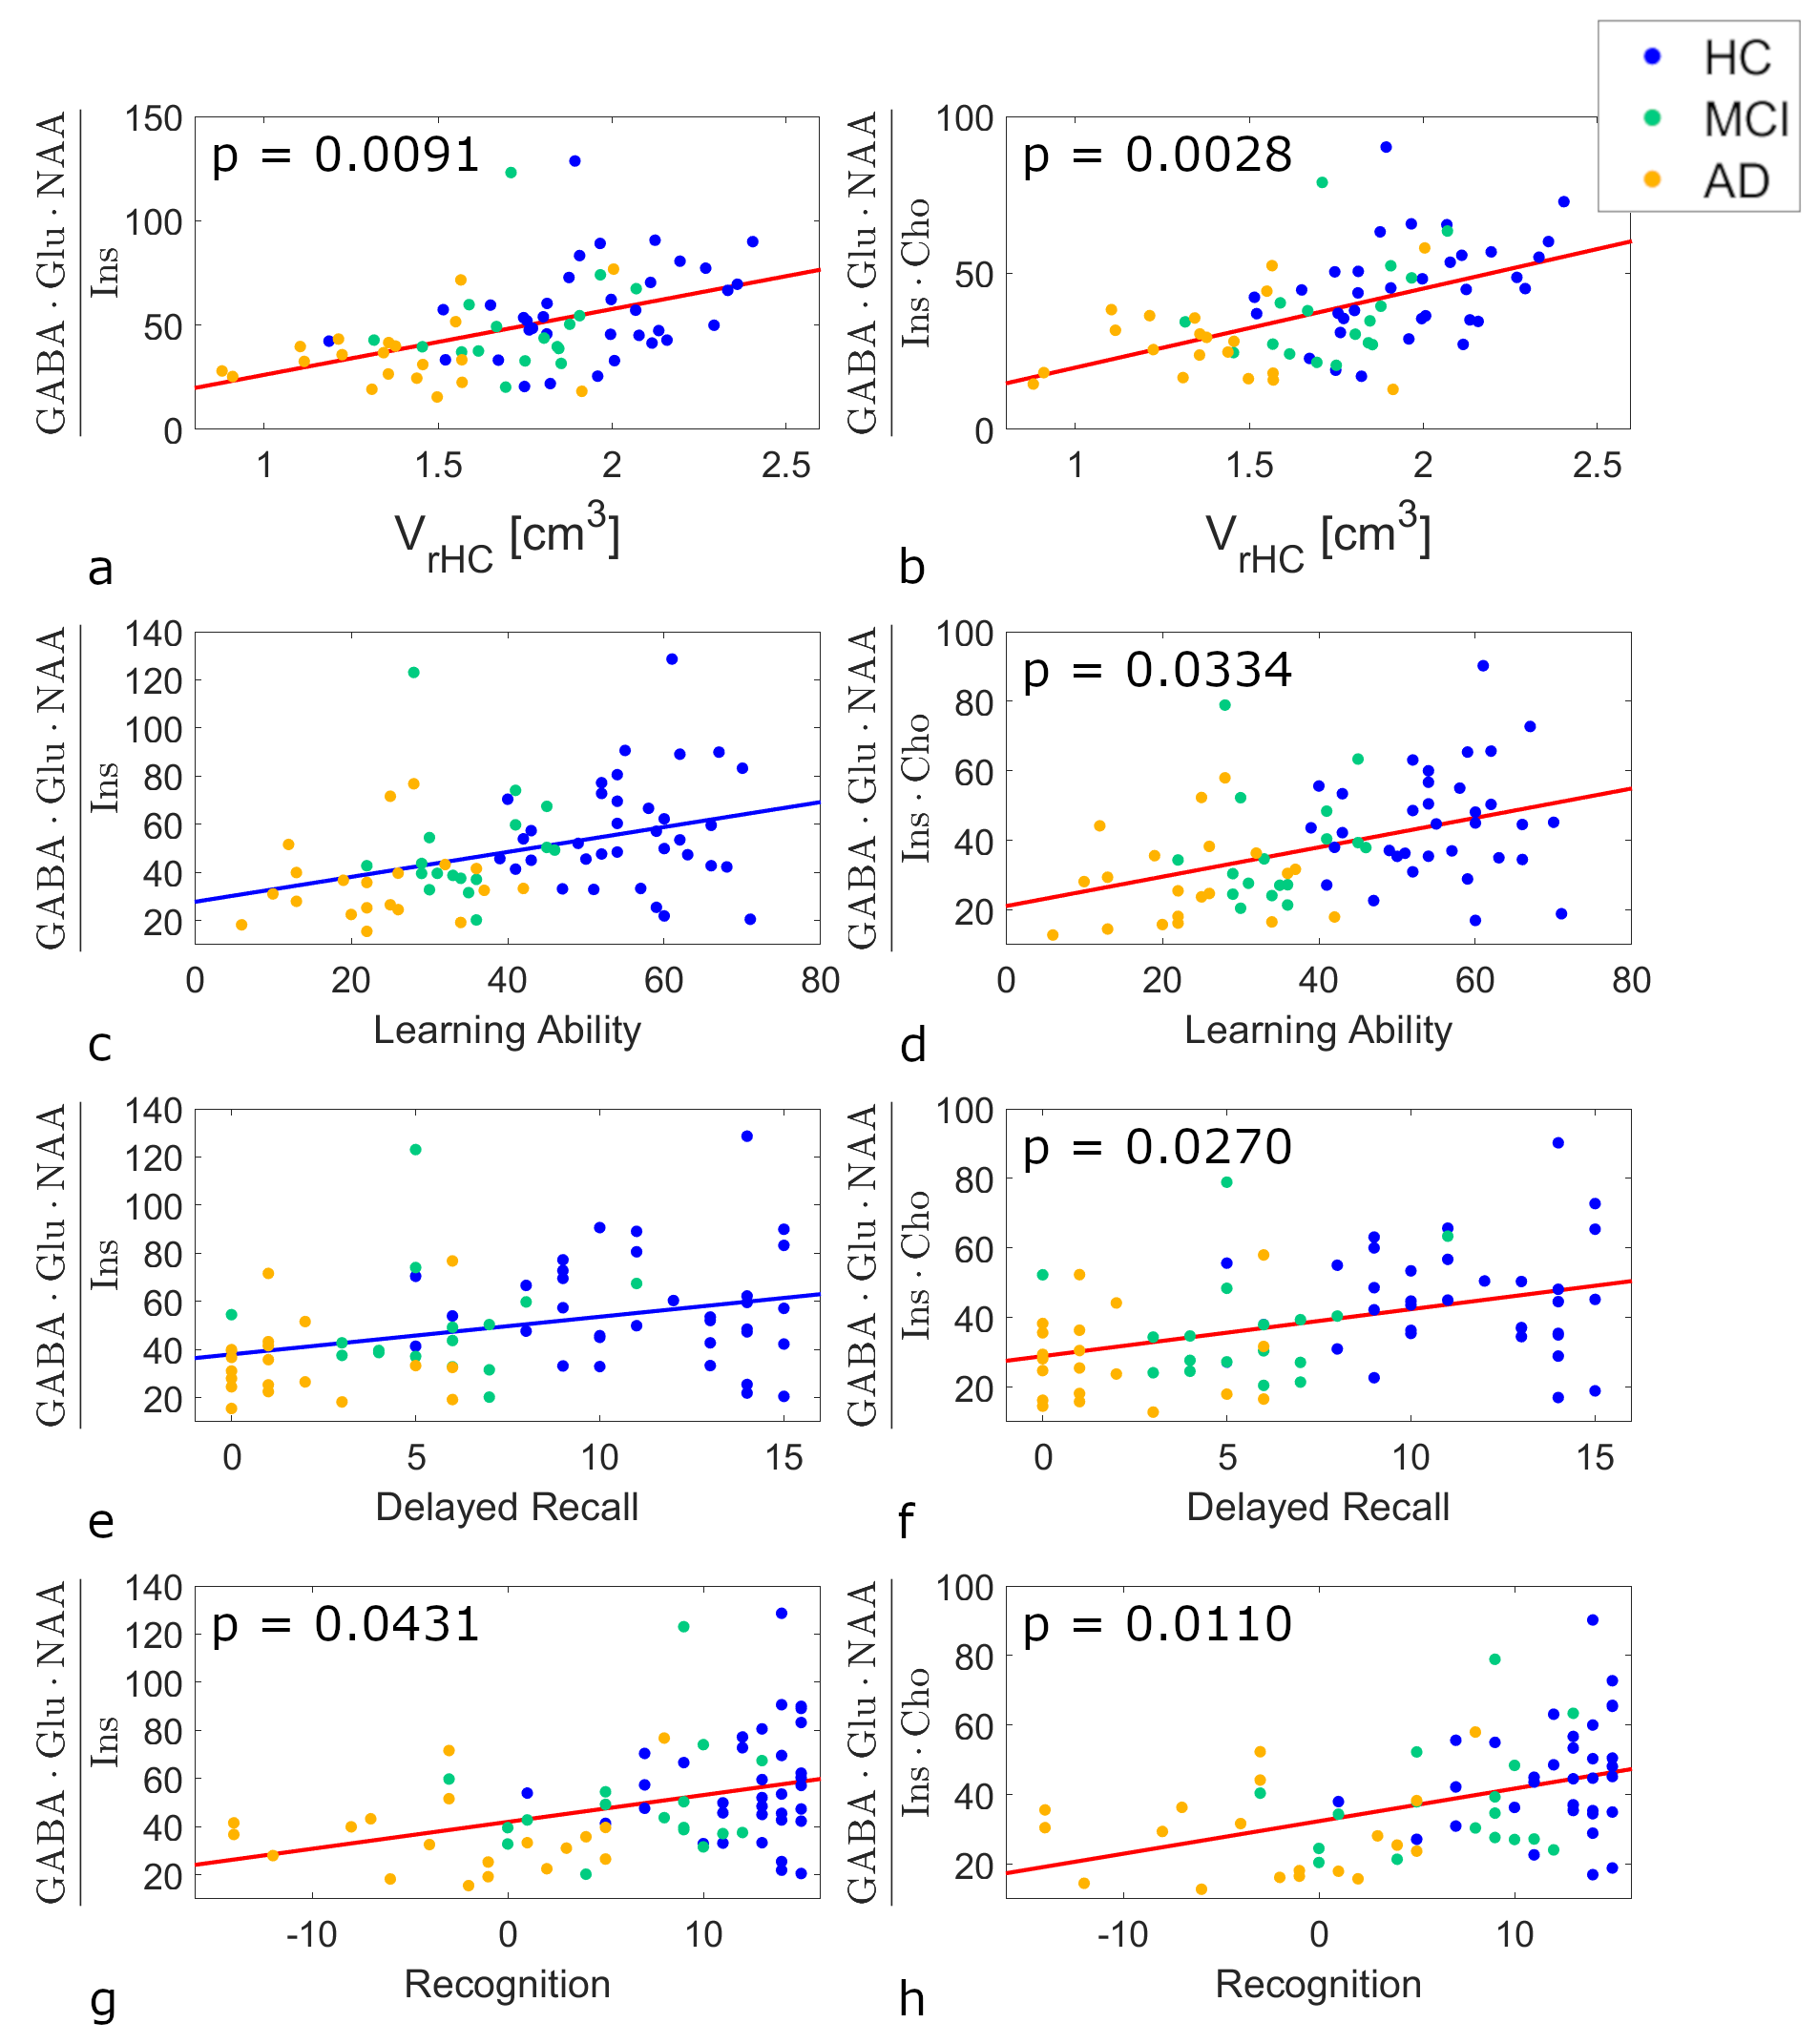
Figure 3a displays the group comparison of the product-ratio (GABA·Glu·NAA)/Ins, combining all metabolites exhibiting significant group differences. In Figure 3b the group comparison for the product-ratio (GABA·Glu·NAA)/(Ins·Cho) is shown, since the total choline concentration was also reported to change in previous studies2,3. Significant differences between HC and AD can be observed for both ratios, while in (GABA·Glu·NAA)/Ins also a significant difference between MCI and AD was found. Significant correlations between (GABA·Glu·NAA)/(Ins·Cho) and the VrHC as well as all performance ratings on the AVLT were observed (Fig.4b,d,f,h), while only correlations of (GABA·Glu·NAA)/Ins with VrHC (Fig.4a) and the AVLT recognition score (Fig.4g) remained significant after adjustment for age and sex.
Conclusion
This work demonstrates, that the combination of several metabolite concentrations that have previously been implicated in the pathophysiology of AD into a product-ratio might be a valuable additional biomarker and a potentially stronger predictor of AD.Acknowledgements
This project has received funding from the EMPIR programme co-financed by the Participating States and from the European Union’s Horizon 2020 research and innovation programme. This paper reflects only the author's view and EURAMET is not responsible for any use that may be made of the information it contains.References
[1] R. Brookmeyer, E. Johnson, K. Ziegler-Graham, H. M. Arrighi. "Forecasting the global burden of Alzheimer’s Disease". Alzheimers Dement 3:186-191 (2007)
[2] Wang H, Tan L, Wang HF, Liu Y, Yin
RH, Wang WY, Chang XL, Jiang T, Yu JT. "Magnetic
Resonance Spectroscopy in Alzheimer’s Disease: Systematic Review and
Meta-Analysis". J Alzheimers Dis 46: 1049–1070 (2015)
[3] B.J. Soher, P. M. Doraiswamy, H. C. Charles "A Review of 1H MR Spectroscopy Findings in Alzheimer’s Disease". Neuroimag Clin N Am 15: 847-852 (2005)
[4] A. Fillmer, T. Köbe, S. Aydin, L. Göschel, A. Flöel, F. Schubert, B. Ittermann. "Correlations Between Brain Structural Volumes and Brain Metabolite Concentrations in Alzheimer’s Disease: Preliminary Results from the NeuroMET Project". Proc Int Soc Magn Reson Med 26: 3903 (2018)
[5] M.D. Lezak, D.B. Howieson, D.W. Loring, J.S. Fischer. "Neuropsychological Assessment". Oxford: Oxford University Press, New York, NY (2004)
[6] J.P. Marques, T. Kober, G. Krueger, W. van der Zwaag, P.-F. Van de Mortele, R. Gruetter. "MP2RAGE, a self bias-field corrected sequence for improved segmentation and T1-mapping at high field". NeuroImage 49:1271-1281 (2010)
[7] K. R. O’Brien, T. Kober, P. Hagmann, P. Maeder, J. Marques, F. Lazeyras, G. Krueger, A. Roche. "Robust T1-Weighted Structural Brain Imaging and Morphometry at 7T Using MP2RAGE". PLOS One 9:e99676 (2014)
[8] A. Hammers, R. Allom, M. J. Koepp, S. L. Free, R. Myers, L. Lemieux, T. N. Mitchell, D. J. Brooks, J. S. Duncan. "Three-Dimensional Maximum Probability Atlas of the Human Brain, With Particular Reference to the Temporal Lobe". Hum Brain Mapp 19:224-247 (2003)
[9] C. Gaser, R. Dahnke. "CAT – A Computational Anatomy Toolbox for the Analysis of Structural MRI Data." HBM 2016:33-348 (2016)
[10] N. Raz, U. Lindenberger, K. M. Rodrigue, K. M. Kennedy, D. Head, A. Williamson, C. Dahlke, D. Gerstorf, J. D. Acker. "Regional Brain Changes in Aging Healthy Adults: Genderal Trends, Individual Differences and Modifiers". Cerebral Cortex 15:1676-1689 (2005)
[11] S. Nassirpour, P. Chang, A. Fillmer, A. Henning. "A Comparison of Optimization Algorithms for Localized in Vivo B0 Shimming". Magn Reson Med 79: 1145-1156 (2018)
[12] V. Mlynarik, G. Gambarota, H. Frenkel, R. Gruetter. "Localized Short-Echo-Time Proton MR Spectroscopy With Full Signal-Intensity Acquisition". Magn Reson Med 56: 956-970 (2006)
[13] R. Mekle, V. Mlynarik, G. Gambarota, M. Hergt, G. Krueger, R. Gruetter. "MR Spectroscopy of the Human Brain With Enhanced Signal Intensity at Ultrashort Echo Times on a Clinical Platform at 3T and 7T". Magn Reson Med 61: 1279-1285 (2009)
[14] S. W. Provencher. "Estimation of metabolite concentrations from localized in vivo proton NMR spectra". Magn Reson Med 30: 672-679 (2993)
Figures