0617
High-resolution fMRI maps of columnar organization in human primary somatosensory cortex1Graduate School of Interdisciplinary Science and Engineering in Health Systems, Okayama University, Okayama, Japan, 2Section on Functional Imaging Methods, National Institute of Mental Health, Bethesda, MD, United States, 3The Japan Society for the Promotion of Science, Tokyo, Japan, 4Functional MRI Core Facility, National Institute of Mental Health, Bethesda, MD, United States
Synopsis
More than half a century ago, animal studies revealed that area 3b of the primary somatosensory cortex (S1) receives cutaneous input from slow-adapting (SA) and rapidly adapting (RA) cutaneous receptors in a columnar manner. However, there have been no direct observations of columnar origination in the human SI. Here, for the first time, we investigate the columnar organization in the human S1 by using advanced high-resolution (0.7mm) fMRI at 7T. We find that the human area 3b is columnar organized with alternating SA and RA columnar preferences. We find that SA selective stimulation evokes activity in the middle layers only.
INTRODUCTION
There are four primary tactile mechanoreceptors located in the skin. Each receptor plays a different functional role in the resulting refined sense of touch. Specifically, the slow-adapting (SA) precipitators of Merkel’s disks and Ruffini endings respond to light touch and flutter (<10Hz). In contrast, Meissner’s corpuscles and Pacinian corpuscle are rapidly adapting (RA) receptors that sense high-frequency (30 ~ 200 Hz) vibration1. Early animal studies2,3,4 confirmed the homogeneity of SA and RA inputs within a vertical column pattern in S1 (i.e., area 3b) (as indicated in Figure 1(a)), however, there have been no direct observations of columnar organization in the human S1. In the present study, we employ advanced high-resolution (0.7mm) fMRI at 7T5,6to investigate the columnar origination in the human S1 by means of a sophisticated roughness stimulation setup.METHODS
Five participants were asked to undergo one or two 26 min fMRI experiments at a 7T Siemens scanner, equipped with a 32-channel NOVA Medical head coil and SC72 body gradient. Data acquisition procedures were used as described in our previous study5,6. In short: We used a multi-contrast VASO7-BOLD sequence with slices positioned to be approximately perpendicular to the cortex of the central sulcus (Figure 2(a)). (Nominal in-plane resolution = 0.71mm, TI1/TI2/TR = 1.1/2.6/3.4s, twelve slices with FLASH GRAPPA-2, matrix 46x138, 3D-EPI readout8, FOV 32.7x97.9x10.8mm3).To selectively simulate SA and RA receptors, we used a unique surface roughness estimation paradigm as shown in Figure 1(b). Three 3D printed stimuli (dot spacing: 2, 3 and 4mm) and acustom-designed device (Figure 1(c) and (d)) were used in the present study. The hemispheroidal raised dots were elevated by 1.5mm from the surface and were 1.0mm in diameter. The dot patterns were printed on the flat surface with a 40×50mm square base. In each functional run, three surfaces in random order were moved under participants’ index or middle fingers in each task block (37.4 s) and each task block was followed by a 26.2s rest. To generate low and high frequency “vibration”, the motion speed of 12 blocks was 8mm/s (i.e., 2~4Hz) and other 12 blocks was 80mm/s (i.e., 20~40Hz). The participants were asked to estimate the roughness of three surfaces of each block and indicated which one is the roughest of three surfaces by pressing a response key at the end of each block (Figure 1(b)). Layer and columnar analyses were done in the software suite LAYNII (https://github.com/layerfMRI/LAYNII).RESULTS
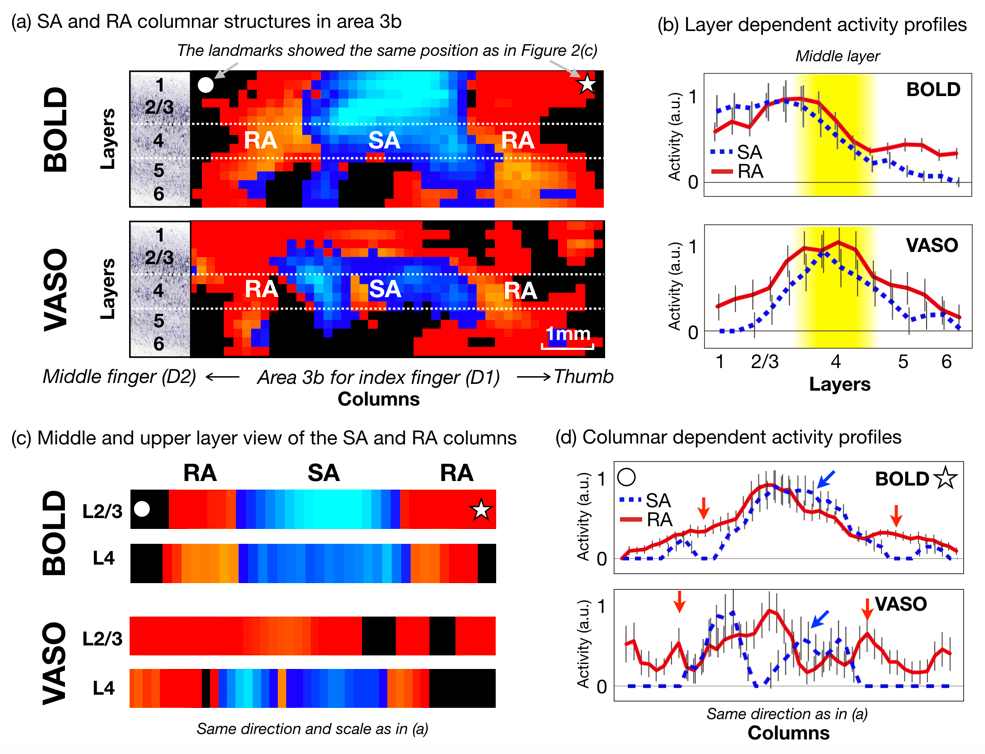
Initially, we confirmed that the roughness estimation tasks (relative to the baseline) activated contra-lateral areas in 3b and 2 (Figure 2(d)). When we directly compared the activation maps of high and low frequency conditions, we find that the activation of the high frequency condition occupied the whole index finger area in the 3b region. However, the low frequency condition activated the middle part in the same region only (Figure 2(e)), as expected from previous invasive animal studies. Furthermore, when we extracted the fMRI signal across an orthogonal coordinate system of ‘layers’ x ‘columns’ (Figure 3(a) and (c)), we clearly confirmed the double sides RA columns and middle SA column in area 3b (activation profiles are shown in Figure 3(d)). The layer profiles of each column (Figure 3(b)) are also consistent with previous results in animals. Namely, SA receptors predominantly activate the middle layer of area 3b, while RA receptors activated all layers in area 3b.DISCUSSION
In the present study, we used sub-millimeter BOLD and blood-volume-sensitive (VASO) fMRI5,6at 7T to demonstrate that area 3b of human is divided into alternating SA and RA columns. Furthermore, the use of VASO fMRI, which is specific and sensitive enough to reveal functional laminar activity, allowed us to find both SA and RA selective stimulation evoked activity in the middle layers of the 3b. RA selective stimulation, on the other hand, activates the superficial and deep layers as well. We regard these observations as an important step towards the understanding of the columnar organization of the human somatosensory system.CONCLUSION
To explore columnar organization in human area 3b, we use advanced high-resolution fMRI at 7T with a unique surface roughness estimation paradigm.This study suggests that the cutaneous input projected to area 3b is divided into alternating columns of neurons preferentially sensitive to the SA and RA receptors. These results are the first clear findings confirming the columnar organization of the human somatosensory cortex. This study provides a new starting point for non-invasive investigations of columnar organization in the human somatosensory system.Acknowledgements
We thank Benedikt Poser and Dimo Ivanov for the 3D-EPI readout that is used in the VASO sequence used here. We thank Kenny Chung for administrative support of human volunteer scanning. This research is supported by the NIMH Intramural Research Program (#ZIA-MH002783), JSPS KAKENHI Grant Numbers JP17J40084, JP18K15339, JP18H05009, JP17K18855 and Japan-U.S. Science and Technology Cooperation Program (Brain Research). The study was approved under NIH Combined Neuroscience Institutional Review Board protocol #93-M-0170 (ClinicalTrials.gov identifier: NCT00001360).References
1. Sripati AP, Yoshioka T, Denchev P, Hsiao SS, Johnson KO. Spatiotemporal receptive fields of peripheral afferents and cortical area 3b and 1 neurons in the primate somatosensory system. J Neurosci 2006; 26: 2101-14.
2. Mountcastle VB, Berman AL, Davies PW. Topographic organization and modality representation in first somatic area of cat’s cerebral cortex by method of single unit analysis. Am. J. Physiol. 1955;183, 464.
3. Sur M, Wall JT, Kaas JH. Modular segregation of functional cell classes within the postcentral somatosensory cortex of monkeys. Science 1981; (80) 212:1059–1061.
4. Sur M, Wall JT, Kaas JH. Modular distribution of neurons with slowly adapting and rapidly adapting responses in area 3b of somatosensory cortex in monkeys. J Neurophysiol 1984; 51:724–744.
5. Huber L, Handwerker DA, Jangraw DC, Chen G, Hall A, Stüber C, Gonzalez-Castillo J, Ivanov D, Marrett S, Guidi M, Goense J, Poser BA, Bandettini PA. High-Resolution CBV-fMRI Allows Mapping of Laminar Activity and Connectivity of Cortical Input and Output in Human M1. Neuron 2017; 1253–1263.
6. Yu Y, Huber L, Jangraw DC, Molfese PJ, Hall A, Handwerker DA, Yang J, Bandettini PA: Depth-dependent functional mapping of mental prediction in human somatosensory cortex. In Proceedings of the 26th Annual Meeting of ISMRM, Paris, France, abstract 2018; 393.
7. Lu H, Golay X, Pekar JJ, van Zijl PCM. Functional magnetic resonance imaging based on changes in vascular space occupancy. MRM, 2003;50:263-274,
8. Poser BA, Koopmans PJ, Witzel T, Wald LL, Barth M. Three dimensional echo-planar imaging at 7 tesla. NeuroImage, 2010;51: 261-266.
Figures