0616
Probing spatio-temporal information during attention modulations in humans with sub-second sampling of cortical depth dependent BOLD fMRI signals at 7T1CMRR, University of Minnesota, Minneapolis, MN, United States
Synopsis
Temporal dynamics of the BOLD signal have been recently exploited with fast TR fMRI. However, the ability to concurrently retain sub-millimeter spatial resolution along with high temporal resolution (e.g. =< ~600 ms TR), with sufficient SNR efficiency, has been elusive. Such a data set could provide unprecedented access to studying the human brain non-invasively. In this work, we push the spatio-temporal limits of 7T fMRI and investigate the possibility of exploiting BOLD temporal dynamics as a function of cortical depth, using spatio-temporal multi-voxel pattern analysis during attention modulations.
Introduction
The sluggishness of the blood oxygenation level dependent (BOLD) signal (1) has historically focused applications to the spatial precision of the response. At ultra-high field (UHF), functional voxels span the sub-millimeter range (e.g. 2). Such high-resolution images allow recording BOLD responses at the spatial scale of the most fundamental units of neural computation: cortical layers and columns. In contrast, because of the hemodynamic sluggishness, the temporal information in the BOLD signal has been largely ignored, in the belief that it does not carry precise information about neuronal dynamics. More recently, however, a number of groups have demonstrated that (specifically at UHF), not only do sub-second BOLD measurements carry substantial neuro-temporal information, but they do so with a much higher precision than previously thought (e.g. 3; 4). Up until now, due to signal to noise ratio (SNR) limitations, spatial and temporal dynamics of the BOLD signal have been studied independently, optimizing one at the detriment of the other. Spatially fine measurements (e.g. <=0.8 mm isotropic voxels) have been recorded with a temporal resolution well above the second range (e.g. >2 seconds (e.g. 1)). On the other hand, temporally fine measurements (e.g. =<600 ms TR) have been acquired with coarse spatial resolutions (e.g. => 2 mm isotropic voxels (4)). Here, we exploit the advantages of UHF and SNR efficient parallel accelerations, to record BOLD images at 7T with unprecedented spatio-temporal resolution (i.e. 0.85 isotropic voxels with a 625 ms TR). These data allow investigating a number of neuroscience questions that have thus far remained elusive, including the neuro-temporal dynamics of cortical layers.Methods
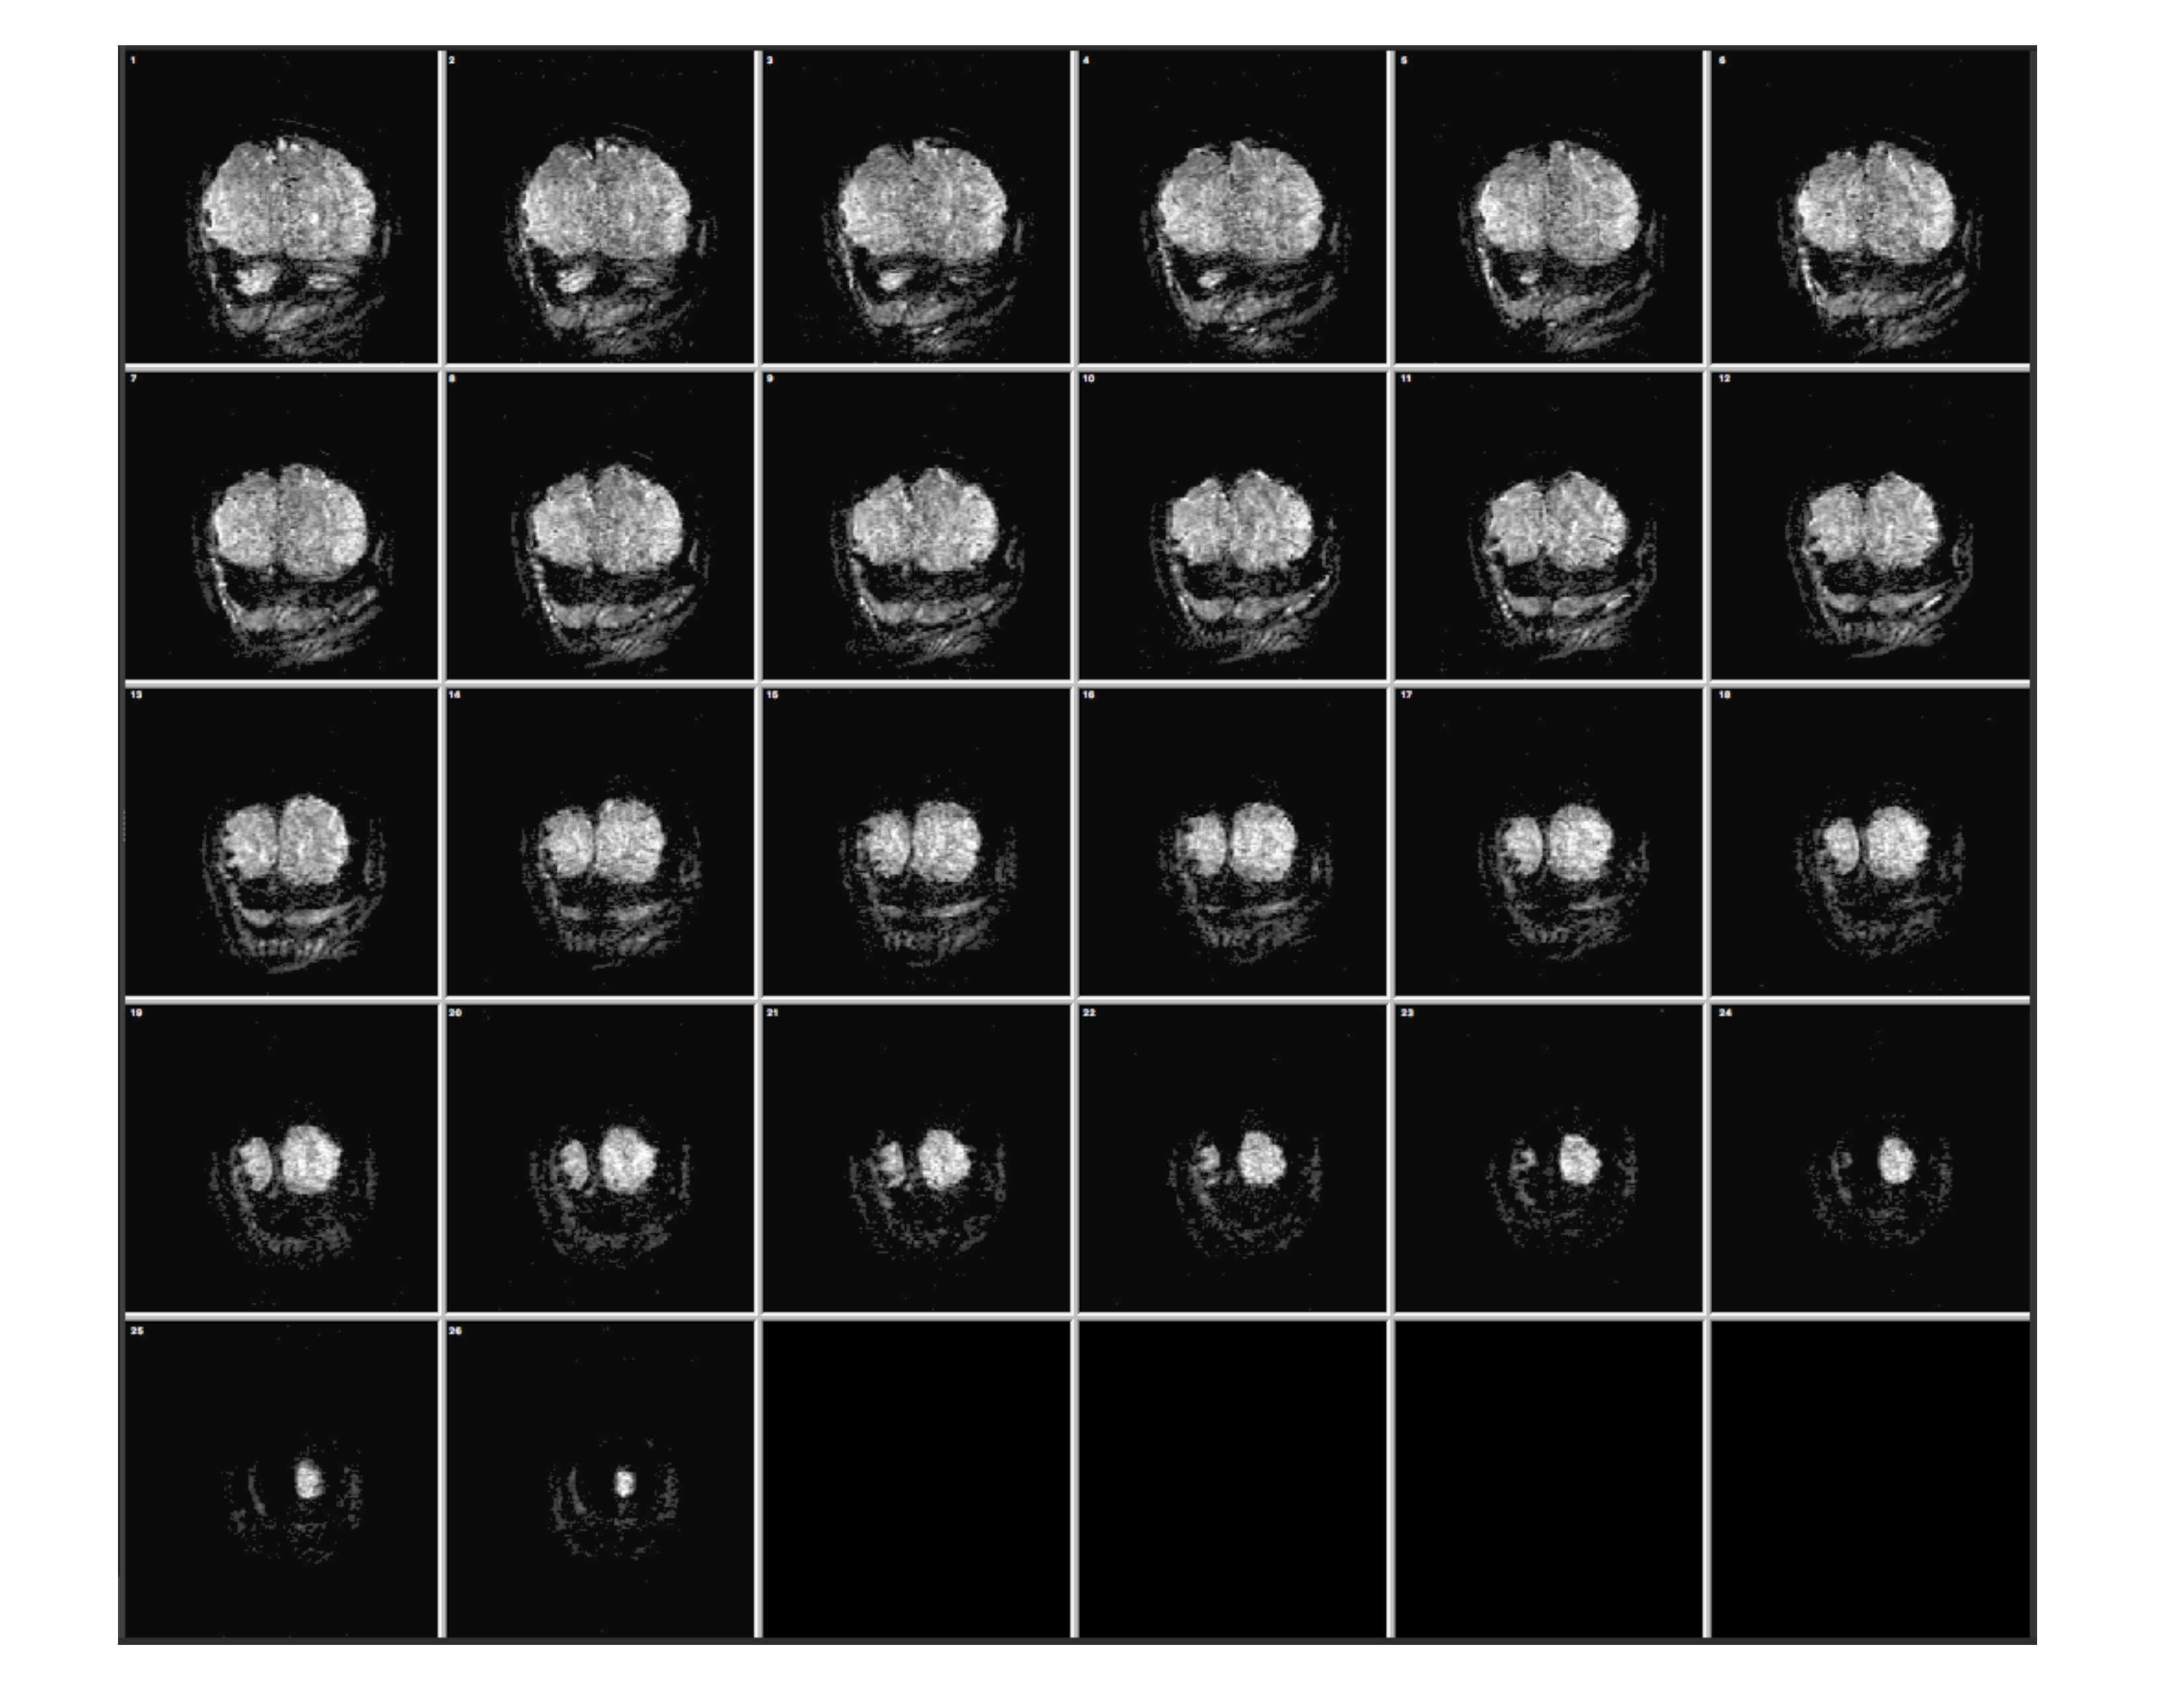
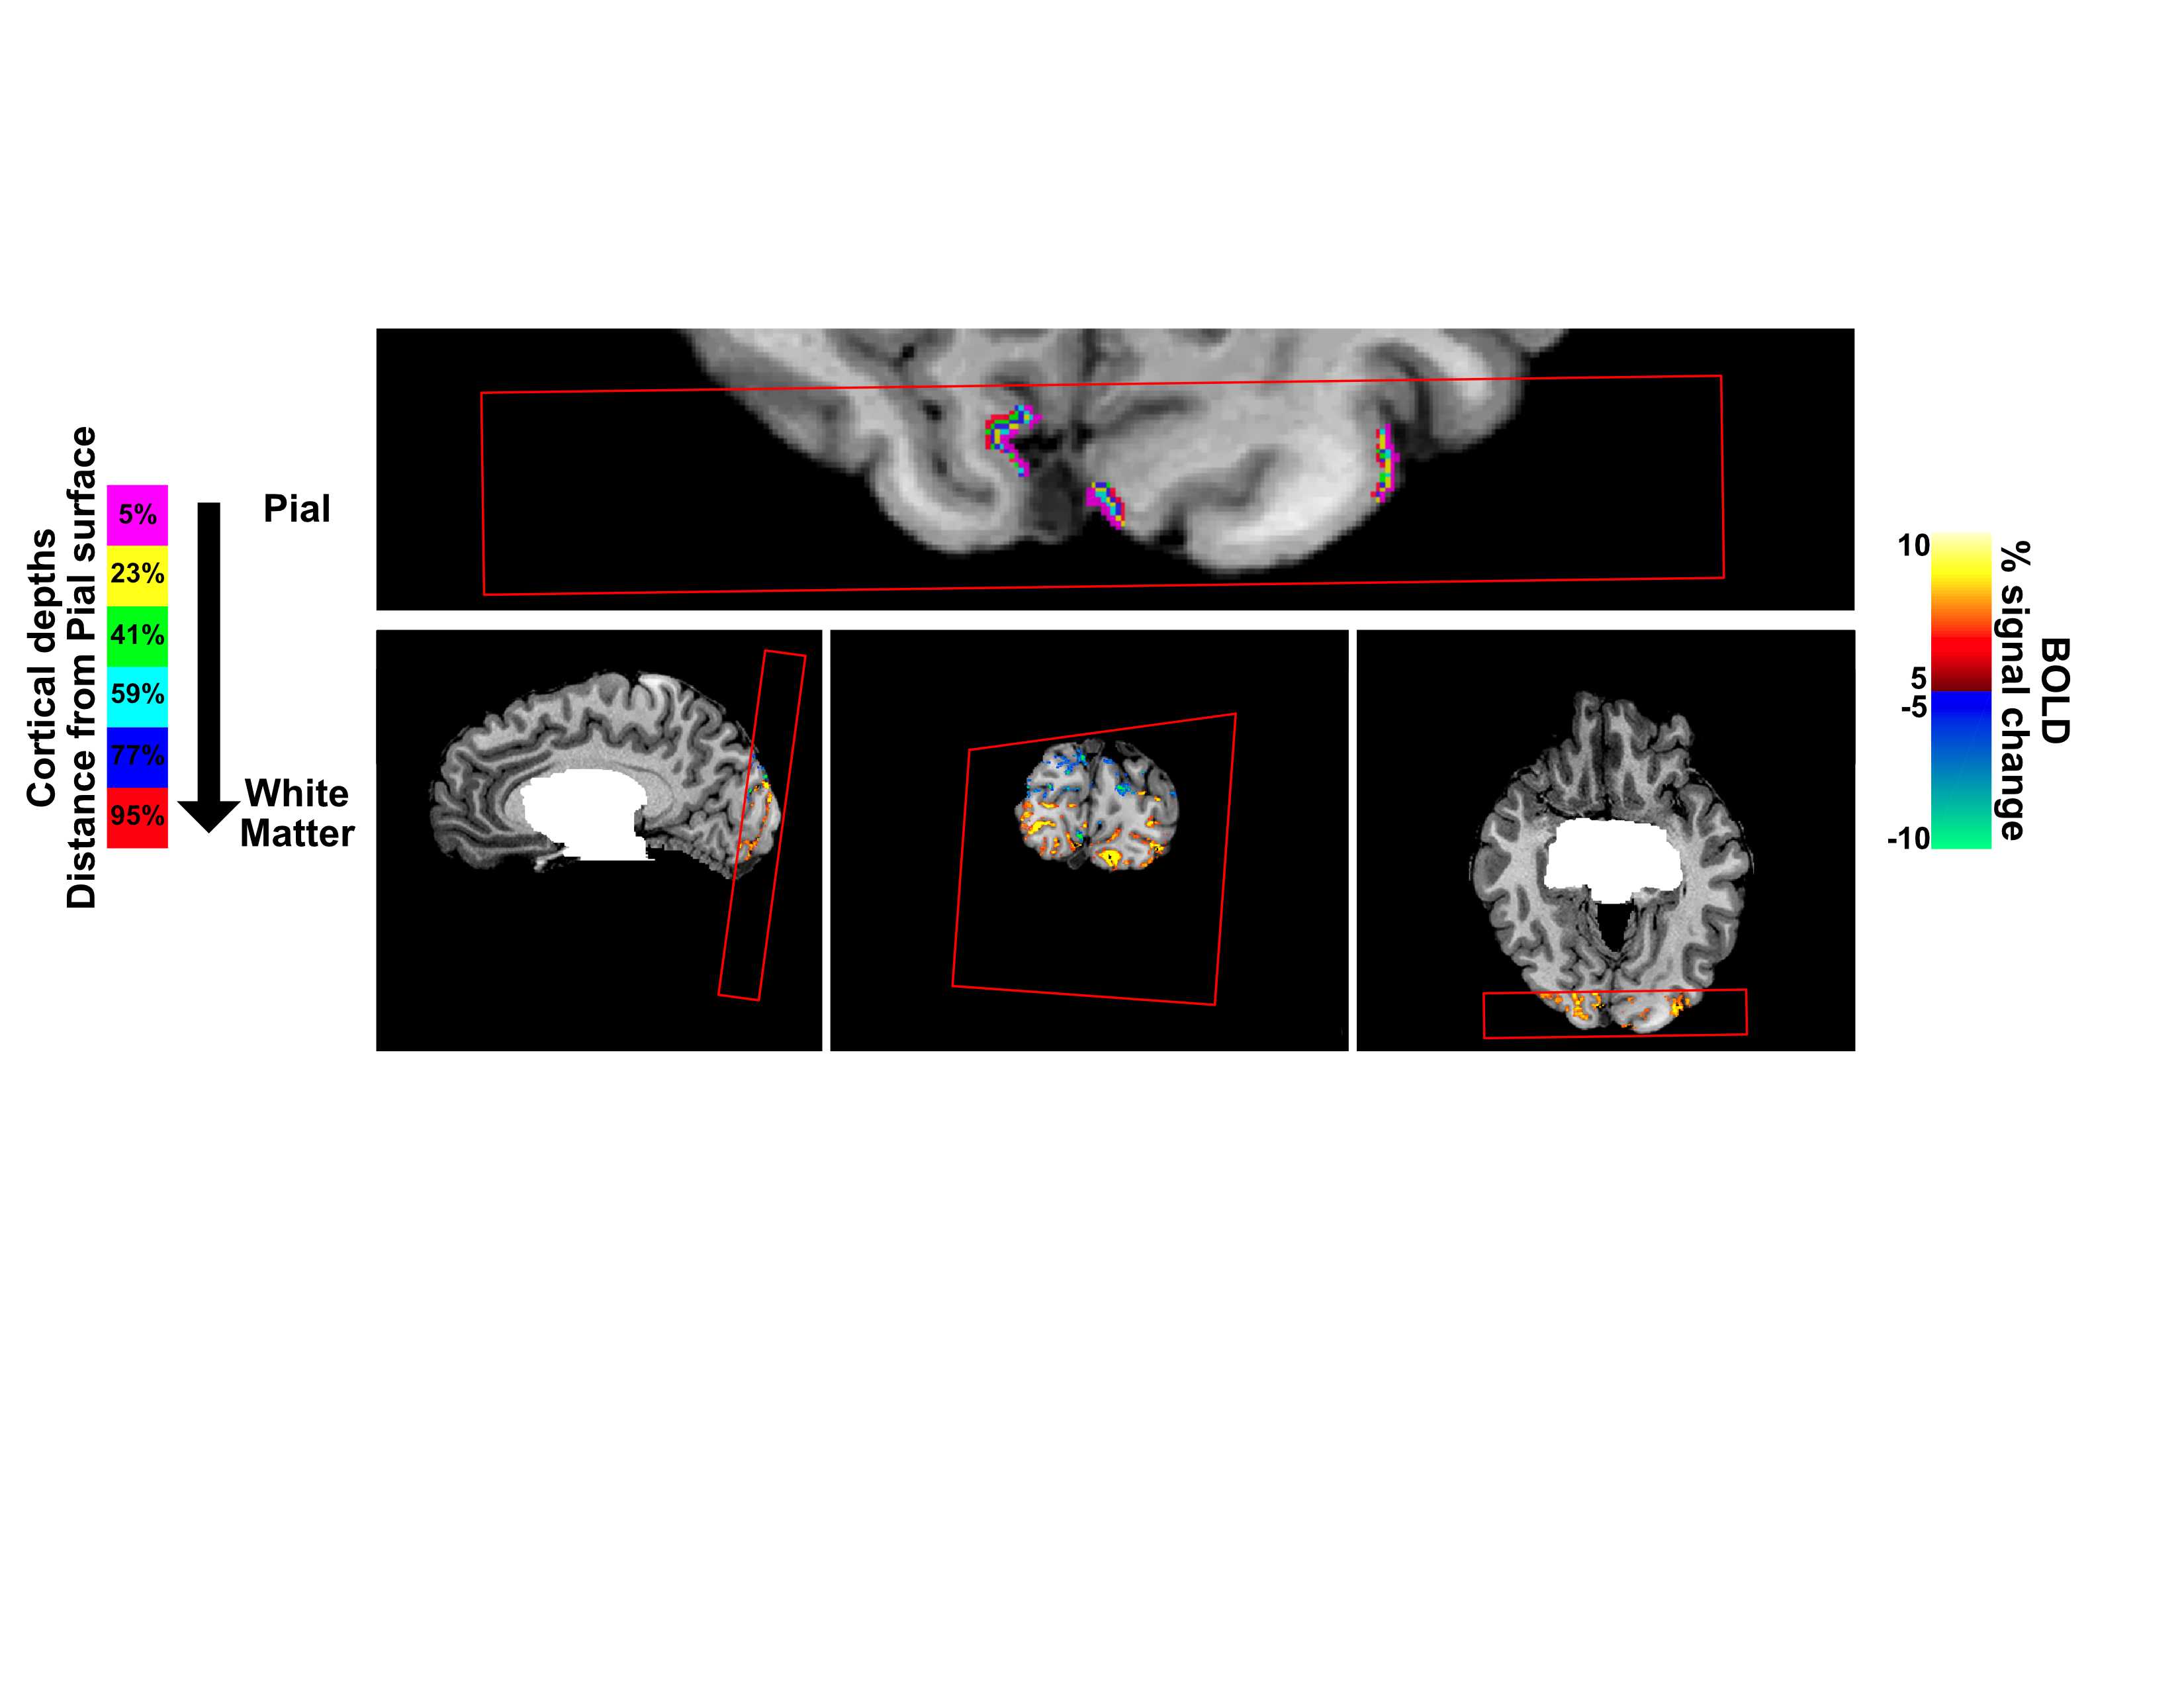
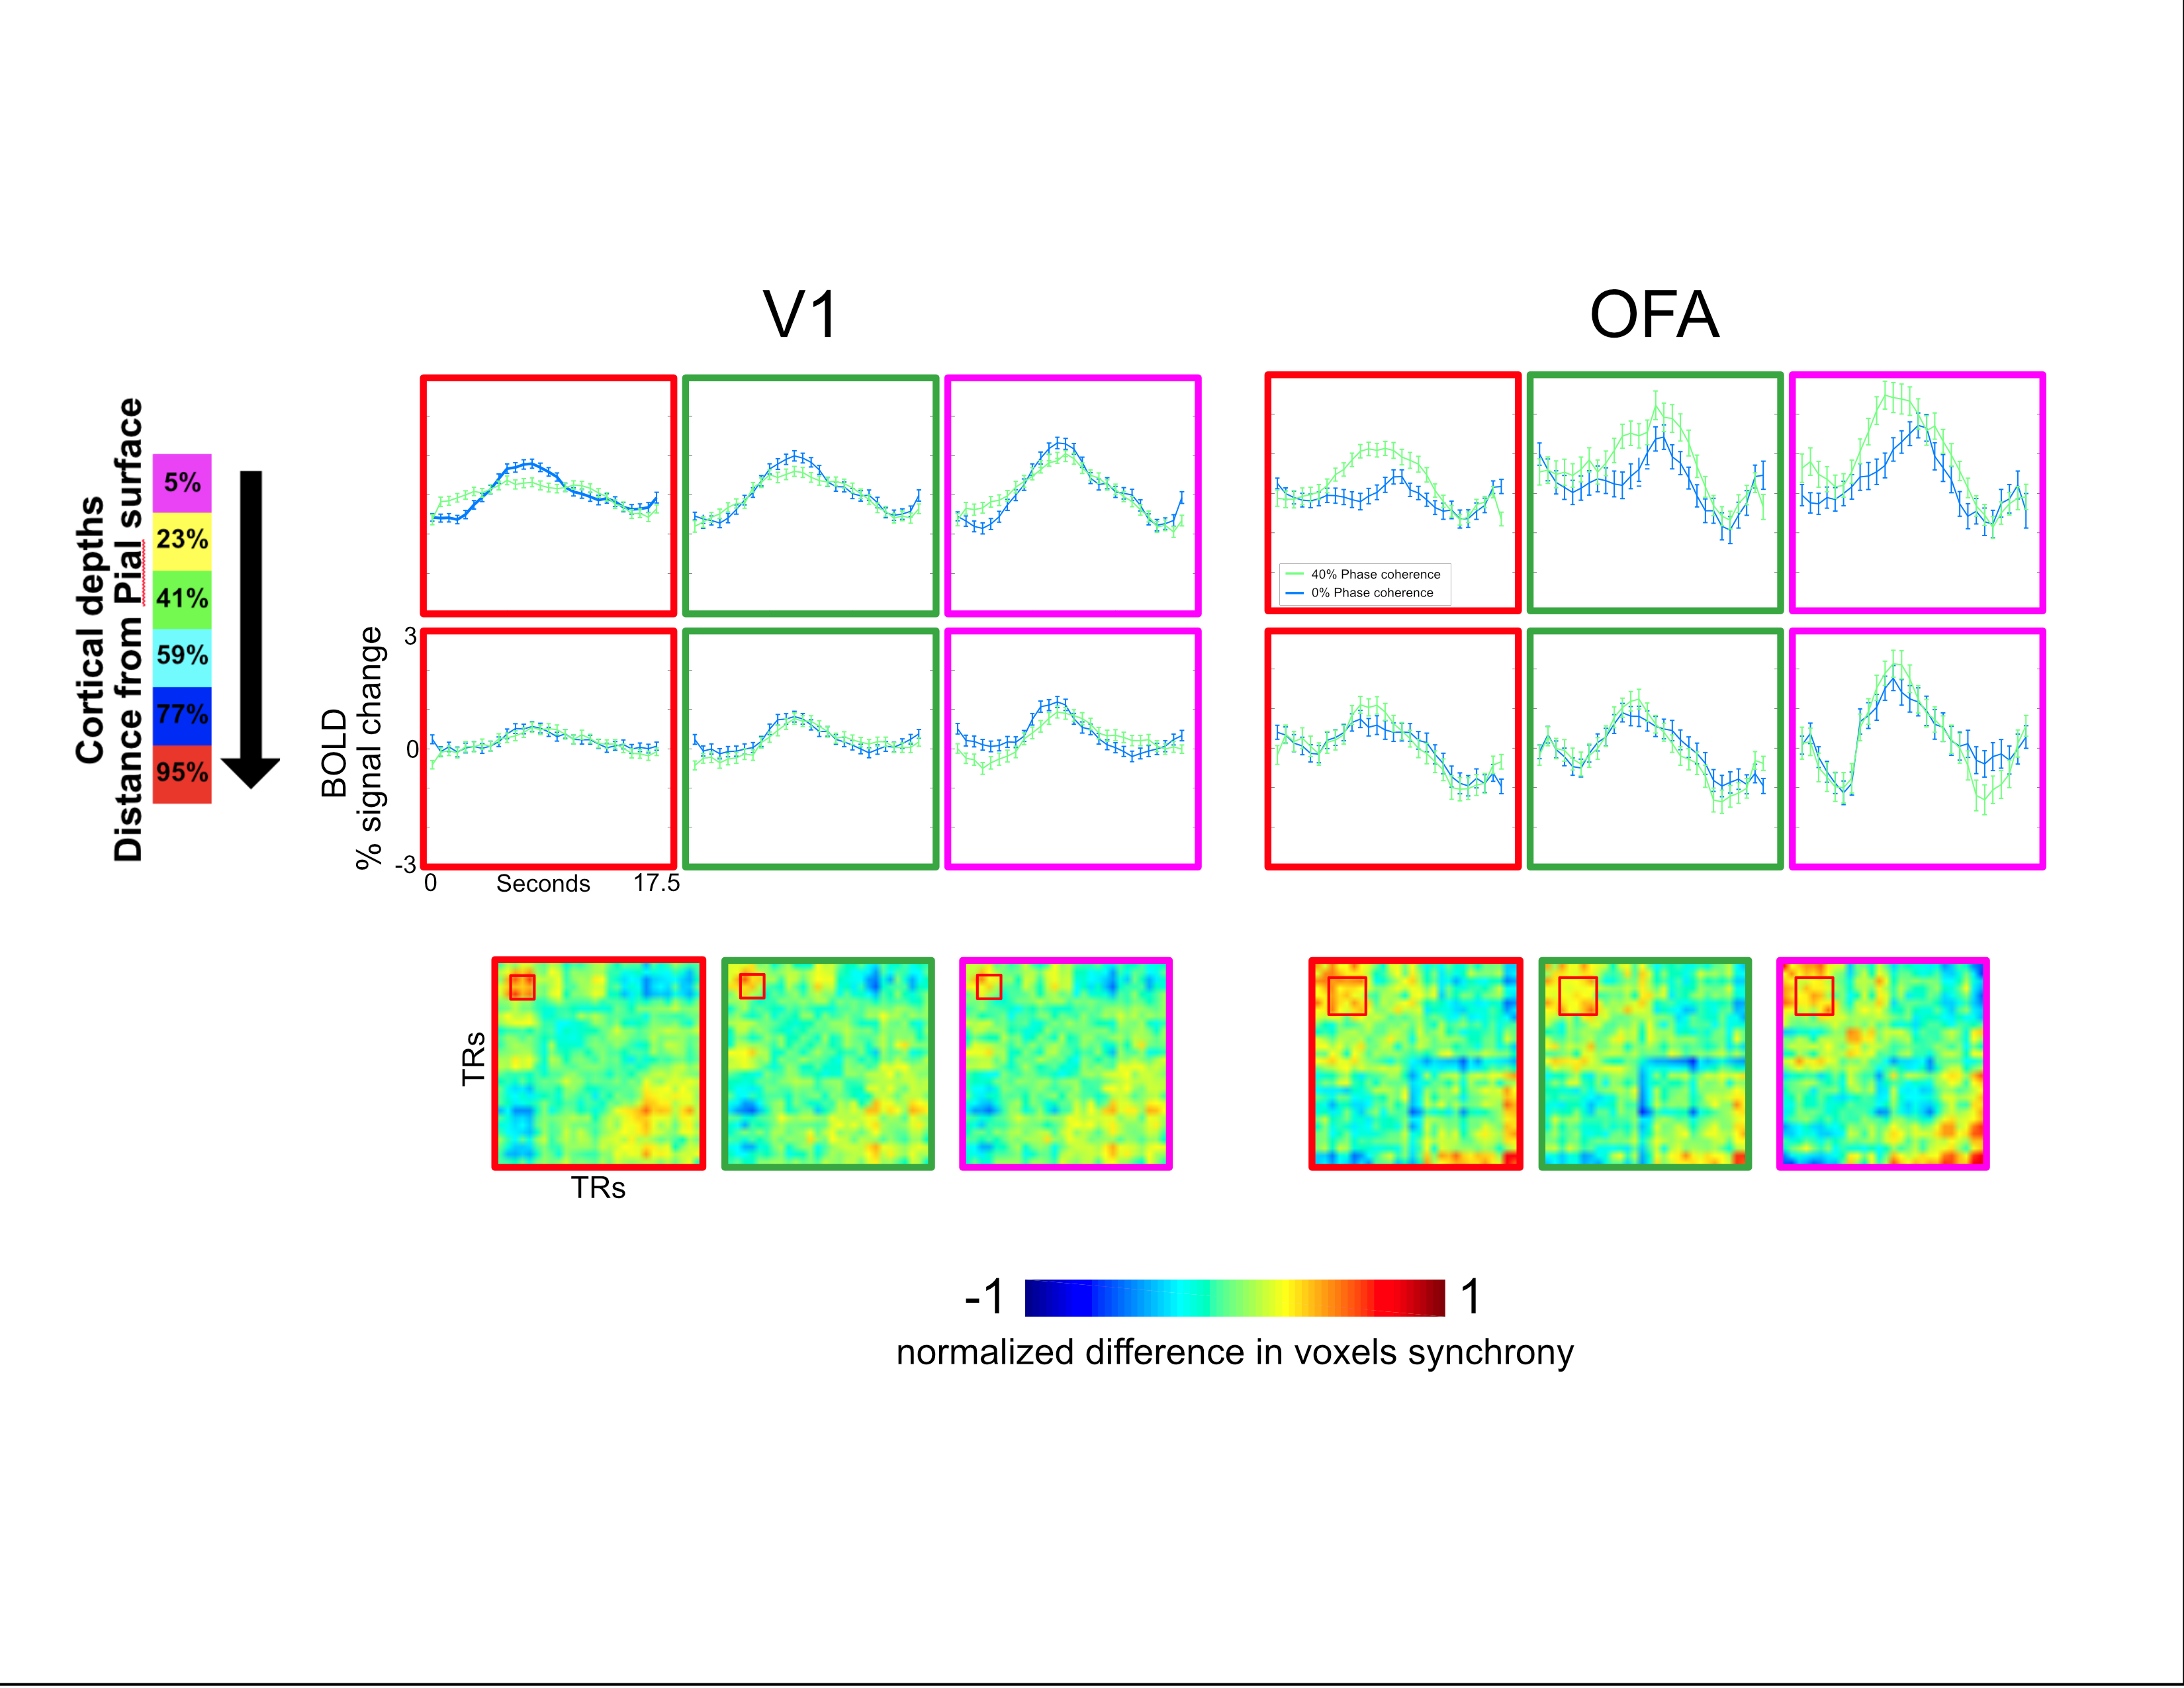
Functional images were acquired using GE-EPI (isotropic 0.85 mm3, TE = 24ms, flip angle =41°, 26 slices, TR= 625 ms, IPAT = 3, partial Fourier = 6/8, MB = 2) on a 7 Tesla scanner with a 4 Tx. 32 Rx. custom built coil. B1 and B0 optimizations (for visual cortex) were done via localized B1 and B0 shimming, while shorter echo spacings were achieved via improved gradient performance with coronal acquisitions. Stimuli and task: We used face stimuli and modulated the phase-coherence of the images to create 5 visual conditions, ranging from 0% (i.e. pink noise) to 40% in steps of 10%. Stimuli were presented for 2 seconds followed by a 2 second fixation period, with 10 % blank trials. A fixation cross (subtending approximately 1 degree of visual angle), changing color every 250 ms was held constant in the middle of the screen. Participants performed either a face detection or fixation color task. The face detection task directed attention towards the face stimuli (i.e. stimulus-relevant task), while the fixation task away from the faces (i.e. stimulus-irrelevant task). Tasks were blocked by runs and stimuli were identical across tasks. Analysis: After manually segmenting the cortex, we parcellated the cortical sheet into 6 depths, ranging from 5% to 95% distance from the pial surface. Using an independent face localizer and retinotopic mapping, we identified the occipital face area (OFA) and V1. All analyses were confined within these ROIs. Independently per cortical depth, we implemented standard univariate FIR analysis and single trial temporal MVPA (tMVPA – measuring the synchrony of multi-voxel patterns across all time points (5)) to test latency and amplitude differences across conditions and tasks.Results
Not surprisingly, attentional demands significantly (p<.05 FDR corrected) impacted BOLD amplitude, leading to larger responses during the stimulus-relevant task compared to the stimulus-irrelevant task. For both tasks, we observed significantly (p<.05 FDR corrected) larger amplitude for the most face-like (i.e. 40% phase-coherence) compared to the no-face (i.e. 0% phase-coherence) condition at the peak of the HRF (~ 6 seconds after stimulus onset) in all ROIs and cortical depths. Task-induced BOLD differences began as early as ~1 s after stimulus onset. Importantly, these data allowed investigating the response profile of cortical depths with unprecedented spatio-temporal precision in cortical regions beyond the classically studied V1 (for example, the OFA). Our results indicate that task induced modulations vary in extent across depths and regions, being generally less prominent in the mid-depths.Conclusion
The data presented here could have profound implications for fMRI as we demonstrate the feasibility of recording BOLD images with concurrent sub-second temporal sampling and sub-millimeter spatial resolution, while retaining sufficient contrast to noise ratios. The concomitant acquisition of highly precise spatial and temporal BOLD recordings has the potential to disentangle neuronal and venous BOLD contributions. Ultimately, the data could permit tapping into neuro-cognitive processes that have thus far been elusive to fMRI, while also bridging the gap between invasive animal electrophysiology and human neuroscience.Acknowledgements
S10 RR026783 “Multichannel Transmit Frontend for 7 Tesla”WM KECK Foundation
1S10OD017974-01 "High Performance Connectome Upgrade for Human 3T MR Scanner"
References
1. Ogawa, S., Menon, R. S., Tank, D. W., Kim, S. G., Merkle, H., Ellermann, J. M., Ugurbil, K. (1993). Functional brain mapping by blood oxygenation level- dependent contrast magnetic resonance imaging. A comparison of signal characteristics with a biophysical model. Biophysical Journal.
2. Muckli, L., De Martino F., Vizioli, L., Petro. L., S., Smith, F. W., Ugurbil, K., Goebel, R., Yacoub, E. (2015) Contextual feed-back to superficial layers of V1. Current Biology
3. Lewis, L.D., Setsompop, K., Rosen, B.R., Polimeni, J.R. (2016) Fast fMRI can detect oscillatory neural activity in humans. PNAS.
4. Vizioli, L. and Yacoub, E. (2018) Probing temporal information in fast-TR fMRI data during attention modulations. Proc. ISMRM
5. Vizioli, L., Bratch, A., Lao, J., Ugurbil, K., Muckli, L., Yacoub, E. (2018) Temporal Multivariate Pattern Analysis (tMVPA): a single trial approach exploring the temporal dynamics of the BOLD signal. Journal of Neuroscience Methods
Figures