0615
Robust detection of layer-specific activities in the human LGN1State Key Lab of Brain and Cognitive Science,Institute of Biophysics,Chinese Academy of Sciences, Beijing, China, 2Siemens Shenzhen Magnetic Resonance Ltd, Shenzhen, China, 3Stevens Neuroimaging and Informatics Institute, University of Southern California, Los Angeles, CA, United States, 4Department of Neurology, University of California Los Angeles, Los Angeles, CA, United States
Synopsis
The lateral geniculate nucleus (LGN) of the thalamus is the main relay station of retinal input to the visual cortex. It plays important roles in perception and cognition, and has close relationships with several eye and brain diseases. The current study showed that high resolution BOLD fMRI at 7T can reliably distinguish eye layers as well as magnocellular and parvocellular layer activities of the human LGN.
Introduction
The lateral geniculate nucleus (LGN) is the thalamic station in the retinocortical projection and plays important roles in visual perception and cognition. Primate LGNs consist of six main layers of neurons with distinct functions and cell types. Layer 1, 4 and 6 receive input from the contralateral eye, while layer 2, 3 and 5 receive input from the ipsilateral eye. The dorsal four layers (layer 3-6) contain small cells are parvocellular (P) layers, have sustained discharge patterns and are sensitive to color; neurons the ventral two layers (layer 1 and 2) have large cell body (magnocellular, M), which are characterized by transient neural responses, high sensitivity to luminance contrast and motion. The ability to resolve layer-specific activities of the human LGN non-invasively has important neuroscience and clinical implications[1-4]. Here we tested whether 7T BOLD fMRI at about 1mm resolution could distinguish ocular as well as magno- and parvocellular layer-specific activities of the human LGN.Methods
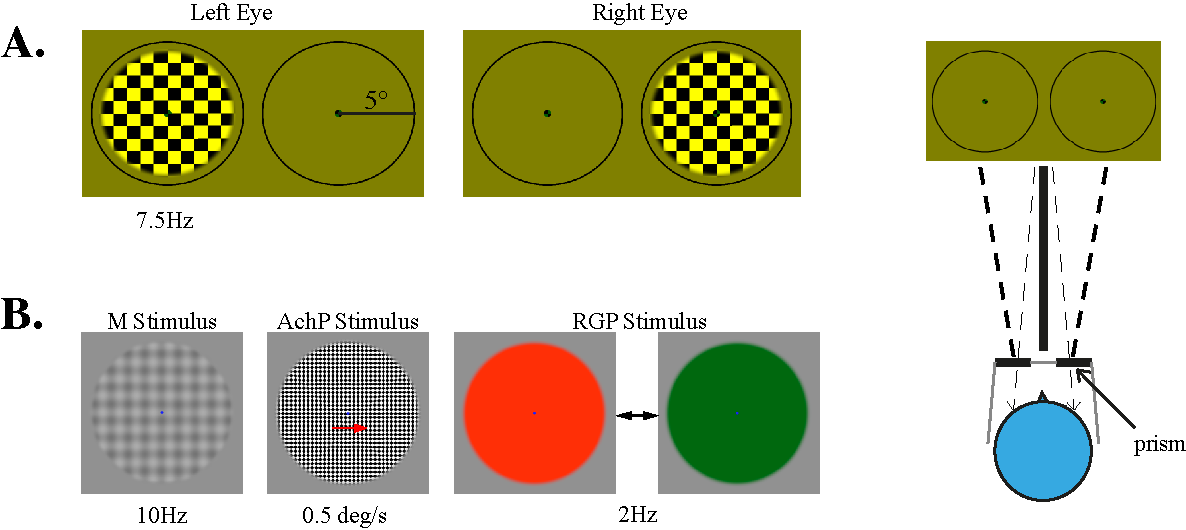
Figure 1 shows the stimuli for the experiments. Full contrast checkerboard stimulus was presented to the left and right eyes in alternation for 16 seconds to selectively activate the eye layers of the LGN. Prisms and splitter were used for dichoptic presentation. The M stimulus was a low contrast (30%), low spatial frequency sinewave checkerboard pattern (2 degrees of check size), counterphase flickering at 10Hz. The achromatic P stimulus was full contrast, high spatial frequency square wave checkerboard (0.5 degree of check size) slowly drifting at 0.5 degrees/s. The chromatic (red/green) P stimulus was fully saturated uniform red and green discs alternating at 2Hz. The diameter for all stimuli were about 8-10 degrees. The M and P stimuli were presented for 24 seconds, in alternation with 12-second fixation period.MRI data were collected with a 7T scanner (Siemens Magnetom) using a 32-channel receive single channel transmit head coil (NOVA medical). Subjects used bite bars to restrict head motion. Four subjects (two females) participated. Functional data for the eye localizer were collected with a T2*-weighted 2d GE-EPIsequence (1.2 mm isotropic voxels with 34 slices, TE =25ms, TR=2s, FOV=180*180 mm, iPAT=2) and a T2-weighted 3d passband balanced-SSFP sequence (1.0mm isotropic voxels with 10 axial slices, 20% oversampling on both sides of z direction, TE=2.67ms, TR=5.34ms, volume acquisition time = 4 s, FOV=144*144 mm, iPAT=2, FA = 20 deg). Each subject scanned 4-8 runs for the eye localizer of GE-EPI and bssfp sequences, each run last about 5 min. Functional data for the MP localizer were collected with GE-EPI sequence only. Four runs of data were collected for the M stimulus and 2 runs of data for each of the AchP and RGP stimulus. T1 and PD weighted anatomical volumes were acquired at 0.7 mm isotropic resolution with MPRAGE sequences.MRI data were analyzed using AFNI and Matlab.Results
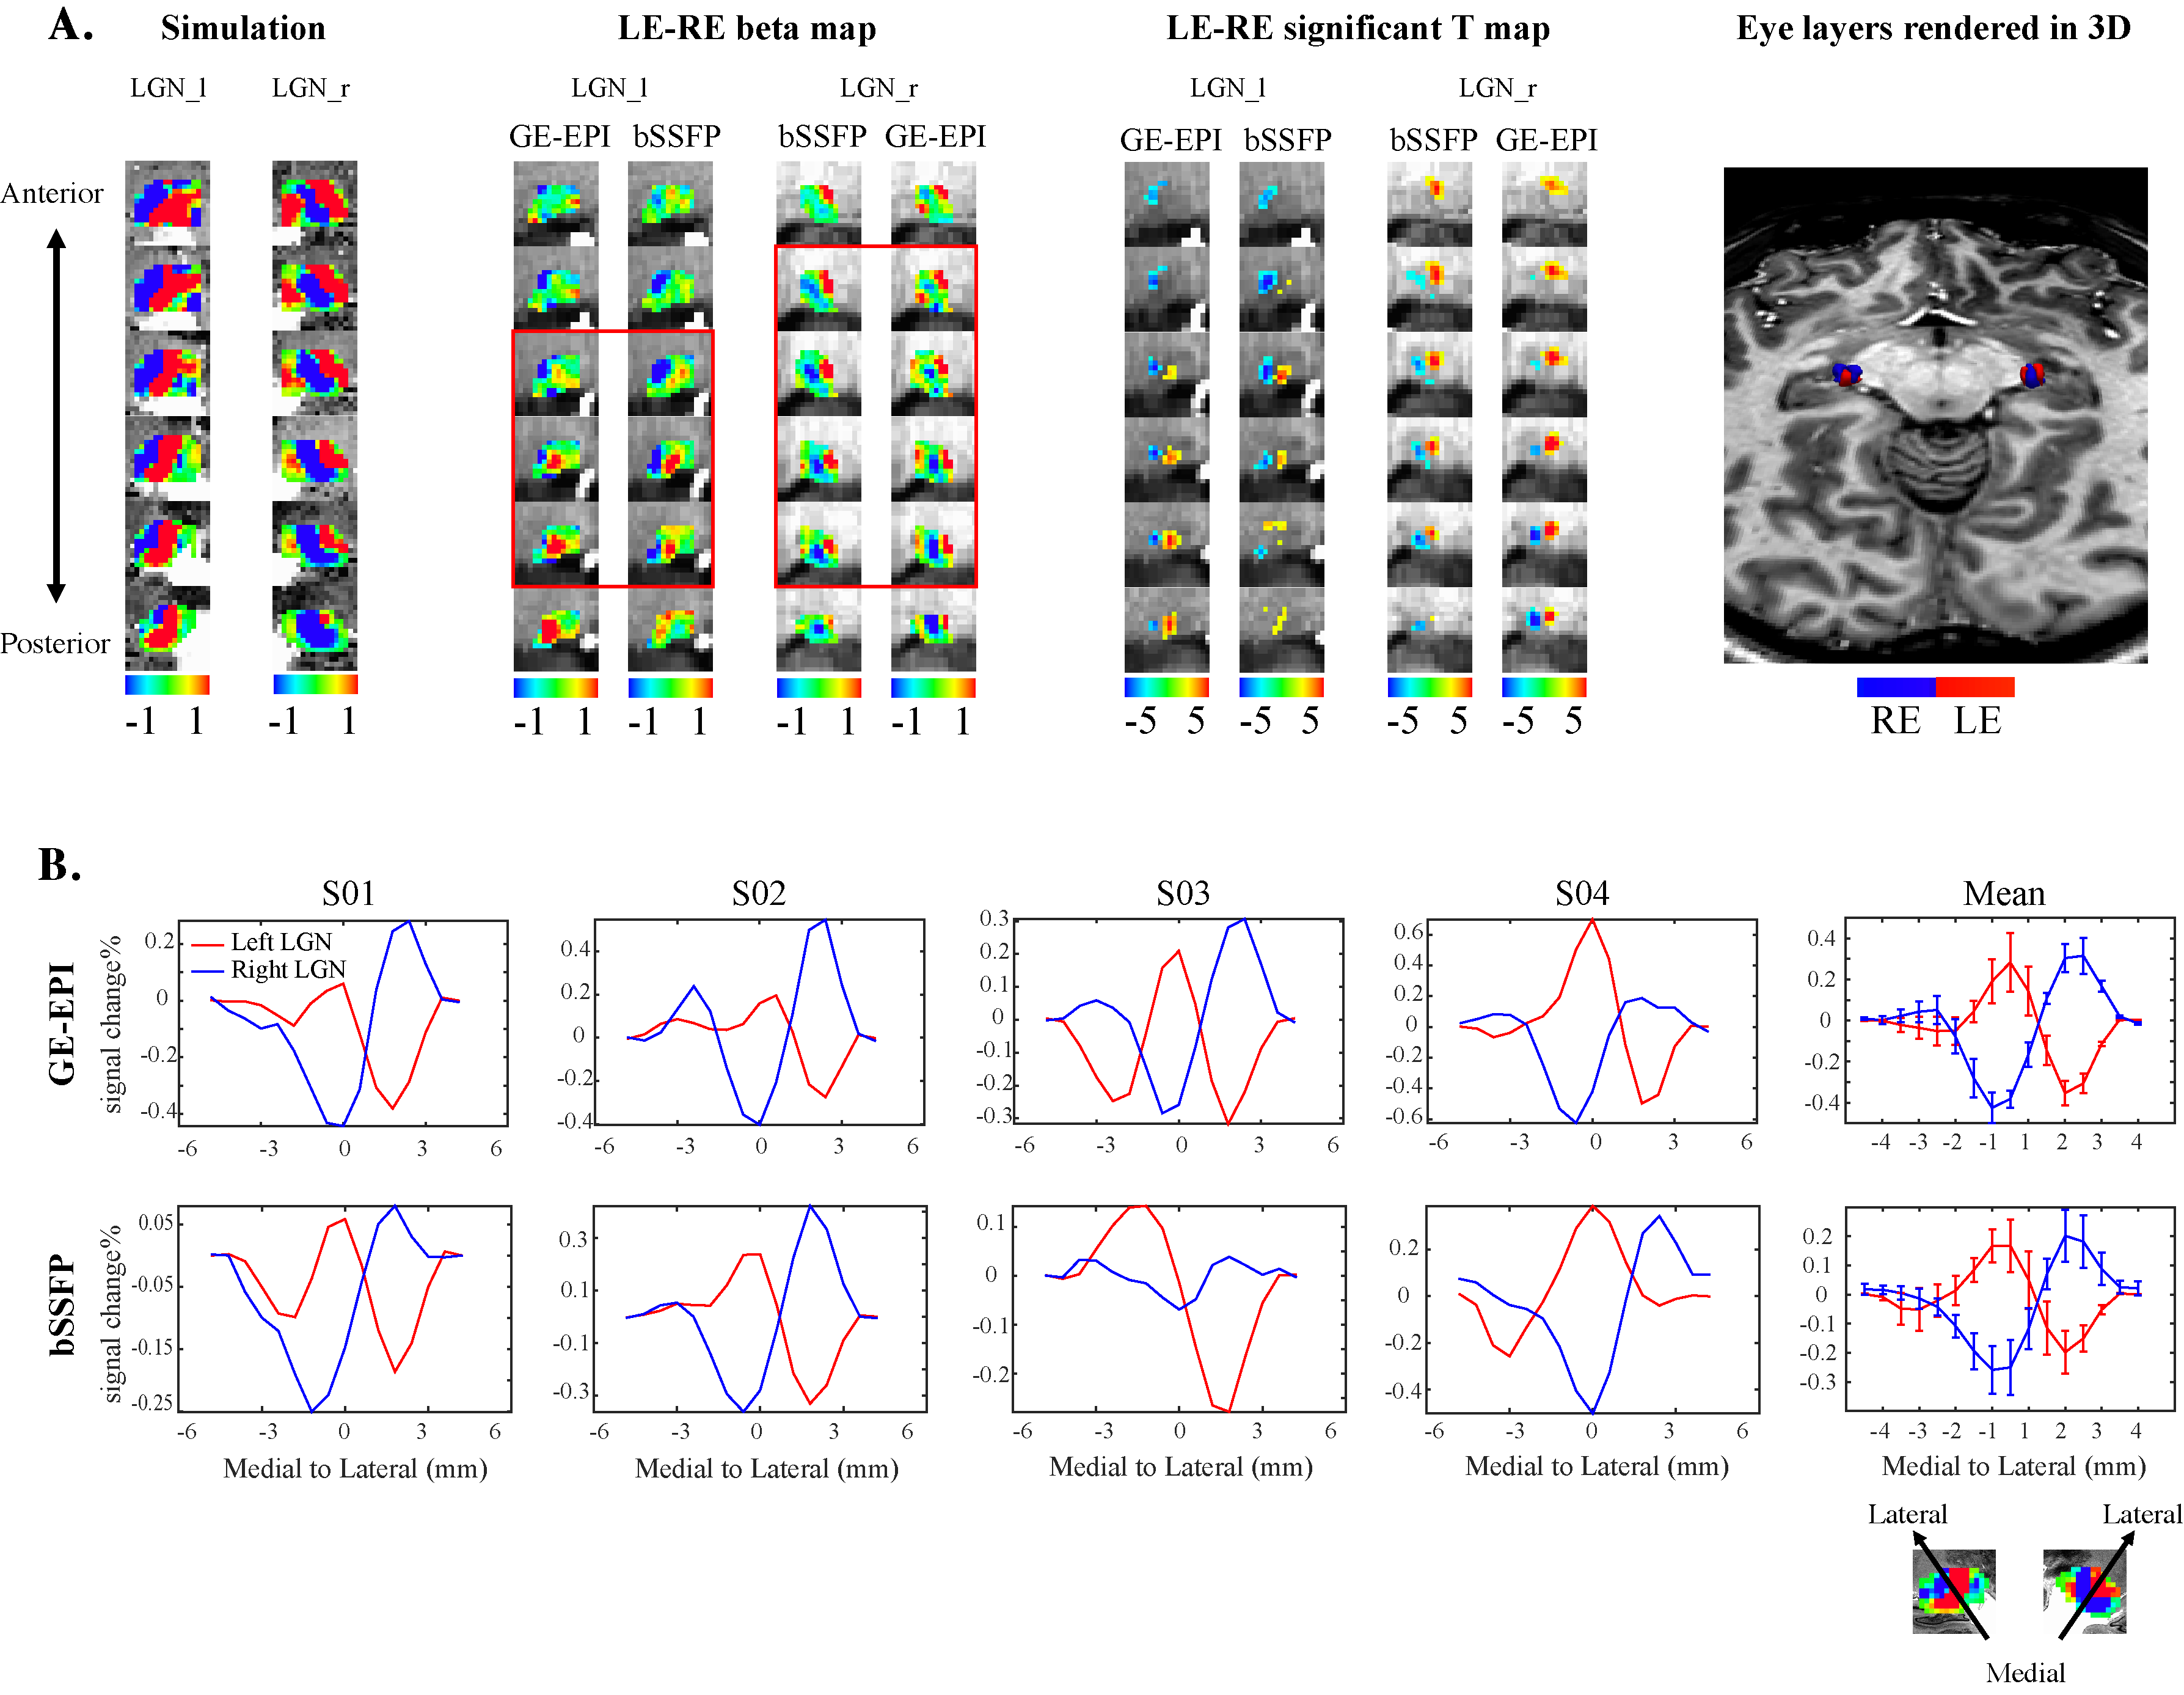
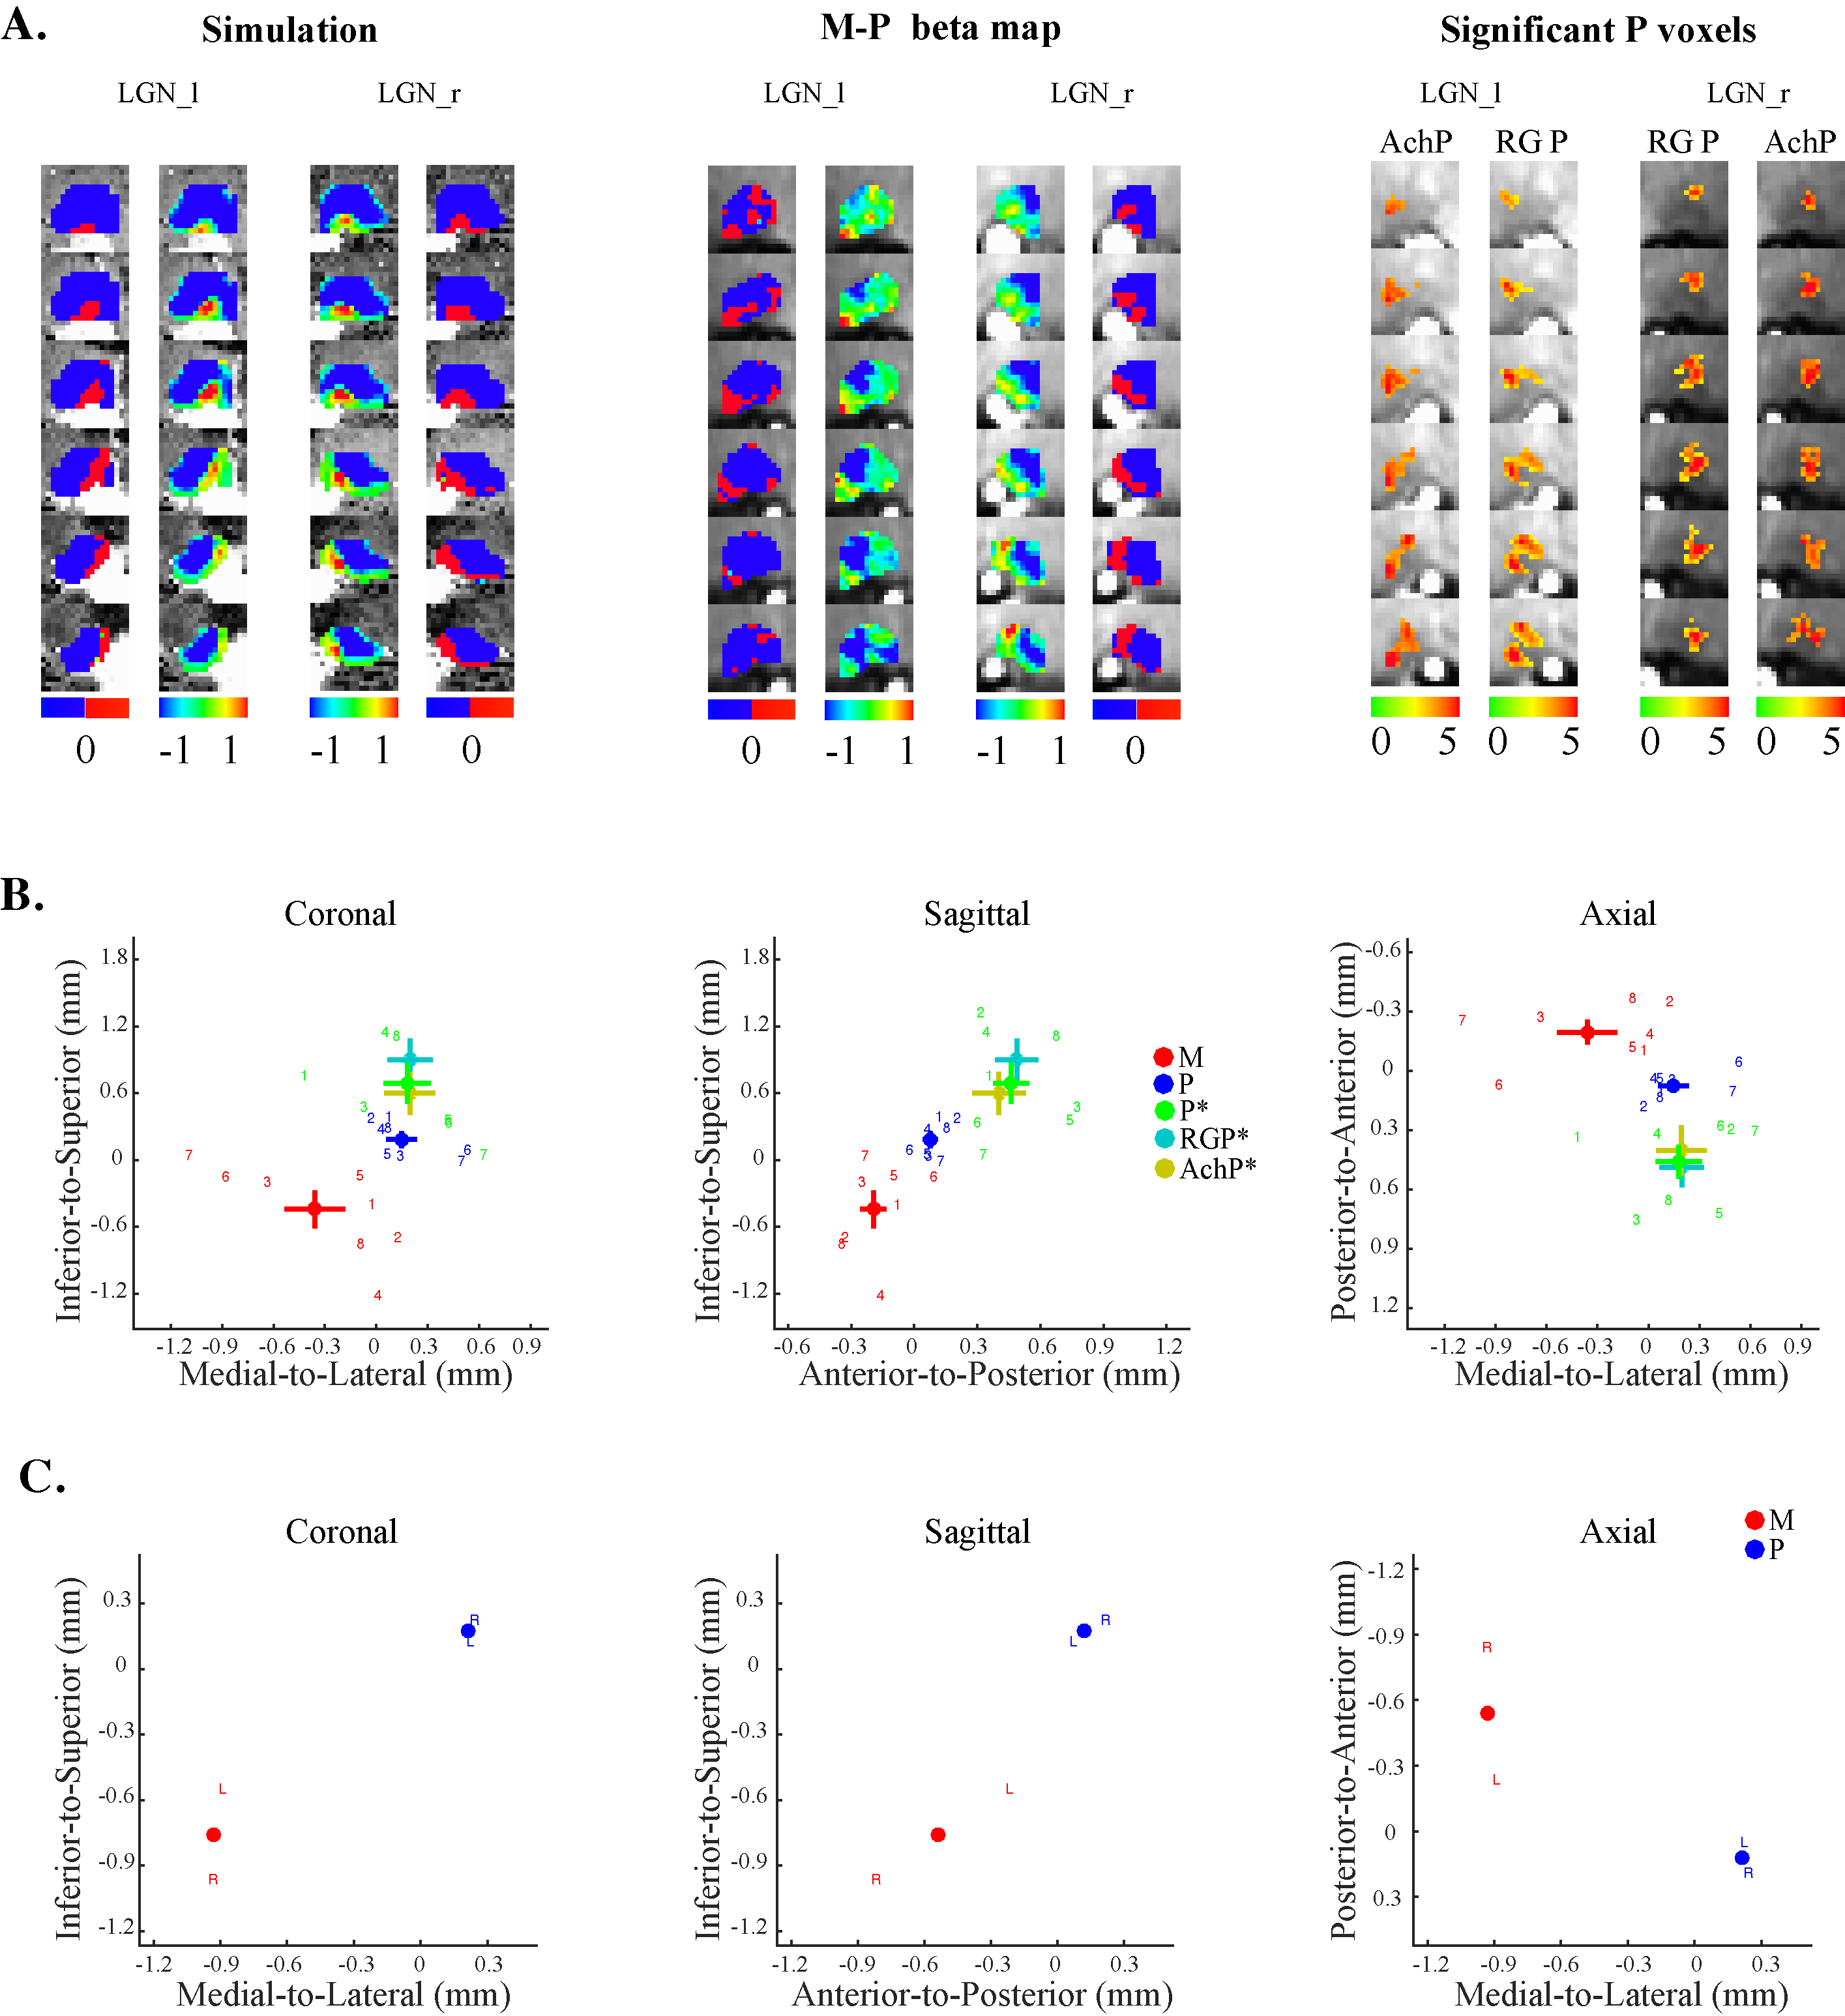
Results showed a highly reliable eye-dominance pattern for each LGN of four subjects, which is a sandwiched organization of three layered sections, arranged in the medial-ventral to dorsal-lateral direction. To validate these findings, we generated simulation patterns from Nissl stained images of the human LGN at 20μm resolution, based on a BOLD point-spread function at 1mm width, and 1.2 mm isotropic fMRI voxel size. Figure 2shows the eye layer pattern from a representative subject and the layer profile from ventral medial to dorsal lateral direction for the LGNs of all subjects. These patterns were highly consistent with the simulation results. Figure 3Ashows the M-P patterns from simulation and those from a representative subject. The center for the M layers were located more ventral, medial and anterior compared to the P layer, for both simulation and our data (Figure 3B, 3C). These laminar patterns were highly consistent between odd and even runs within each scanning session, as well as across sessions from different days.Conclusion
We conclude that BOLD fMRI at 7T is capable to resolve laminar activities in the human LGN, which could be valuable for future applications to investigate its function in human visual perception and cognition, as well as the neural mechanisms for several eye and brain diseases, such as amblyopia, glaucoma, dyslexia, schizophrenia and Parkinson disease.Acknowledgements
This research was supported by grants from Bureau of International Cooperation, Chinese Academy of Sciences (153311KYSB20160030), National Nature Science Foundation of China (31871107), and the Project of State Key Laboratory of Ophthalmology, Optometry and Visual Science,Wenzhou Medical University,Wenzhou 325027.References
1. Yu, Q., et al., Perceptual Learning of Contrast Detection in the Human Lateral Geniculate Nucleus.Curr Biol, 2016. 26(23): p. 3176-3182.
2. Zhang, P., et al., Layer-specific response properties of the human lateral geniculate nucleus and superior colliculus.Neuroimage, 2015. 111: p. 159-66.
3. Zhang, P., et al., Selective reduction of fMRI responses to transient achromatic stimuli in the magnocellular layers of the LGN and the superficial layer of the SC of early glaucoma patients.Hum Brain Mapp, 2015.
4. Denison, R.N., et al., Functional mapping of the magnocellular and parvocellular subdivisions of human LGN.Neuroimage, 2014.102 Pt 2: p. 358-69.
Figures