0611
Concurrent intracellular calcium recordings with laminar fMRI mapping1Graduate Training Centre of Neuroscience, International Max Planck Research School, University of Tuebingen, Tübingen, Germany, 2Magnetic Resonance Department, Max Planck Institute for Biological Cybernetics, Tübingen, Germany, 3MGH/MIT/HMS Athinoula A. Martinos Center for Biomedical Imaging, Department of Radiology, Harvard Medical School, Massachusetts General Hospital, Charlestown, USA., Boston, MA, United States
Synopsis
The ultra-high magnetic field strengths of 14.1T allows visualization of laminar-specific neurovascular coupling events with fMRI in living animals. Combining line-scanning fMRI and intracellular calcium signal recording, we present laminar-specific coupling features at high temporal and spatial resolution along the cortical thickness, showing strong Layer 4 fMRI correlation to the calcium signal and largely varied coupling features from adjacent cortices in the anesthetized rats.
Introduction
The neuronal firing patterns across cortical layers have been extensively studied to better depict the information flow through neural network1. Previous fMRI studies have reported specific functional patterns or laminar-specific hemodynamic features with advanced laminar fMRI methods in human brains2,3. Using a line-scanning fMRI method, we have reported the laminar-specific fMRI onset relevant to the neural inputs during the repetitive stimulation block-design paradigm in rodents3. However, the underlying neural correlation to the laminar-specific fMRI signal has not been specified. Here, we further improved our established multi-modal fMRI platform with concurrent fMRI and intracellular calcium recordings by implementing a multi-slice line-scanning fMRI method with fiber-based calcium recording. This method allows us to assess the intrinsic spatiotemporal correlation features of neural responses with the laminar-specific fMRI signals in vivo, providing the feasibility of deciphering the altered patterns of fMRI signal across different cortical layers.
Methods
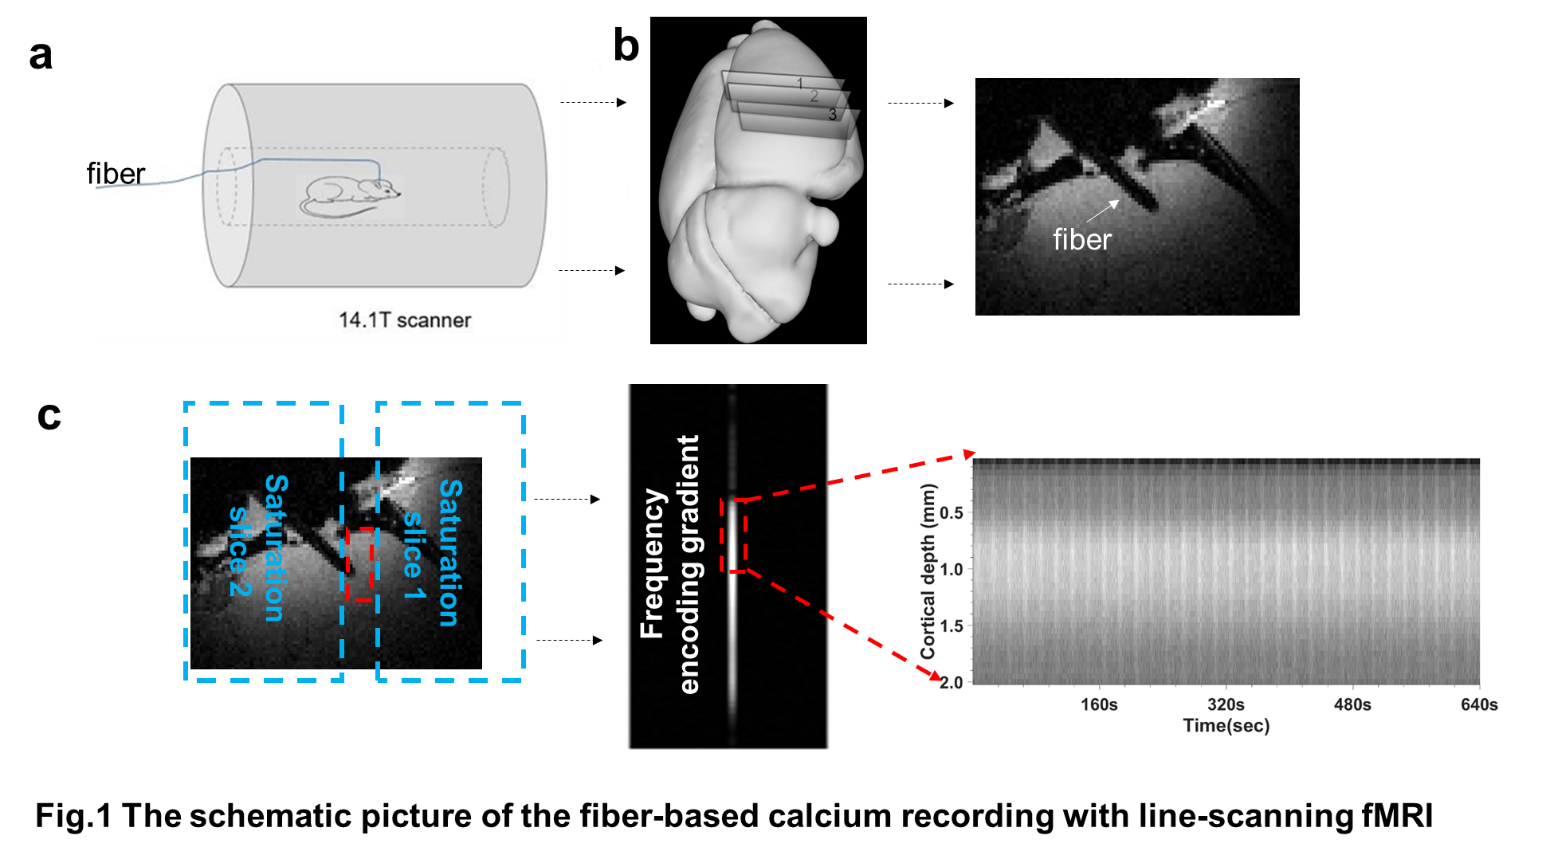
Under alpha-chloralose anesthesia, fMRI experiments were carried out on a 14.1 T/26 cm horizontal bore magnet (Magnex) interfaced to an Avance III console (Bruker). A transceiver surface coil (6mm diameter) was used to acquire images. Animal preparations and detailed surgical procedures were described previously4. Three-week old male Sprague-Dawley rats received stereotactic microinjection of AAV5.Syn.GCaMP6f viral vectors into the forepaw region of the primary somatosensory cortex (S1FL). Fiber optic (200µm) was inserted into the S1FL area for calcium signal recordings after 3-4 weeks of virus injection. Electrodes were placed on the forepaw to deliver trains of 300µs, at 3Hz during 4s in each epoch. fMRI data were acquired using the multi-slice line-scanning method: TR=100ms, TE=12.5ms, temporal (50ms) and spatial (50µm) resolution, number of repetitions=200, total scan time=640s, slice thickness 1.2 mm, inter distance between slices 2.0 mm, and the cortical space between two saturation slices was 1.2 mm. All data processing was performed using Analysis of Functional NeuroImages (AFNI) software (Cox, 1996) and MATLAB.Results
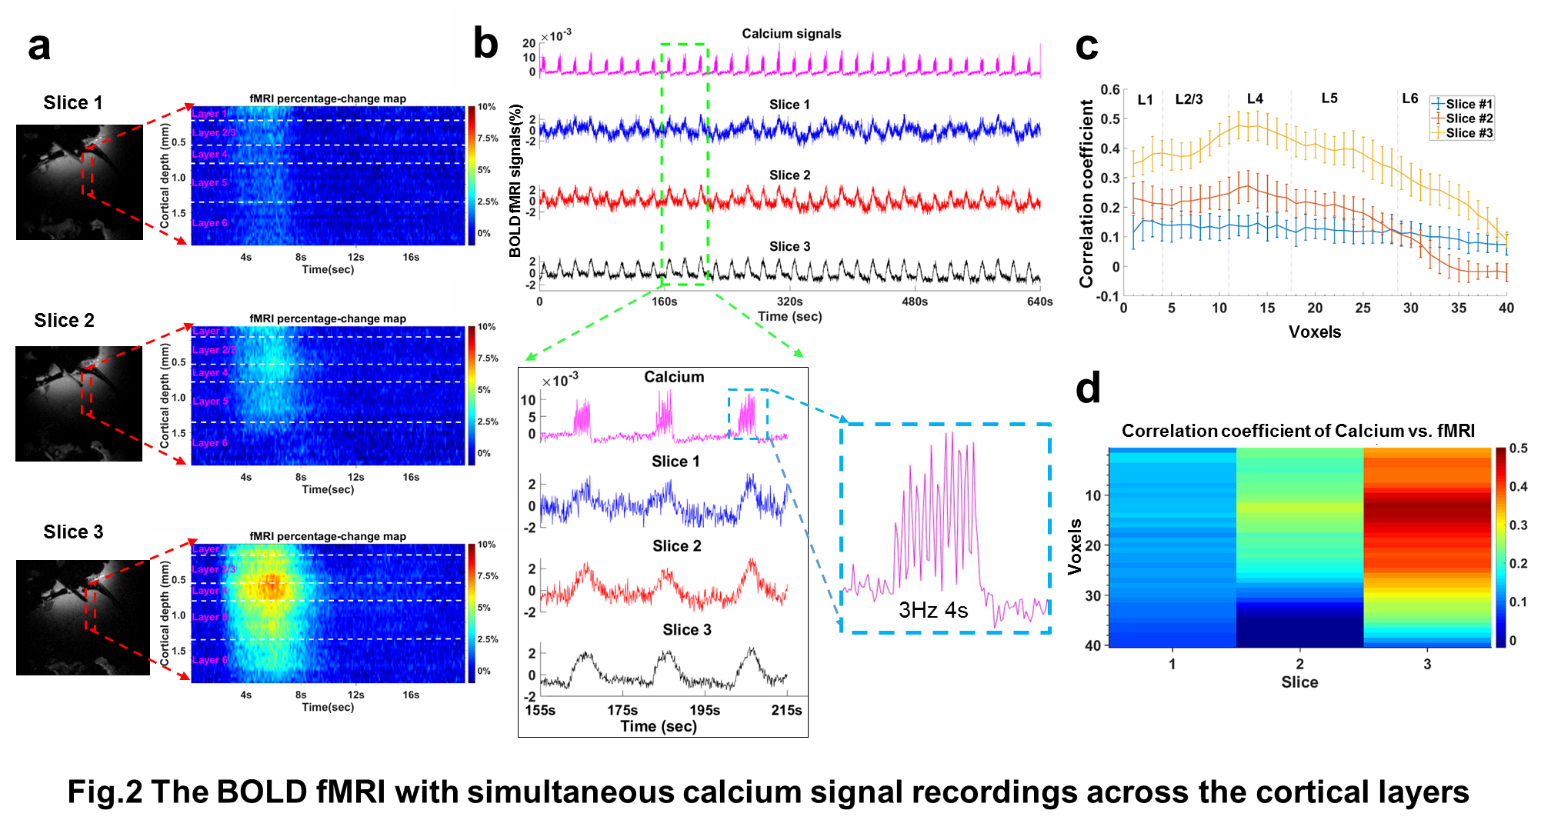
Fig.1 depicts the schematic multi-modal fMRI planform for concurrent calcium recordings with laminar fMRI. The optical fiber is inserted to target the deep layer of the forepaw S1 (FP-S1) cortex expressing the GCaMP6f in the anesthetized rats. Three slices were positioned to cover FP-S1 and the adjacent cortical regions with 1.5mm gap. Using the modified multi-slice FLASH-based line-scanning method, we are able to acquire the laminar profile of the fMRI signal from three different cortices with concurrent neuronal calcium signal. Fig.2a shows laminar-specific fMRI percentage change map as the functional of time of 3 different slices from one representative trial. Fig.2b shows the simultaneously recorded calcium signals and the fMRI time courses acquired from the three slices in the representative trial. By analyzing the power spectrum profile of the calcium signal, we calculated the correlation coefficient of the calcium spike frequency (1-5Hz) power profile and the BOLD fMRI signal, showing the strongest correlation located at Layer 4 of the slice #3 (Fig. 2c, d, averaged from 12 trials). Interestingly, the correlation pattern in the other two slices present unique laminar-specific features, e.g., the deep layer of slice #2 shows reduced correlation pattern. This result indicates a highly varied laminar-specific neurovascular coupling features across the cortical layers and regions.Conclusion
We established a line-scanning based multi-modal fMRI platform to study the laminar-specific neurovascular coupling with concurrent fiber-based calcium recording and fMRI across multiple brain regions. The calcium-event based regression analysis demonstrates specific correlation patterns across different cortices. This work provides a feasible platform to further study the varied neurovascular coupling events across the whole hemispheres with multiple fiber probes at different brain states.Acknowledgements
This work was supported by the Max-Planck-Society.References
1.Dumoulin, S. O. Layers of Neuroscience. Neuron 96, 1205-1206, doi:10.1016/j.neuron.2017.12.004 (2017).
2 . Huber, L. et al. High-Resolution CBV-fMRI Allows Mapping of Laminar Activity and Connectivity of Cortical Input and Output in Human M1. Neuron 96, 1253-1263 e1257, doi:10.1016/j.neuron.2017.11.005 (2017).
3. Yu, X., Qian, C., Chen, D. Y., Dodd, S. J. & Koretsky, A. P. Deciphering laminar-specific neural inputs with line-scanning fMRI. Nat Methods 11, 55-58, doi:10.1038/nmeth.2730 (2014).
4. Yu, X. et al. 3D mapping of somatotopic reorganization with small animal functional MRI. Neuroimage 49, 1667-1676, doi:10.1016/j.neuroimage.2009.09.021 (2010).
Figures