0609
Laminar CBF and BOLD fMRI in the human visual cortex using arterial spin labelling at 7T1Cognitive Neuroscience, Maastricht University, Maastricht, Netherlands, 2Center for Neuroscience Imaging Research, Institute for Basic Science (IBS), Department of Biomedical Engineering, Sungkyunkwan University, Suwon, Korea, Republic of
Synopsis
Laminar fMRI at ultra-high field is typically carried out using the BOLD contrast. Despite its unrivalled sensitivity, the BOLD contrast is limited in its spatial specificity (e.g. due to intracortical ascending and pial veins). Alternatively, the regional change in cerebral blood flow (CBF), is a quantitative measure directly related to neuronal activation. However, CBF fMRI with high spatial resolution is challenging due to the relatively lower SNR. Building on previous work, we demonstrate for the first time, sub-millimetre spatial resolution simultaneous CBF and BOLD acquisition using arterial spin labelling (ASL) for laminar fMRI at 7T.
Introduction
Sub-millimetre resolution fMRI studies at ultra-high field that investigate laminar circuitry in humans are typically performed using the BOLD contrast [1]. However, the BOLD signal is inherently limited in its spatial specificity (e.g. due to intracortical ascending and pial veins) [2]. In contrast, changes in cerebral blood flow (CBF) are spatially and quantitatively correlated to neuronal activity [3, 4] and can be non-invasively measured using arterial spin labelling (ASL) [5]. However, ASL-based CBF mapping is challenging because of its lower SNR and difficulty achieving high spatial resolutions, and consequently, limiting its application for laminar fMRI [6]. We have previously shown that sub-millimetre whole-brain ASL in humans at 7T is feasible albeit only measuring baseline CBF [7]. In this study, we take advantage of the higher image SNR at 7T and build on our previous ASL work to simultaneously acquire sub-millimetre laminar CBF and BOLD fMRI in the human visual cortex.Methods
Six subjects participated in the experiment after giving informed consent and data was acquired on a whole‐body 7T scanner (Siemens Healthineers, Germany) using a 32‐channel coil (Nova Medical, USA). To increase the labelling efficiency at 7T, two 18x18x0.5 cm3 high-permittivity 'dielectric pads' were placed on either side of the head at the level of the temporal lobes [8]. The functional ASL acquisition parameters were: 0.9 mm isotropic resolution, 44 slices, GRAPPA 4, TE/TR = 15/2850 ms, α=19º, a 3D EPI readout [9] with FAIR QUIPSS II scheme, TI1/TI2 = 700/1891 ms, 1124 Hz/px bandwidth and echo-spacing 1.02 ms. Four functional runs lasting ~11mins each were acquired with 10 blocks of a radial flickering checkerboard stimulus, presented for 20s followed by 40s rest. A 3D-MP2RAGE [10] was acquired at 0.9 mm isotropic resolution as the T1-w anatomical reference. All data were motion-corrected, distortion-corrected and co-registered to the anatomy with ANTs [11] by concatenating all transforms and resampling the data only once. Statistical analyses were carried out using FSL FEAT. The anatomical data were processed in native space using Freesurfer v6 and laminar analyses were carried out in surface space by sampling the functional timeseries signal at 11 cortical depths using nearest-neighbour interpolation. The ASL timecourses were surround-averaged and surround-subtracted in MATLAB to obtain the BOLD and CBF timecourses, respectively. The absolute change in CBF was computed by normalising the surround-subtracted signal by the mean signal (as a proxy for M0).Results
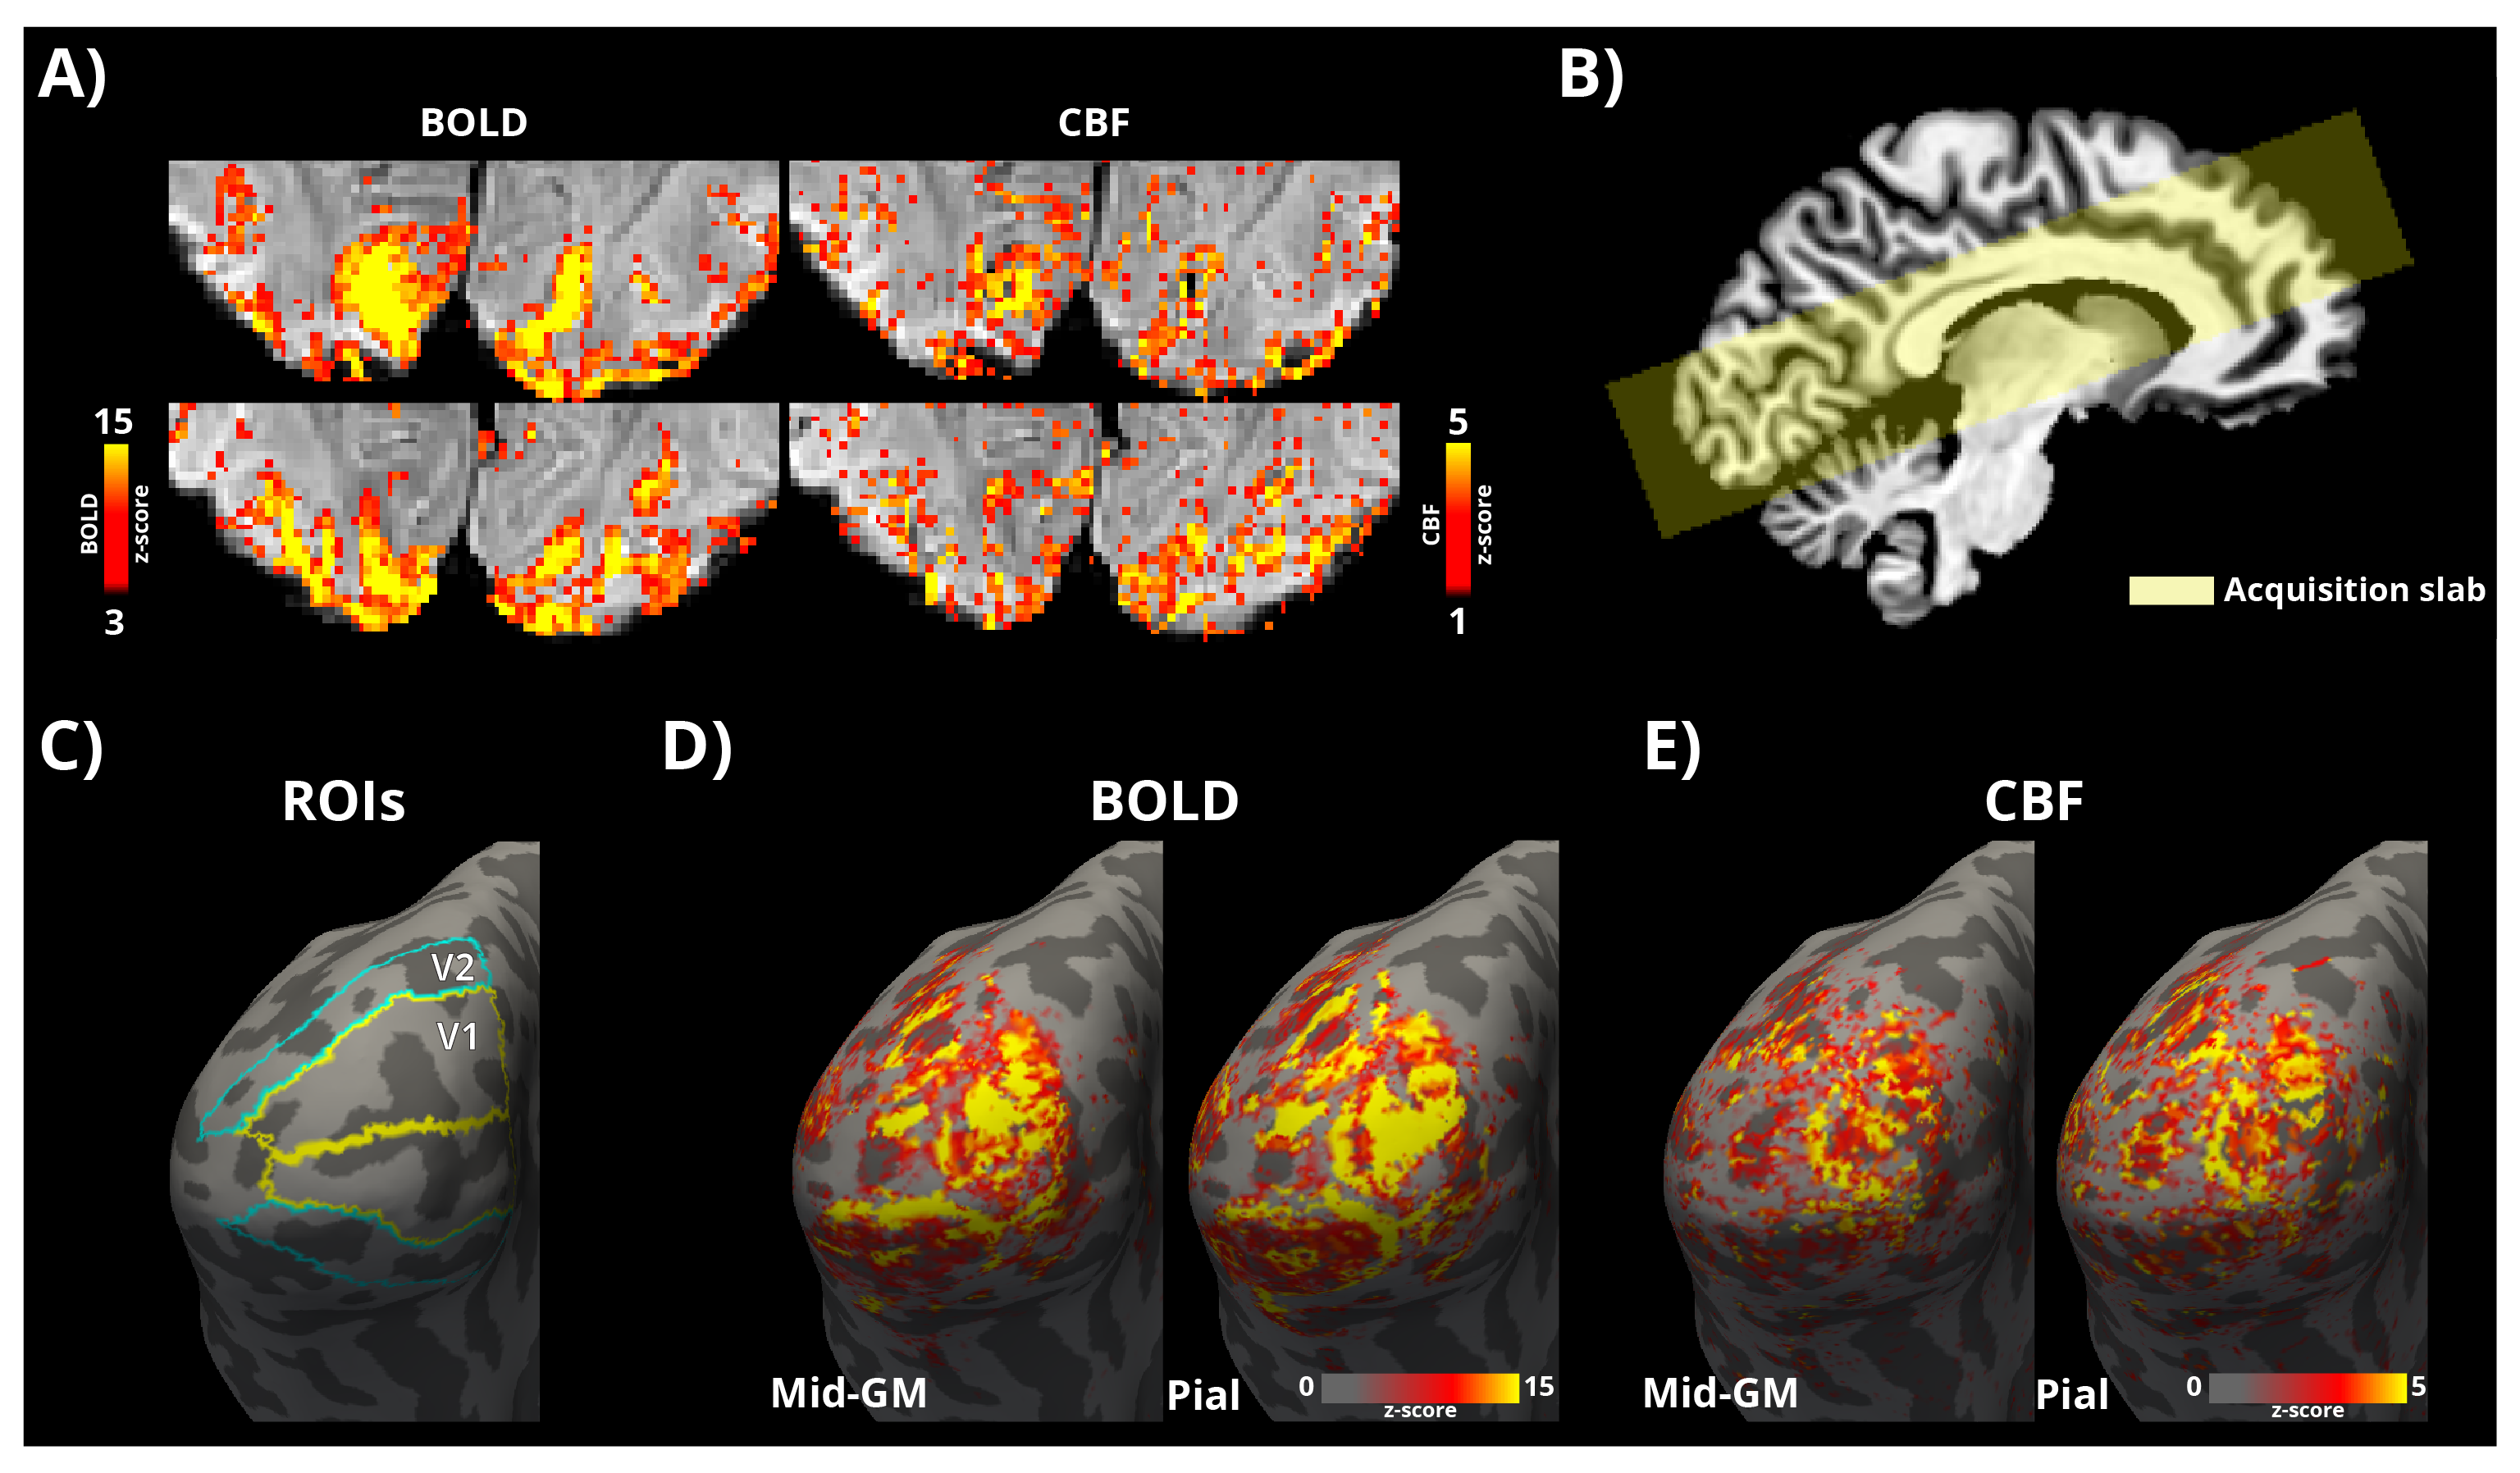
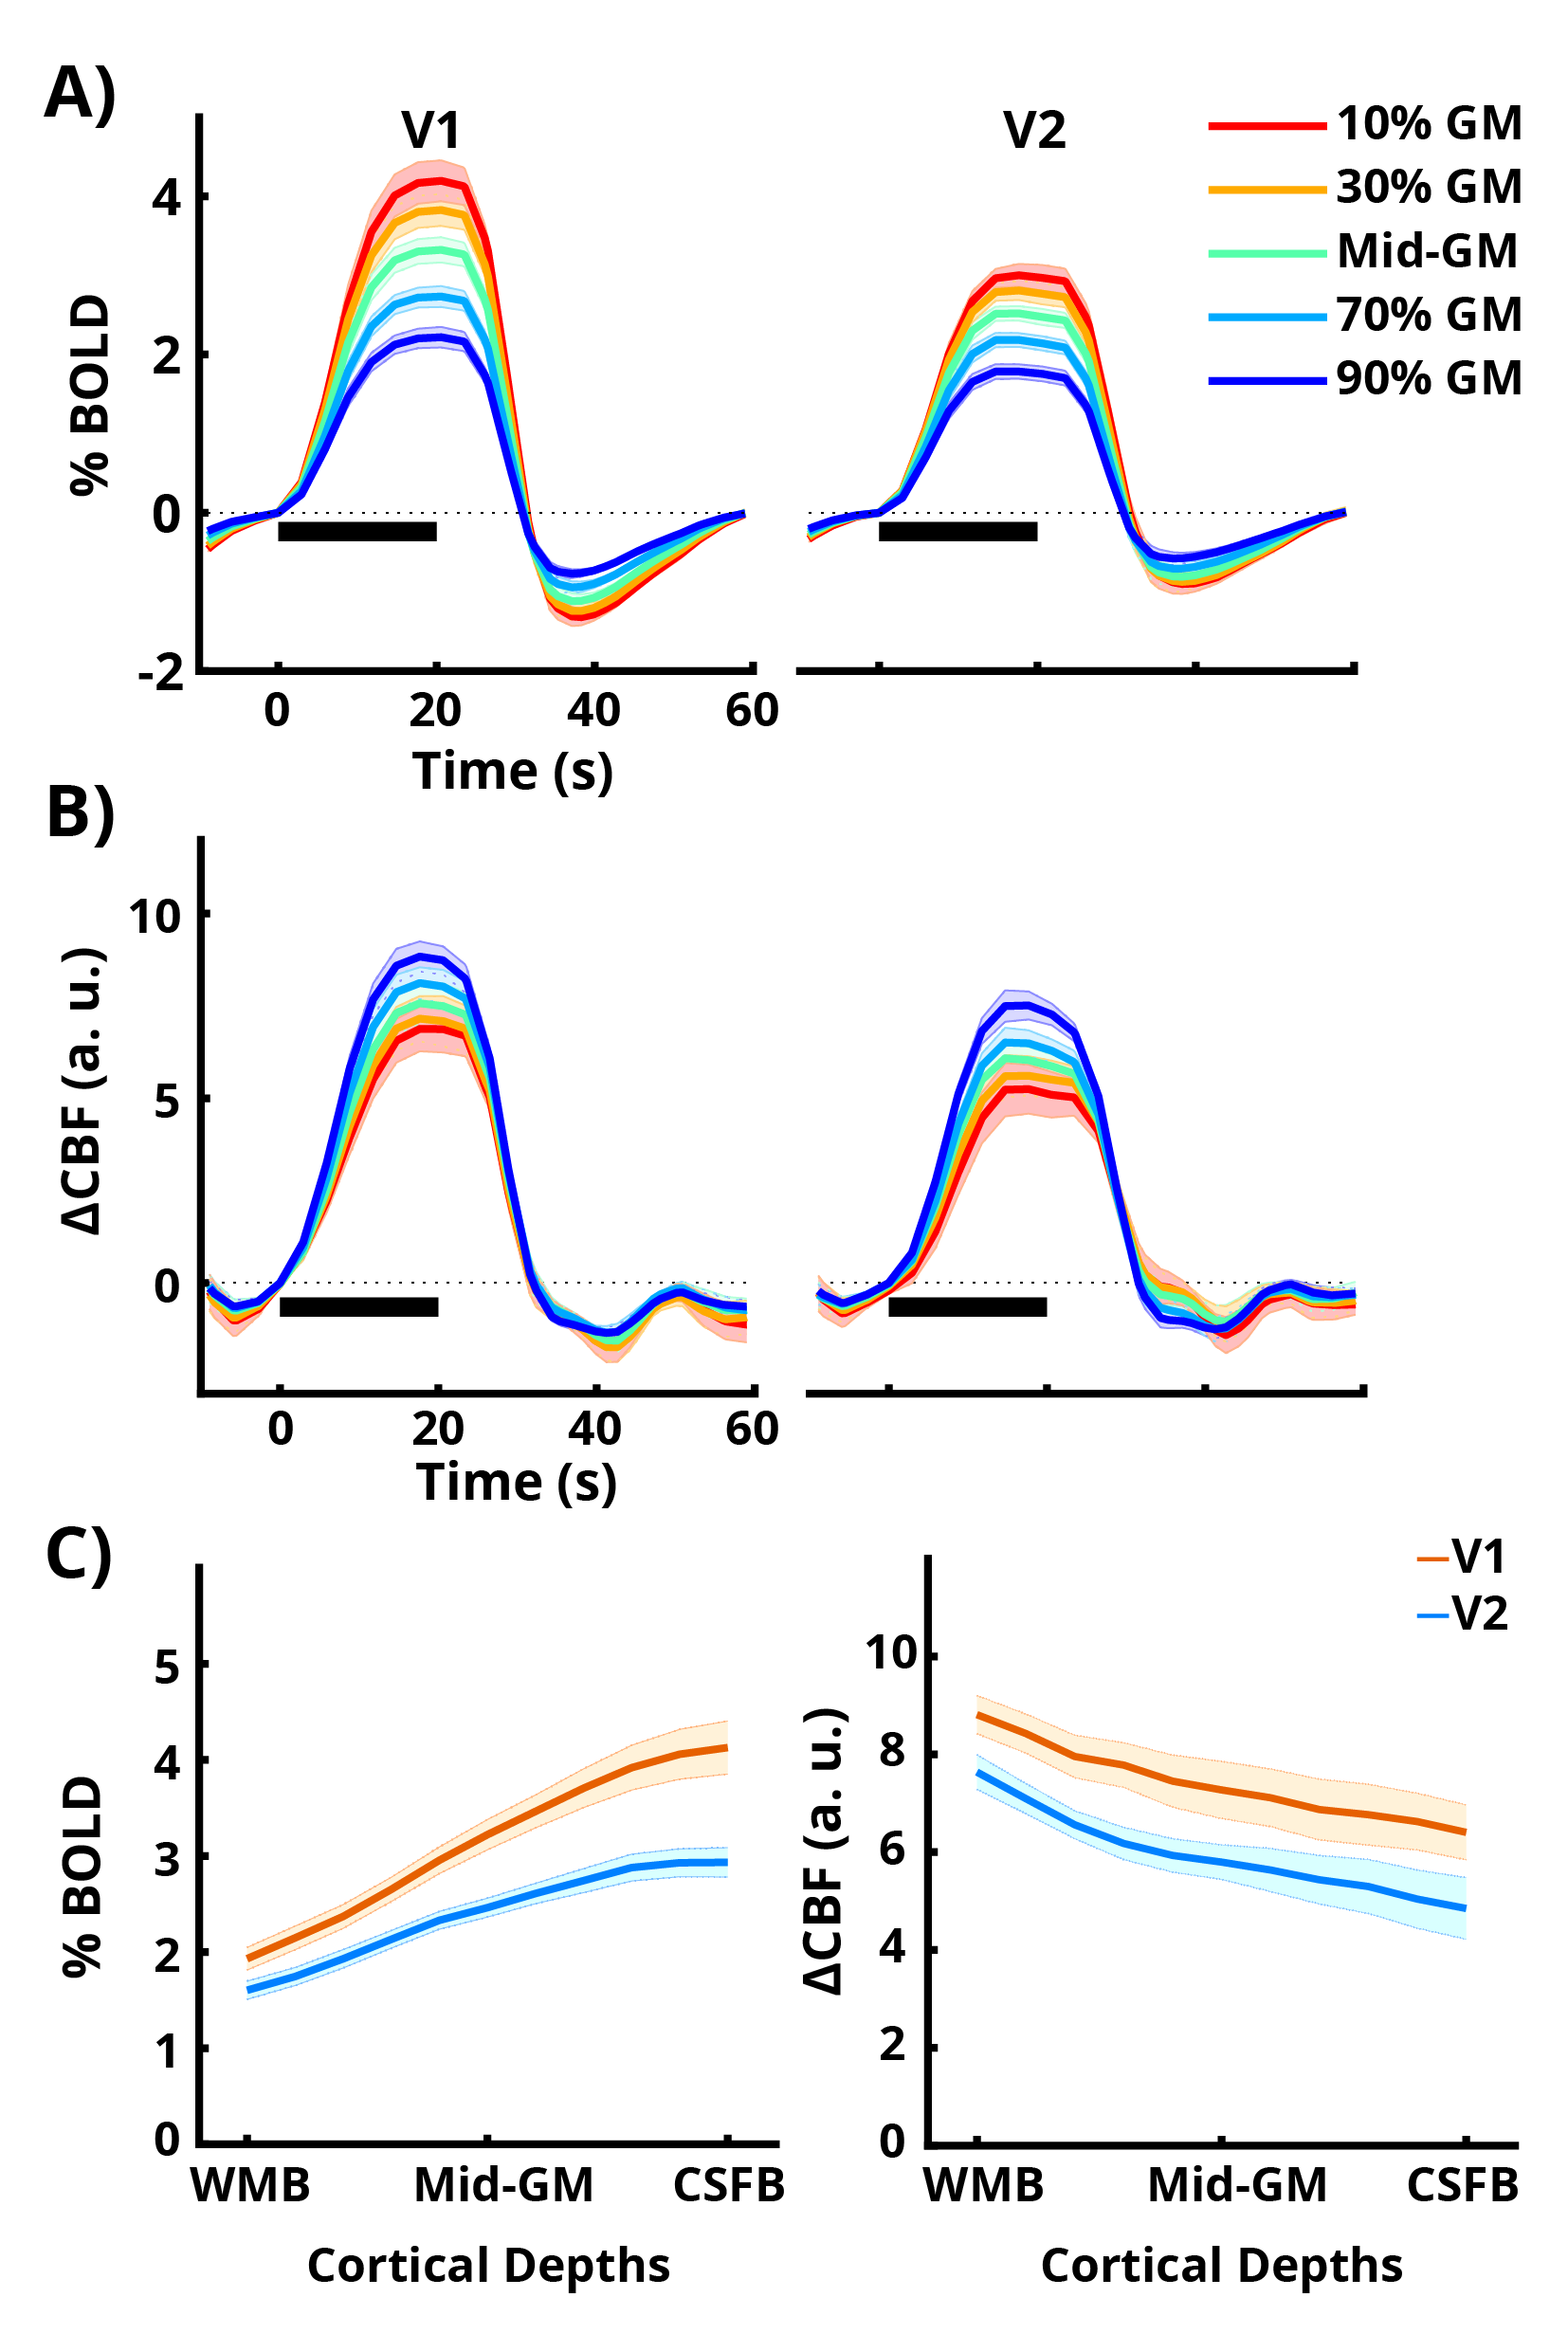
For illustration, single-subject BOLD and CBF statistical activation maps overlaid on axial slices of the mean EPI image are shown in Figure 1A. Figure 1B illustrates the extent of brain coverage obtained in the present study at 0.9 mm isotropic. V1 and V2 were delineated on the inflated cortex (Fig. 1C) in subject space using a retinotopic probabilistic atlas [12]. Example activation maps for BOLD and CBF (Fig. 1D) sampled at 2 out of a total 11 depths are shown on the inflated surfaces. There is an expected increase in the spread of activation for BOLD as previously shown [13] but the CBF maps are relatively similar across depths. Event-related average laminar BOLD (Fig. 2A) and CBF timecourses (Fig. 2B) for 5 out of 11 sampled depths are shown and the corresponding laminar profiles across all depths are plotted in Figure 2C. The event-related average laminar BOLD timecourses obtained from V1 have a higher dynamic range than in V2 (Fig. 2A,C) and exhibit post-stimulus undershoots, which are smaller in CBF. The laminar BOLD timecourses show the typically observed [14-16] increase in signal amplitude towards the pial surface. In contrast, the absolute change in CBF (Fig. 2B,C) exhibits a slight increase towards the deeper layers.Discussion
In this study we demonstrate simultaneously acquired isotropic sub-millimetre resolution CBF and BOLD for laminar fMRI in the human visual cortex. We show that robust single-subject single-session high-resolution activation maps for CBF fMRI (Fig. 1A) can be obtained at 7T with sufficient brain coverage (Fig. 1B). The spatial profile of the BOLD signal cannot be directly related to laminar neuronal responses due to a multitude of signal biases (e.g. due to intracortical ascending and pial veins) and require model-driven spatial deconvolution approaches [17, 18]. On the other hand, the simultaneously acquired CBF signal, being more directly related to neuronal activation, can be used to spatially and quantitatively calibrate the laminar BOLD responses. In summary, we show that simultaneous CBF and BOLD acquisition using ASL is a promising approach for high-resolution laminar fMRI at ultra-high fields that combines the advantages of the high sensitivity of BOLD together with the high spatial specificity and quantifiability of CBF.Acknowledgements
We thank Andrew Webb for providing us the dielectric pads used in this study. We thank Laurentius Huber for the implementation of the tr-FOCI inversion pulse and we acknowledge the contributions of Markus Barth and Josef Pfeuffer on earlier versions of the 3D-EPI ASL sequence code used in this study.References
[1] Dumoulin, S.O., et al., Neuroimage, 2018.
[2] Uludaǧ, K. and P. Blinder, NeuroImage, 2018.
[3] Goense, J., Y. Bohraus, and N.K. Logothetis, Frontiers in Comp Neuro, 2016.
[4] Jin, T. and S.G. Kim, Neuroimage, 2008.
[5] Liu, T.T. and G.G. Brown, J of the Int Neuropsych Soc, 2007.
[6] Huber, L., K. Uludağ, and H.E. Möller, NeuroImage, 2017.
[7] Ivanov, D., et al. Proc. of ISMRM, Paris, France, 2018.
[8] Webb, A.G., Concepts in Magnetic Resonance Part A, 2011.
[9] Poser, B.A., et al., NeuroImage, 2010.
[10] Marques, J.P., et al., NeuroImage, 2010.
[11] Avants, B.B., et al., Neuroimage, 2011.
[12] Wang, L., et al., Cereb Cortex, 2015.
[13] Polimeni, J.R., et al., NeuroImage, 2010.
[14] Koopmans, P.J., et al., NeuroImage, 2011.
[15] Kashyap, S., et al., NeuroImage, 2018.
[16] De Martino, F., et al., PLoS ONE, 2013.
[17] Uludag, K. and Havlicek, M., Proc. of ISMRM, Paris, France, 2018.
[18] Marquardt, I., et al., Hum Brain Mapp., 2018.
Figures