0602
Quantitative magnetization transfer imaging of breast cancer: Initial results at 3T1Vanderbilt University Institute of Imaging Science, Vanderbilt University Medical Center, Nashville, TN, United States, 2Department of Radiology & Radiological Sciences, Vanderbilt University Medical Center, Nashville, TN, United States, 3Department of Biostatistics, Vanderbilt University Medical Center, Nashville, TN, United States, 4School of Medicine, Vanderbilt University, Nashville, TN, United States, 5Institute for Computational Engineering and Sciences, The University of Texas at Austin, Austin, TX, United States, 6Department of Biomedical Engineering, The University of Texas at Austin, Austin, TX, United States, 7Department of Diagnostic Medicine, The University of Texas at Austin, Austin, TX, United States, 8Department of Oncology, The University of Texas at Austin, Austin, TX, United States
Synopsis
Quantitative MT (qMT) techniques provide measurements of the ratio of macromolecular to free water protons, or pool-size-ratio (PSR), which may be useful for detection of changes in macromolecular content of breast tumors early in the course of treatment. Here we report preliminary qMT data acquired as part of an ongoing study employing quantitative MRI to predict the response of breast tumors to neoadjuvant therapy. PSR measurements in tumors were found to be significantly reduced compared to the surrounding fibroglandular tissue in patients diagnosed with invasive breast cancer.
Background
Magnetization transfer (MT) imaging is sensitive to changes in the macromolecular content of tissue and, therefore, has potential as a noninvasive approach to probe the complex tumor environment in cancer1,2. Quantitative MT (qMT) imaging is a technique that quantifies the MT effect and provides specific measures related to tissue composition, including the ratio of macromolecular protons to the protons in the free water pool, or pool-size-ratio (PSR)3. We previously demonstrated the reproducibility of PSR measurements in fibroglandular tissue (FGT) of the breast in healthy women4. Here we report tumor and FGT PSR values from images acquired in women with locally advanced breast cancer as part of an ongoing study designed to use quantitative MRI for predicting response to neoadjuvant therapy5.Methods
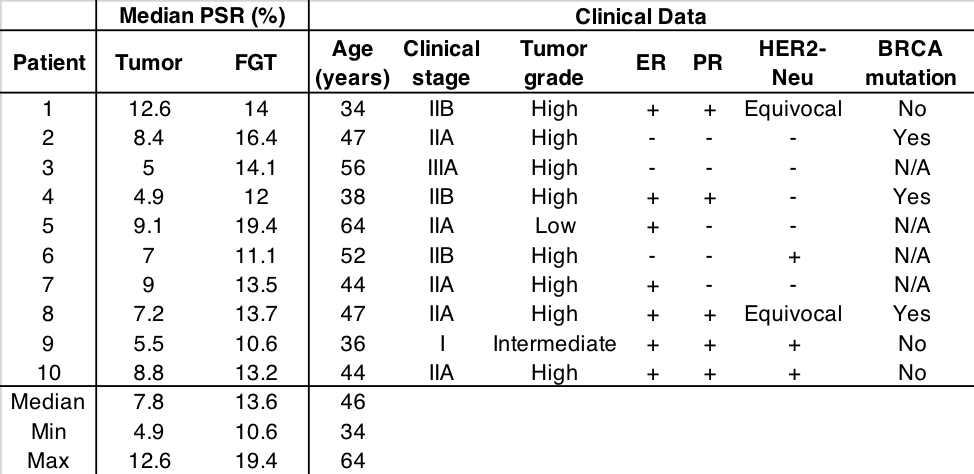
Ten women (median age: 46 years, range: 34-64 years) with biopsy-proven, locally advanced breast cancer were scanned prior to the start of therapy. Images were acquired with a 3T Achieva MR scanner equipped with the MammoTrak table, including a dedicated 16-channel sensitivity encoding (SENSE) receive double-breast coil (Philips Healthcare, Best, The Netherlands). For qMT imaging, a MT-prepared (20 ms sinc-Gauss pulse), segmented EPI sequence (5 lines/shot) with a water-selective excitation pulse (1331, 6°), flow-compensation, and respiratory gating was employed. Data were collected at four MT offset frequencies (1, 2, 4 and 8 kHz) using two MT pulse angles (500° and 800°, plus one image at 0° for normalization), resulting in nine volumes in a nominal scan time of 1 min 38 sec (plus ~30-60 sec for gating). Additional parameters included: acquired (reconstructed) resolution = 2×2×5 mm3 (1.33×1.33×5 mm3), TR/TE = 48/6.6 ms, SENSE factor = 1.5. The qMT model requires independent T1, RF transmit (B1+), and main magnetic field (∆B0) estimates. T1 was estimated using the multiple flip angle method with 10 flip angles (2:2:20°) and TR/TE = 7.9/4.6 ms and was inhomogeneity-corrected via a B1+ map obtained with a Bloch-Siegert method6. ∆B0 was measured using a dual-gradient echo method with fat and water protons in phase. All data were non-rigidly co-registered to the reference qMT volume and fit to a two-pool model to estimate PSR and the T2 of the macromolecular protons. During fitting, the T1/T2 of water protons (40), and the MT rate (48 Hz) were fixed to published values in skeletal muscle7. Median PSR values for tumor and normal-appearing FGT regions of interest (ROIs) were calculated and compared using a Wilcoxon signed-rank test.Results
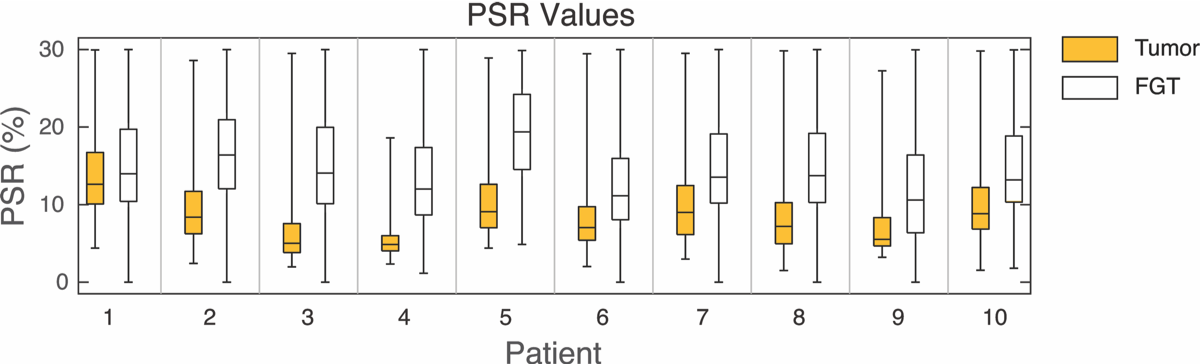
Median tumor and FGT PSR values for each participant are listed in the Table. Boxplots of the PSR values are shown in Figure 1, where the whiskers denote the range of values, the bottom and top of the boxes denote the 25th and 75th percentiles, respectively, and the horizontal line denotes the median PSR value for the ROI. Median PSR values were significantly lower in the tumor ROIs than the normal-appearing FGT ROIs (p = 0.0004).
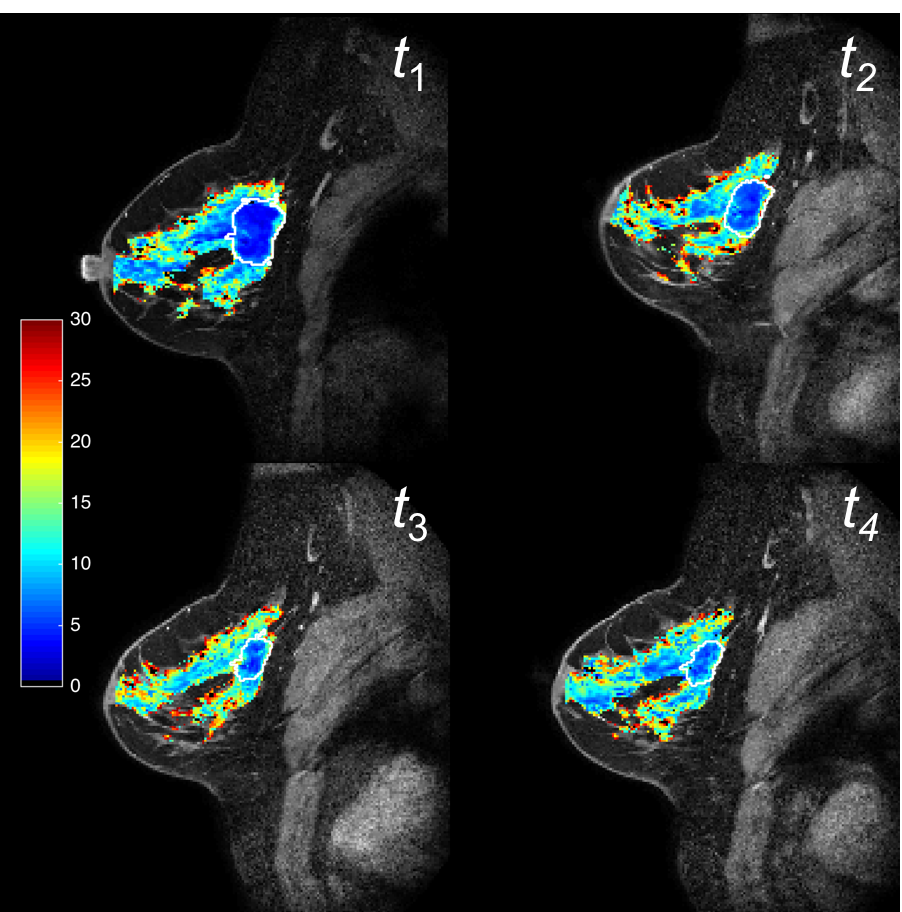
Patient 8 was treated with four cycles of dose-dense Adriamycin & Cytoxan (ddAC) followed by 10 cycles of Taxol. As part of the imaging trial, images were acquired at baseline (t1), after one cycle of ddAC (t2), post-ddAC and pre-Taxol (t3), and after one cycle of Taxol (t4), and the resulting PSR maps are shown in Figure 2. Median tumor PSR values increased throughout the course of treatment (t1: 7.2%, t2: 7.7%, t3: 8.9%, and t4: 9.4%) while median FGT PSR values remained relatively consistent (t1: 13.7%, t2: 13.5%, t3: 13.7%, and t4: 13.8%). The patient demonstrated a partial response to therapy at the time of surgery.
Discussion
qMT imaging is potentially sensitive to changes in glycoprotein content in the extracellular matrix, which is known to change during the tumor life cycle and in response to treatment8; thus, it is a reasonable hypothesis that qMT parameters may change during the course of therapy and potentially be useful for predicting treatment response. Results from this preliminary data set suggest that median tumor PSR values are significantly lower in tumors than the surrounding healthy-appearing FGT and that median tumor PSR values might increase in response to therapy. These results are consistent with previous reports of reduced magnetization transfer ratio (MTR) in malignant breast tumors compared with healthy and benign lesions9,10.
While the underlying mechanisms related to the changes measured by PSR are not well understood, PSR may provide complimentary information to standard quantitative parameters, such as ADC and Ktrans measured by diffusion-weighted and dynamic contrast enhanced MRI, respectively, improving our ability to predict treatment response at an early time point in therapy. Future work includes evaluating the potential of qMT to aid in predicting treatment response in an ongoing multi-parametric study5.
Acknowledgements
The authors would like to thank the staff of the VUIIS Human Imaging Core for assistance. Funding for this work was provided by the National Institutes of Health through U01CA142565, U01CA174706, and CPRIT RR160005.References
1. Bonini RH et al. Magnetization transfer ratio as a predictor of malignancy in breast lesions: preliminary results. MRM. 2008;59(5):1030-1034.
2. Kim S et al. Magnetization transfer imaging of breast cancer at 3T. ISMRM 18th Scientific Meeting. 2010: 4745.
3. Sled JG and Pike GB. Quantitative interpretation of magnetization transfer in spoiled gradient echo MRI sequences. J Magn Reson. 2000;145(1):24–36.
4. Arlinghaus LR et al. Quantitative Magnetization Transfer Imaging of the Breast at 3.0 T: Reproducibility in Healthy Volunteers. Tomography. 2016 Dec;2(4):260-266.
5. Li X et al. Multiparametric magnetic resonance imaging for predicting pathological response after the first cycle of neoadjuvant chemotherapy in breast cancer. Invest Radiol. 2015;50:195-204.
6. Jankiewicz M et al. Improved encoding pulses for Bloch–Siegert B mapping. J Magn Reson. 2013;226:79-87
7. Li K et al. A rapid approach for quantitative magnetization transfer imaging in thigh muscles using the pulsed saturation method. MRI. 2015;33(6):709-717.
8. Rajan R et al. Pathologic changes in breast cancer following neoadjuvant chemotherapy: implications for the assessment of response. Clin Breast Cancer. 2004;5:235-8.
9. Bonini RH, et al. Magnetization transfer ratio as a predictor of malignancy in breast lesions: preliminary results. Magn Reson Med. 2008;59(5): 1030–1034.
10. Heller SL, et al. Differentiation of malignant and benign breast lesions using magnetization transfer imaging and dynamic contrast-enhanced MRI. J Magn Reson Imaging. 2013;37(1):138–145.
Figures