0599
Patient-specific characterization of breast tumor-associated flow using image-guided computational fluid dynamics1Department of Biomedical Engineering, University of Texas at Austin, Austin, TX, United States, 2Institute for Computational and Engineering Sciences, University of Texas at Austin, Austin, TX, United States, 3Department of Radiology, University of Chicago, Chicago, IL, United States, 4Department of Diagnostic Medicine, University of Texas at Austin, Austin, TX, United States, 5Department of Oncology, University of Texas at Austin, Austin, TX, United States
Synopsis
Tumor blood supply and interstitial flow play an essential role in tumor growth, invasion, and treatment response. In this contribution, we employ quantitative DCE-MRI and DWI data to constrain a patient-specific, computational fluid dynamics model of blood flow within breast tumors. To the best of our knowledge, this represents the first attempt at employing non-invasive imaging data to enable
Introduction
Tumor blood supply and interstitial flow play an essential role in tumor development and treatment response, contributing to the high variation in treatment response between patients1,2. In this study, we employ quantitative MRI data, including high-spatial and high-temporal resolution dynamic contrast-enhanced magnetic resonance imaging (DCE-MRI), and diffusion-weighted MRI (DWI), to constrain a numerical simulation of blood flow within a patient-specific geometry. We posit that a more rigorous characterization of flow through tumor-associated vessels, and its interaction with surrounding tissue, will provide important insights into diagnosis, delivery of therapy, and assessment and prediction of response3.Methods
Data Acquisition
Images were acquired on a Achieva 3T-TX (Philips, Netherlands) with a 16-channel bilateral breast coil. DCE-MRI was performed with a 3D spoiled gradient recalled echo protocol, consisting of one fat-suppressed, pre-contrast high-spatial resolution acquisition, four pre-contrast ultrafast, and 19 ultrafast acquisitions after the injection of contrast media (0.1 mM/kg MultiHance, Bracco, Milan) followed by four high-spatial resolution acquisitions. Temporal resolution for ultrafast scans was approximately 3.5s, with spatial resolution: 1.5×1.5×4mm3. Temporal resolution of the high-spatial resolution scans was 55s with spatial resolution: 0.8×0.8×1.6mm3. DWI images were acquired using a fat-suppressed single-shot spin echo sequence with the following acquisition parameters: TR=13s, TE=67ms, b-values: 0, 50, 800s/mm2, acquisition voxel size: 2×2×2.5mm3. Prior to following analyses, a non-rigid demons4 registration was applied to minimize any patient motion that may occur during the acquisition.
Data analysis and modeling
The high-spatial resolution DCE-MRI data were used for morphological analysis as detailed elsewhere5. Briefly, lesion-vasculature structures were first segmented from surrounding tissue. A tracking algorithm then detected vessel segments that have a high probability of contacting the lesion (i.e., tumor-associated vessels). Ultrafast DCE-MRI data was analyzed by fitting the Patlak model6 with a delayed bolus-arrival time, where the AIF was measured from internal thoracic arteries7. Thus, bolus arrival time, Ktrans (volume transfer constant), and vp (volume fraction of blood plasma) can be estimated for each voxel. The DWI data was analyzed by standard methods to estimate the apparent diffusion coefficient (ADC). To establish the computational fluid dynamics approach, the domain was divided into the vessel network (which can be reduced to its centerlines), and interstitial tissue. Model parameters such as vessel radius, vascular permeability, tissue hydraulic conductivity, and assignment of vessels as arteries or veins were assigned from vp, Ktrans, ADC and bolus arrival-time, respectively. The vascular flow was modeled as a pseudo-1D geometry, coupled with the 3D interstitial flow8. We assume that blood flow follows Poiseuille’s law, the interstitial flow governed by Darcy’s law, and the flux across the vascular walls described by Starling’s law. This is solved using a coupled finite difference/finite element approach and implemented in FEniCS9.
Results
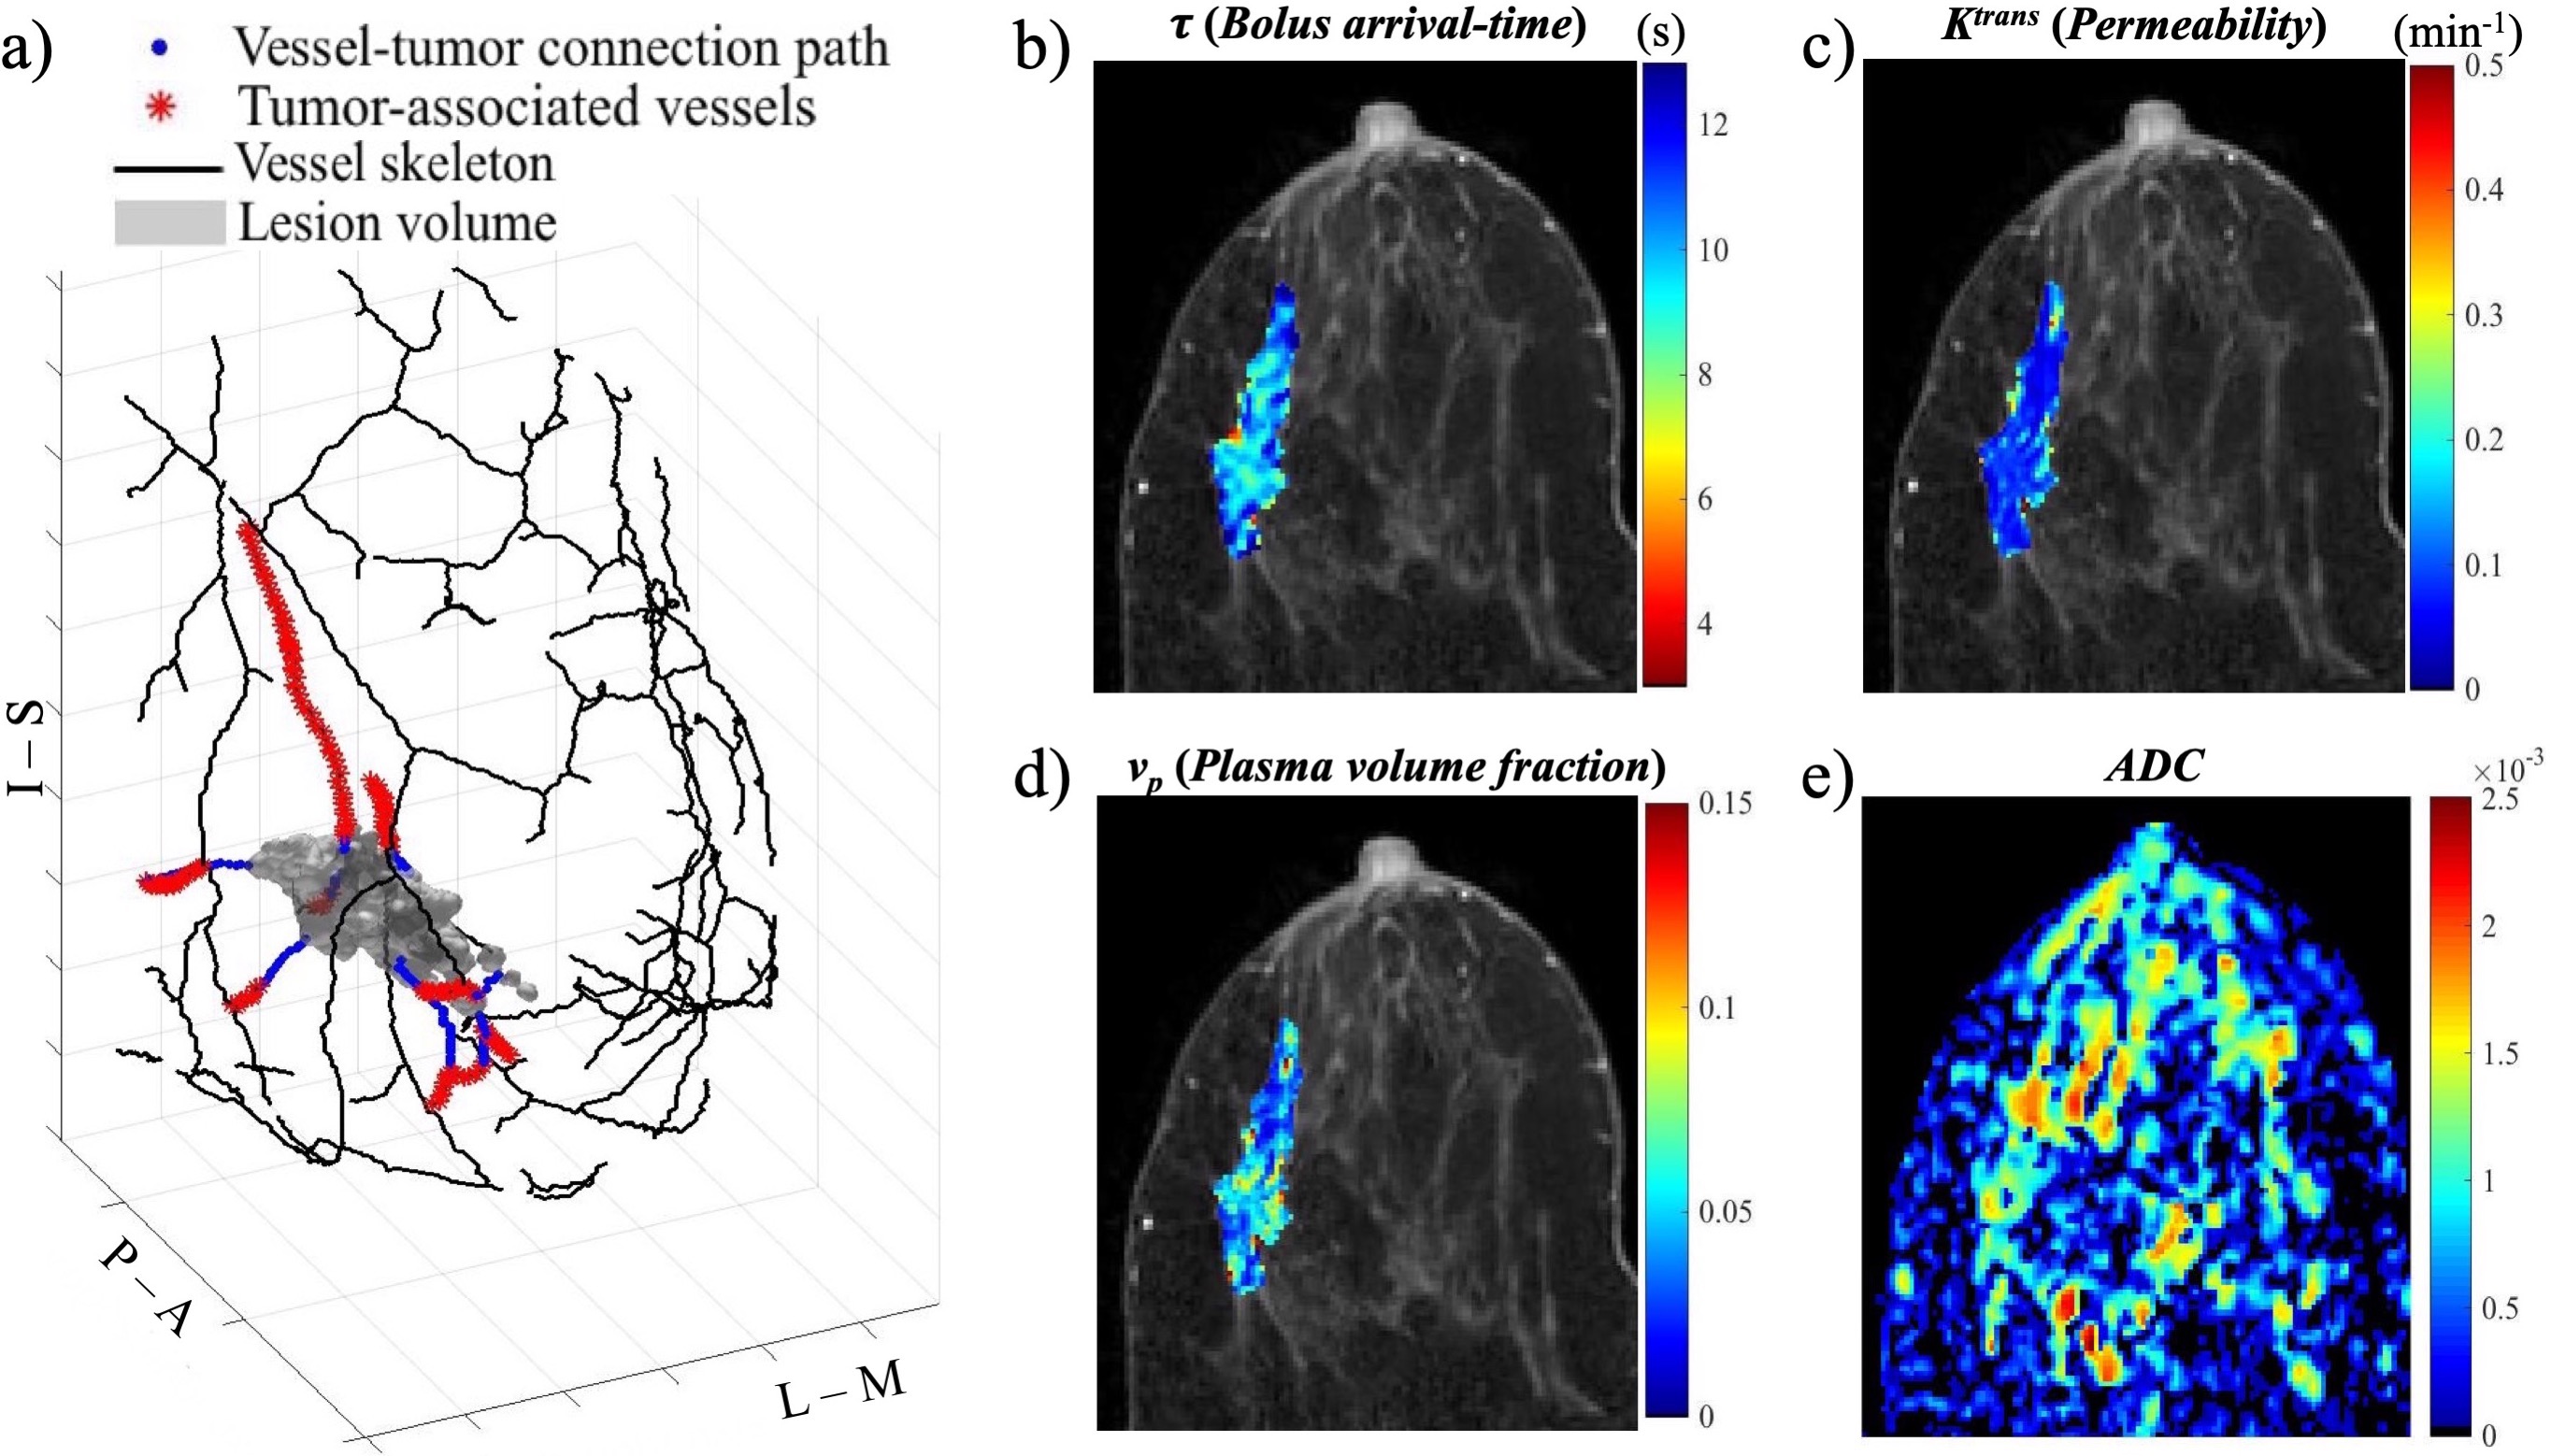
Figure 1 shows the outputs of the MRI analyses. Panel a presents 3D reconstruction of tumor lesion, vasculature and tumor-vessel connections obtained from the segmentation and tracking of high-spatial resolution DCE-MRI data. Panels b-e show the results of the pharmacokinetic modeling of the high-temporal resolution data to estimate bolus arrival-time (b), Ktrans (c) and vp (d), as well as the ADC map (e) estimated from the DWI data.
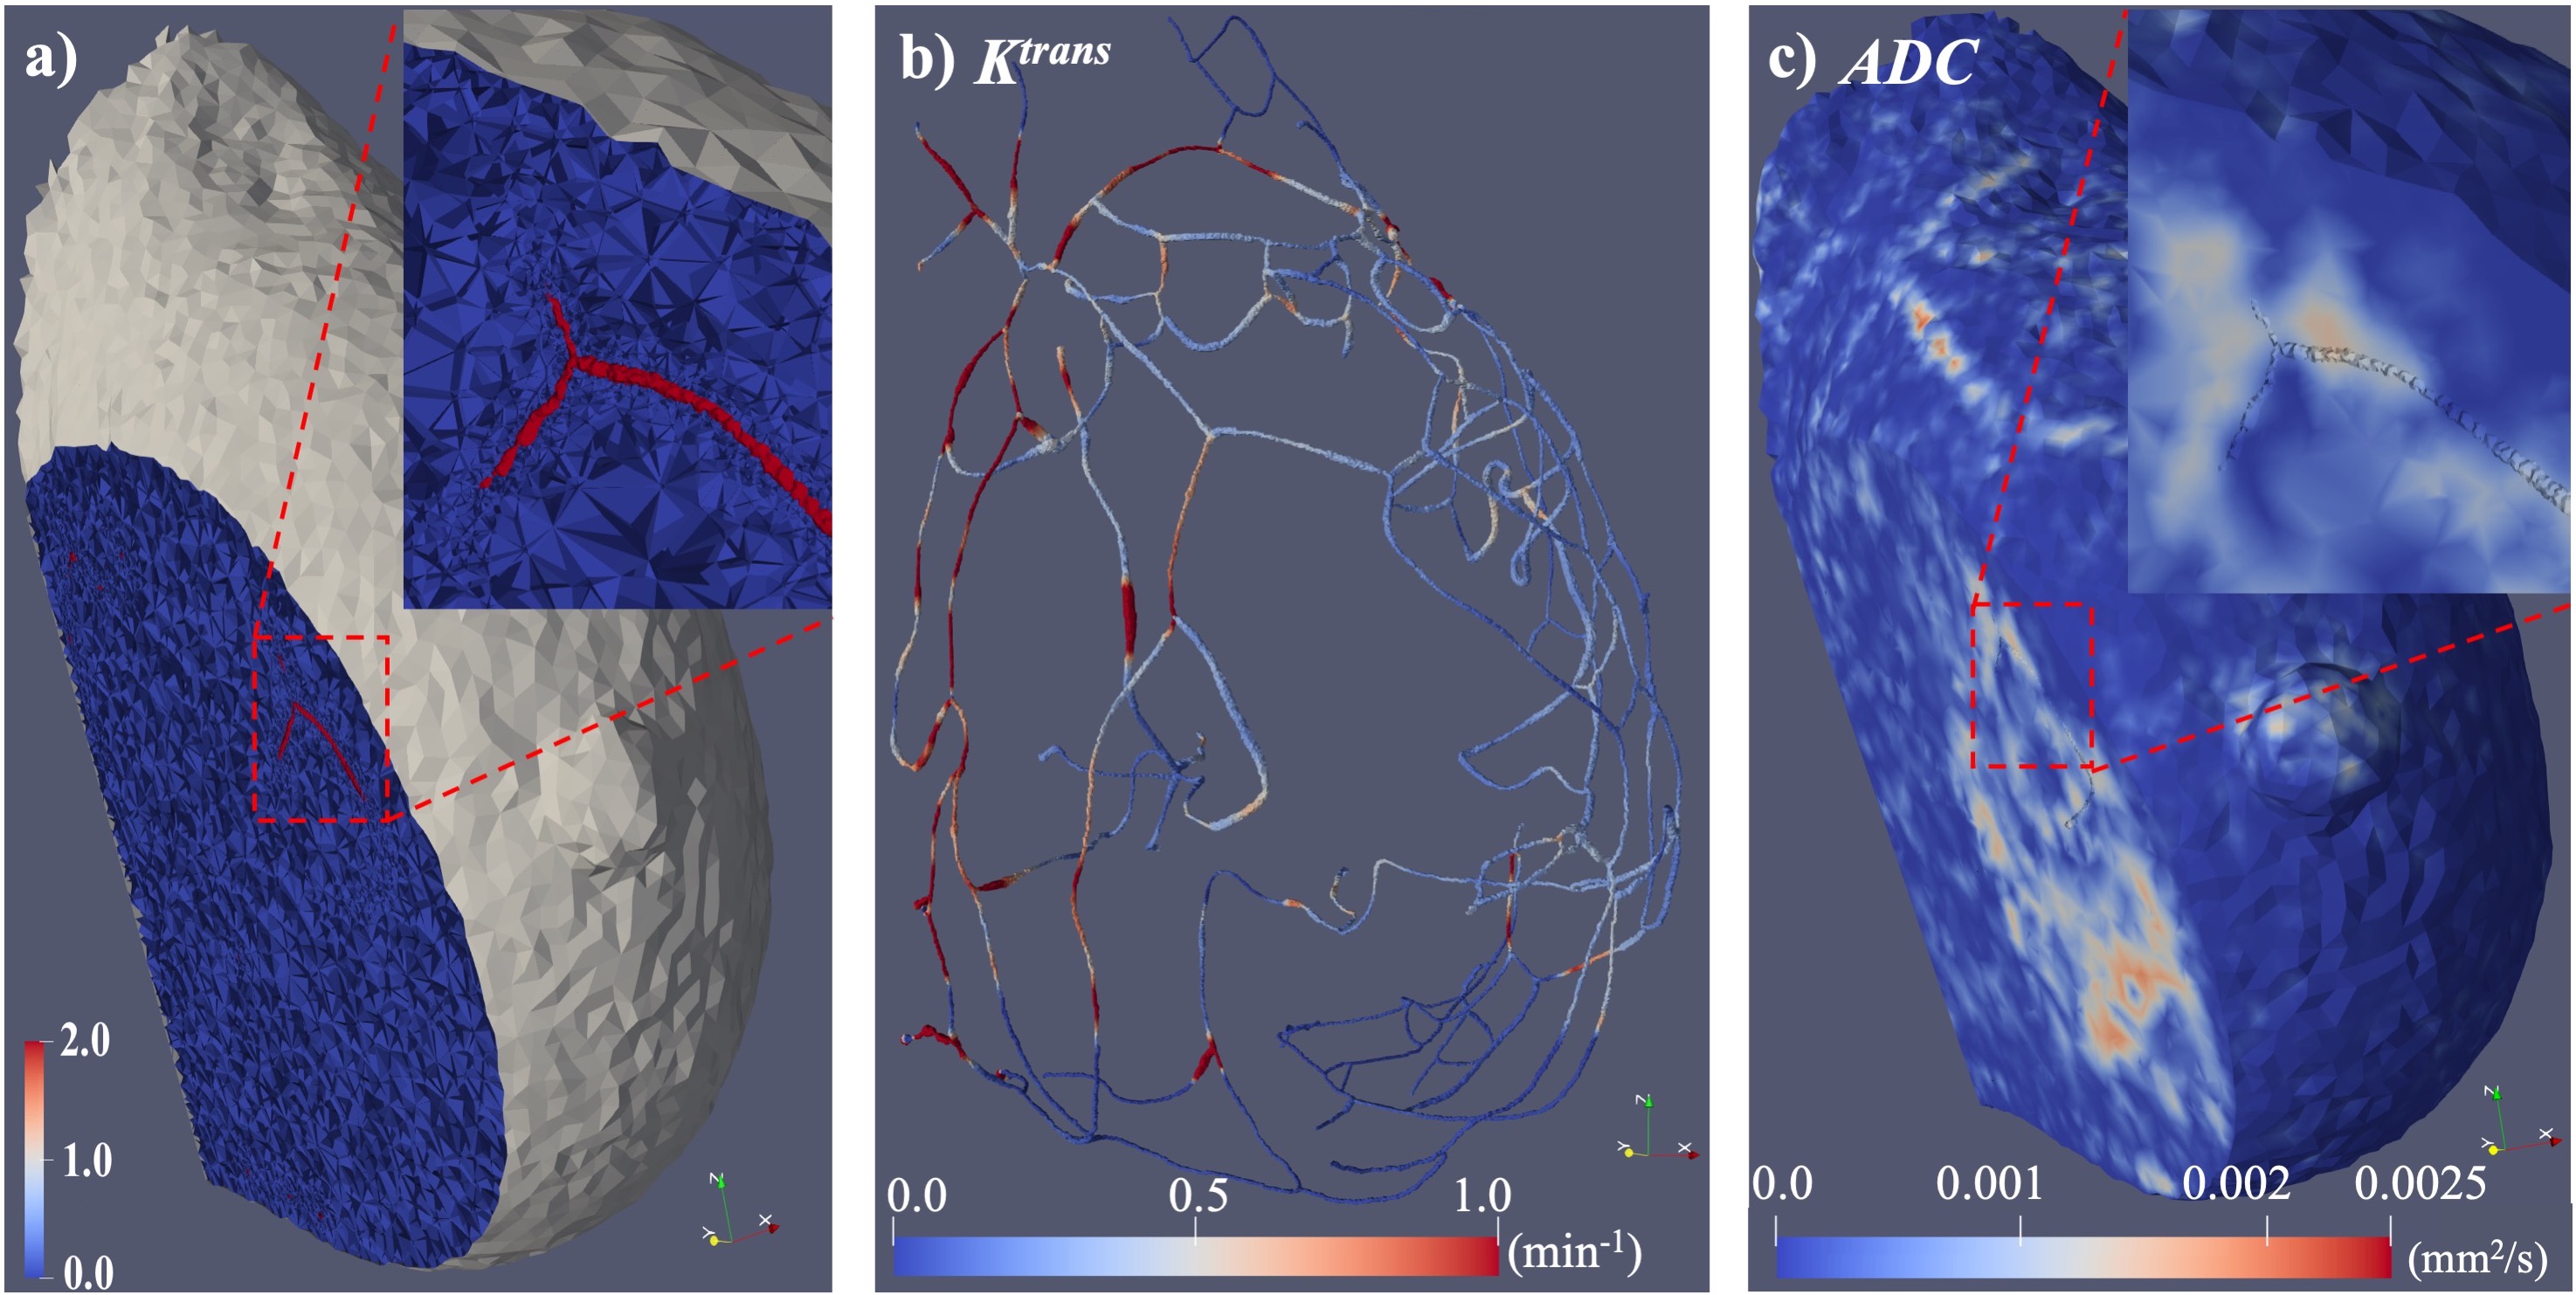
Figure 2 shows the generation of patient-specific geometries and material properties. Segmented vasculature was first scaled by the vp map to estimate vessel radii, and generate the vessel mesh. The tissue mesh was generated by subtracting the vessel mesh from the whole breast region (panel a), and the edge of tissue boundary was labeled as 1, vessel surface labeled as 2. In panel b, the Ktrans map was assigned to the vessel mesh, and in panel c the ADC map was assigned to the tissue mesh, to populate the simulation system with patient-specific parameters.
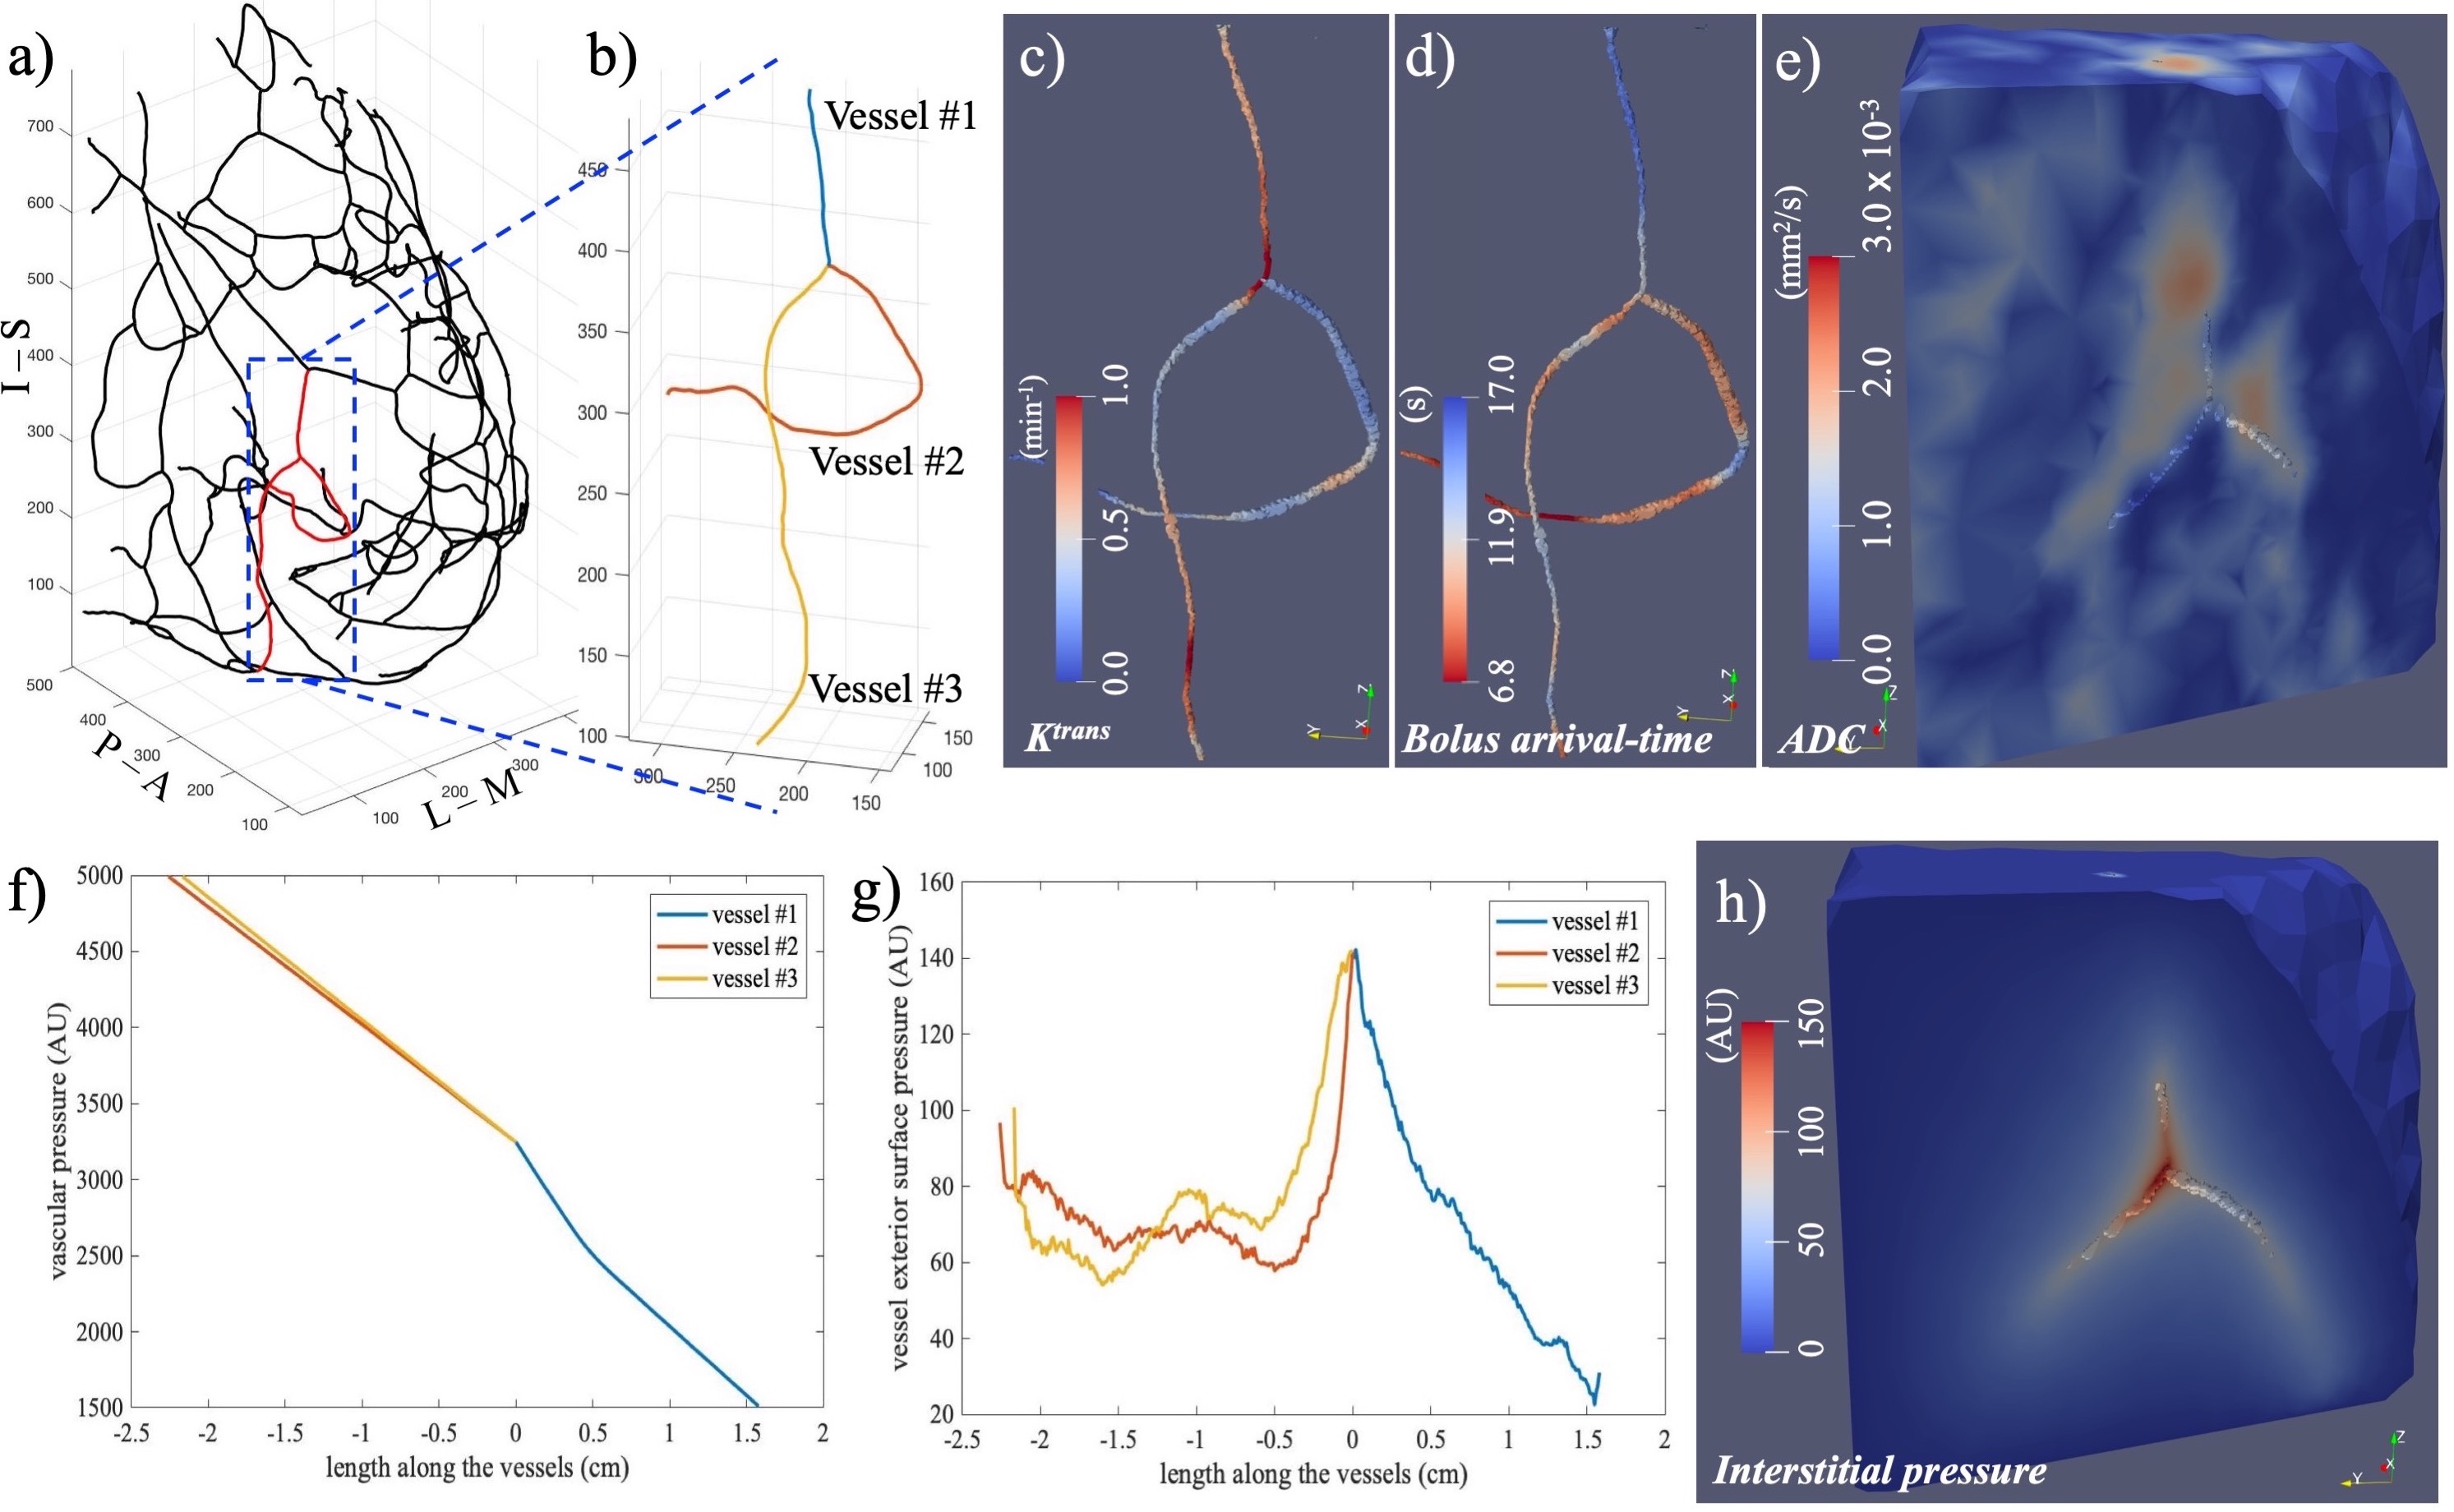
Figure 3 illustrates the simulation process in a sub-region within a breast tumor. Panel a shows the whole vessel tree, while panel b indicates the centerlines of the selected example vessels. Using estimated vessel radii and physiological parameters, meshes were generated and parameters were assigned (panel c-e). The simulation results are shown for vascular pressure (panel f), tissue pressure along exterior surface of vessels (panel g) and tissue pressure distribution in 3D domain (panel h).
Discussion and Conclusion
We have proposed a novel methodology using computational fluid dynamics for obtaining patient-specific hemodynamic parameters. The vessel-tissue geometries are generated from MR images and the physiological properties are also measured from image data of this patient. Current efforts are focused on extending the preliminary results presented here to the entire vascular tree, followed by application to our patient database for both diagnosis and assessing treatment response.Acknowledgements
NCI U01CA142565, U01CA CA174706, R01 CA218700, CPRIT RR160005.References
1. Kamitani et al., Feeding Arteries of Primary Tongue Cancers on Intra-arterial Infusion Chemotherapy. Cardiovascular and interventional radiology. 2016;39(2):227-32.
2. Munson & Shieh, Interstitial fluid flow in cancer: implications for disease progression and treatment. Cancer management and research. 2014;6:317.
3. Sun & Wu, Coupled finite difference and boundary element methods for fluid flow through a vessel with multibranches in tumours. International journal for numerical methods in biomedical engineering. 2013;29(3):309-31.
4. Thirion, Image matching as a diffusion process: an analogy with Maxwell's demons. Medical image analysis. 1998;2(3):243-60.
5. Wu et al., Quantitative analysis of vascular properties derived from ultrafast DCE‐MRI to discriminate malignant and benign breast tumors. Magnetic Resonance in Medicine. 2018.
6. Yankeelov & Gore, Dynamic contrast enhanced magnetic resonance imaging in oncology: theory, data acquisition, analysis, and examples. Current medical imaging reviews. 2007;3(2):91-107.
7. Li et al., A novel AIF tracking method and comparison of DCE-MRI parameters using individual and population-based AIFs in human breast cancer. Physics in Medicine & Biology. 2011;56(17):5753.
8. Cattaneo & Zunino, Computational models for fluid exchange between microcirculation and tissue interstitium. Networks & Heterogeneous Media. 2014;9(1).
9. Logg A, Mardal KA, Wells G, editors. Automated solution of differential equations by the finite element method: The FEniCS book. Springer Science & Business Media. 2012.
Figures