0598
Unsupervised Hierarchical Clustering of PET/MRI Radiomics Features Might Be Helpful to Predict Response to Neoadjuvant Chemotherapy of Breast Cancer1Medical Physicist and Research Department, Hong Kong Sanatorium and Hospital, Hong Kong, Hong Kong, 2Department of Diagnostic and Interventional Radiology, Hong Kong Sanatorium and Hospital, Hong Kong, Hong Kong
Synopsis
INTRODUCTION
Breast cancer is the most common cancer in female population [1]. Neoadjuvant chemotherapy (NAC) is one of the standard treatment strategies in patients with breast cancer [2]. However, the responses of different patients towards the neoadjuvant chemotherapy might differ.
The newly integrated positron emission tomography (PET) and MRI provides a platform to simultaneously give physiological information along with anatomical information with higher soft tissue contrast, hence, could be helpful in providing more information for treatment management of breast cancers [3]. Radiomics is an emerging technology that uses qualitative and quantitative analyses of image features to obtain diagnostic, predictive, or prognostic information from medical images [2]. A previous study suggested an association between PET/CT radiomics features and the response of the tumor to treatment and of patient survival, as well as the phenotypes of the breast tumor [2]. Another recent study showed PET/MRI radiomics features could predict breast cancer recurrence-free survival [3]. In this study, we sought to investigate the potential values of PET/MRI radiomics features in the prediction of NAC response in breast cancer.
METHODS
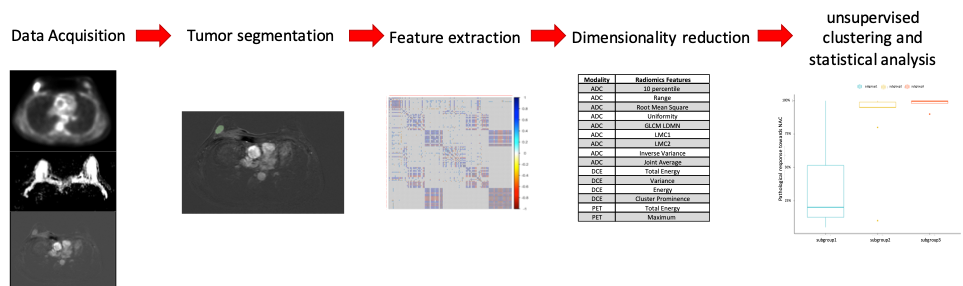
26 newly diagnosed female breast cancer patients (mean age: 44.2; range: 23-62) were recruited for the study. They underwent pre-treatment dedicated breast PET/MRI (Biograph mMR, Siemens Healthineers) scan with an attenuation corrected 4-channel breast coil prior to NAC treatment. The scan began at ~130-150 min post 18F-FDG injection with a single-bed 5 min PET acquisition. MRI protocol included anatomical sequences, DWI (b=0,1000 s/mm2) and DCE-MRI. Breast tumor was segmented manually using 3D SLICER version 4.8.1. 123 radiomics features were extracted from DWI, DCE-MRI and SUV map of PET/MRI-derived first-order statistics and gray level co-occurrence matrix (GLCM). Principal components analysis (PCA) were then conducted for unsupervised feature reduction, resulting in 15 radiomics features including 7 first-order statistics from MRI, 6 GLCM from MRI and 2 first-order statistics from PET.
R studio version 1.1.453 (The R Foundation for Statistical Computing, Vienna, Austria) was used for correlogram construction and unsupervised clustering. The correlations among the extracted radiomics features from PET/MRI were evaluated by Pearson correlation analysis and displayed by correlogram. Unsupervised hierarchical clustering of PET/MRI radiomics features was used to divide the patients into subgroups. Kruskal Wallis test and dunn test as post-hoc were performed to compare the pathology response towards NAC among the subgroups.
RESULTS
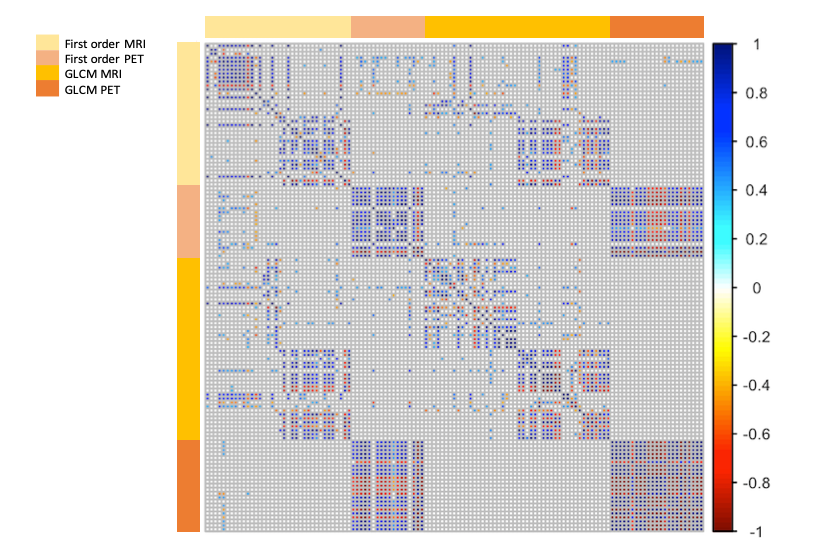
The correlations among 123 radiomics features were shown in figure 2. Stronger correlations were found among the radiomics features extracted by using the same imaging modality.
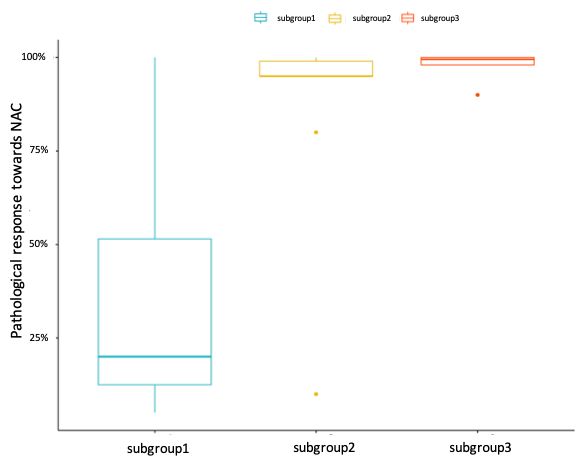
Unsupervised hierarchical clustering based on those radiomics features created 3 subgroups (subgroup1 n=6; subgroup2 n=9; subgroup3 n=8). 3 subjects did not fit into any subgroups were excluded. Higher treatment response towards NAC was observed in subgroup3 [98%±3%] (p<0.005) and subgroup2 [85%±27%] (p<0.06) compared to subgroup1 [36%±34%] shown in figure 2. Four (50%) complete treatment response towards NAC were found in subgroup3, 2 (22.2%) in subgroup2, and 1 (16.7%) in subgroup1.
We also grouped the patients using the conventional clinical information of patient age, tumor type and size, ER, PR, c-erb B2, and Ki-67. There was no significant difference in NAC response among the sub-groups clustered using clinical data (p-value = 0.43).
DISCUSSION
We used the GLCM parameters and the first-order parameters of the radiomics because first-order parameters could characterize the tumor density distribution while GLCM texture has been found to be helpful in discriminating tumor heterogeneity [3]. Unsupervised clustering of radiomics features was used because it allowed exploration of any potential relationship between the PET/MRI radiomics features to breast cancer phenotypic behaviors and disease prognosis without any prior knowledge.
Variable treatment responses towards NAC were found among the subgroups clustered by the PET/MRI radiomics features, which was not observed in the subgroups clustered by some conventional clinical information, hence, showing some associations between PET/MRI radiomics features and the treatment response towards NAC of breast cancer. However, there are some limitations in this study, such as the small sample size and relatively small number of radiomics parameters used. A larger study cohort with more parameters should be conducted to validate this result.
Acknowledgements
No acknowledgement found.References
1. Rice, S.L. and K.P. Friedman, Clinical PET-MR Imaging in Breast Cancer and Lung Cancer. PET Clin, 2016. 11(4): p. 387-402.
2. Ha, S., et al., Metabolic Radiomics for Pretreatment (18)F-FDG PET/CT to Characterize Locally Advanced Breast Cancer: Histopathologic Characteristics, Response to Neoadjuvant Chemotherapy, and Prognosis. Sci Rep, 2017. 7(1): p. 1556.
3. Huang, S.Y., et al., Exploration of PET and MRI radiomic features for decoding breast cancer phenotypes and prognosis. NPJ Breast Cancer, 2018. 4: p. 24.
Figures