0593
Breast Pharmacokinetic Mapping using an Abbreviated Dynamic Contrast Enhanced (DCE) MRI Protocol1Stanford University, Stanford, CA, United States
Synopsis
The morphologic and kinetic information of a breast lesion can be quantified using pharmacokinetic models enabled by DCE MRI, which often has
Introduction
It has been well established that the rate of contrast uptake and washout in DCE MRI is an important criterion to differentiate malignant from benign lesions[1]. Recent fast DCE acquisition using differential subsampling with Cartesian ordering(DISCO) achieves higher temporal and spatial resolution, which enables the capture of ‘hot spots’ of very rapid enhancement in tumors[2]. A routine DCE scan using DISCO takes about 15 mins, including a total of 19 phases. In this work, we aim to investigate the feasibility of an abbreviated dynamic breast MRI protocol (<10 mins) for diagnostic purposes including pharmacokinetic mapping.Methods
Three-dimensional T1-weighted DCE images were acquired using DISCO with full protocol, where 1 pre-contrast and 4 post-contrast images were acquired with a high spatial resolution of 0.5×0.6×1.0 mm and low temporal resolution of 2.5 mins, and 14 dynamic enhanced images were acquired immediately following contrast injection with a high temporal resolution of 13s and lower spatial resolution of 0.5×1.2×2.0 mm. A 2-point Dixon technique isused for fat suppression. Imaging parameters used are as following: 300×360 mm field of view, 188 slices, TR/TE1/TE2 =6.2/2.2/3.3ms. Two abbreviated protocols (i.e., Abb1 and Abb2) were achieved by retrospectively using the same pre-contrast and dynamic phases as of the full protocol but contain only two and one post-contrast phases, resulting in a reduction of scanning time of 5 and 7.5 mins, respectively. Voxel by voxel pharmacokinetic maps over 60 breast lesions (17 benign and 43 malignant lesions) are estimated from the DCE signals acquired using the above protocols. Standard Tofts model is used as the reference in this work[3], given by
$$C_t (t)=C_p (t)*K^{trans} e^{-K^{trans} t/v_e }=C_p (t)*K^{trans} e^{-k_{ep} t }, (1) $$
Where $$$C_t (t)$$$ is the concentration in tissue concentration, $$$C_p (t)$$$ is population-based arterial input function (AIF), $$$K^{trans}$$$ and $$$k_{ep}$$$ are the transfer coefficient and flux rate between plasma space and the extravascular extracellular space(EES). However, it is observed signal enhancement curves with very rapid wash-in and wash-out rate do not fit basic Tofts models[4]. A modified-local-density-random-walk (mLDRW) model[5] that demonstrated improved fitting performance in capturing these hot spots is also investigated:
$$ C_t (t)= α\sqrt{\frac{κ}{2πt}} e^{-\frac{κ(t-MTT)^2}{2t}}* K^{trans} e^{-k_{ep} t}, (2)$$
Where κ and MTT are the dispersion parameter and mean transit time. Note an external AIF is not needed, but rather is fitted directly in the mLDRW model. The fitting performances of these two models are compared for full and abbreviated protocols. The capabilities of κ from mLDRW model and $$$K^{trans}$$$ from Tofts model in discerning malignant from benign lesions are evaluated using a receiver-operating characteristic (ROC) curve.
Results
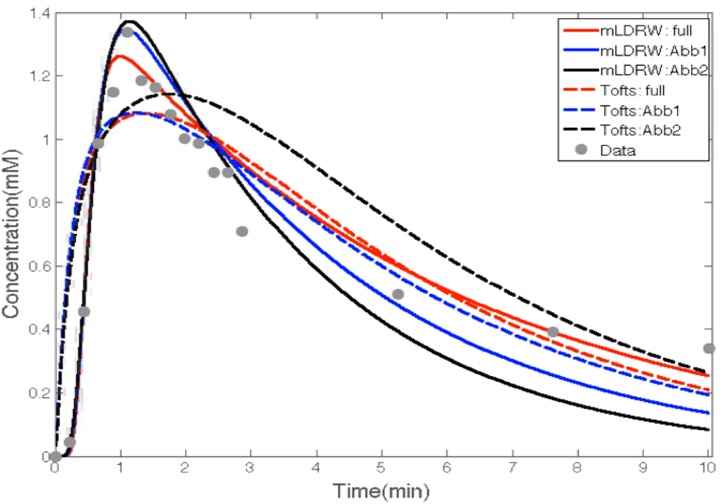
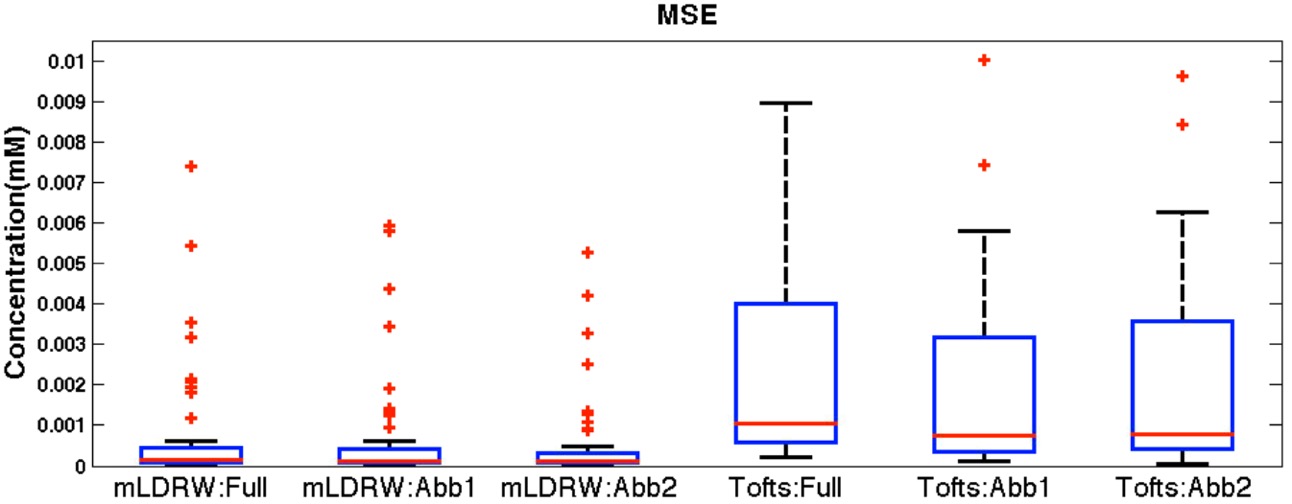
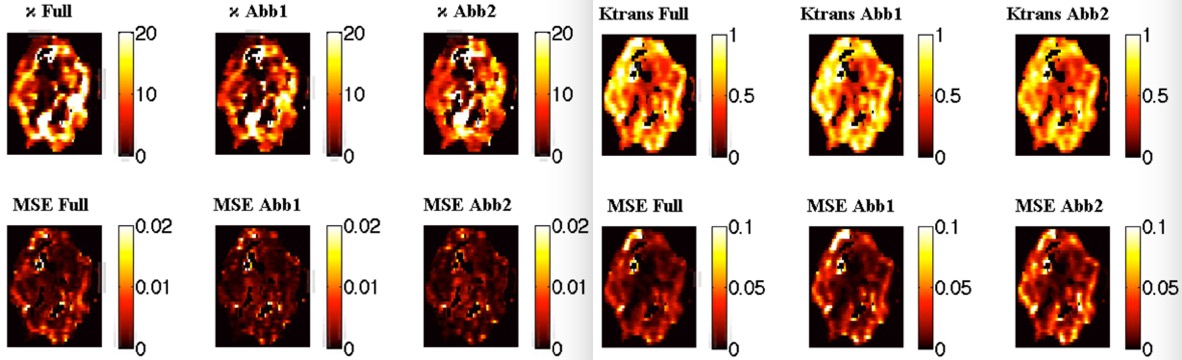
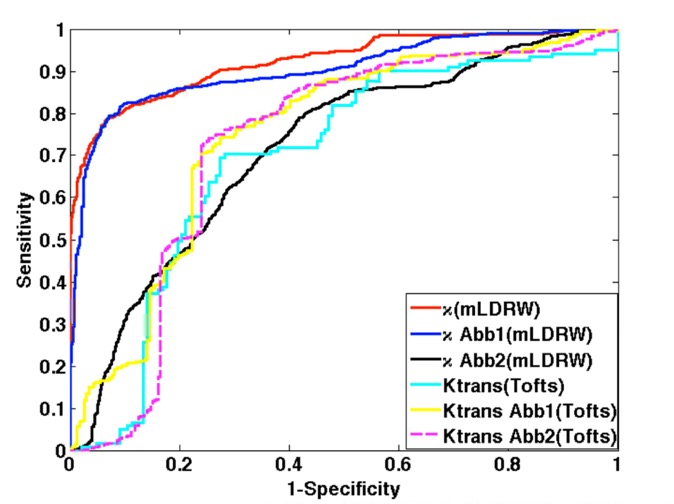
Figure 1 shows that the mLDRW model is superior to the Tofts model in capturing rapid wash-in and wash-out phases, which is more prominent with reduced scanning time but has sacrificed performance in fitting the missing points. In Figure 2, the Abb1 and 2 protocols significantly reduce the fitting error comparing to the full protocol (p<0.01) for the mLDRW model, which is not seen for Tofts model (p>0.1). As shown in Figure 3, the κ(mLDRW) and $$$K^{trans}$$$ (Tofts) mapping are correlated in intensity for different protocols. And fitting MSE within the tumor region further verifies the findings in Figure 2. The ROCs in Figure 4 demonstrate the superior performance of κ(mLDRW) (AUC = 0.93) in discerning malignant from benign lesions comparing to $$$K^{trans}$$$(Tofts) (AUC = 0.70) using full protocol. The AUC of κ is consistent when Abb1 (AUC = 0.92) is used but reduced to 0.71 for Abb2. In comparison, the proposed abbreviated protocols have little impact on the diagnostic performance of $$$K^{trans}$$$(Tofts), where the AUCs for full, Abb1 and Abb2 protocols are 0.70, 0.73 and 0.72, respectively.Discussion
In this work, the fittings and diagnostic performances of two pharmacokinetic models are investigated using full and abbreviated protocols. We found that the abbreviated protocols have little impact on the fitting and diagnostic performance of $$$K^{trans}$$$ mapping for Tofts model comparing to full protocol. The mLDRW model has superior performance in fitting, resulting in superior capability in discerning malignancy from benign. In mLDRW model, the fitting improvements are seen with abbreviated protocols, which do not necessarily translate to better diagnostic performance, indicating critical temporal information needs to be included to guarantee the diagnostic accuracy of κ mapping in mLDRW model. However, we found that the Abb1 protocol with two post-contrast phases is sufficient to perform mLDRW pharmacokinetic mapping with high fidelity.Conclusion
Using high-temporal rate dynamic contrast-enhanced acquisitions, pharmacokinetic parameter fits show the potential for similar diagnostic performance between a full protocol and an abbreviated protocol that eliminates two 2.5min post-contrast image.Acknowledgements
Research support from GE Healthcare, NIH R01 EB009055, and NIH T32 CA009695References
1. Kuhl, C.K., et al., Dynamic breast MR imaging: are signal intensity time course data useful for differential diagnosis of enhancing lesions? Radiology, 1999. 211(1): p. 101-10.
2. Levine, E., et al., 3D Cartesian MRI with compressed sensing and variable view sharing using complementary poisson-disc sampling. Magn Reson Med, 2017. 77(5): p. 1774-1785.
3. Tofts, P.S., et al., Estimating kinetic parameters from dynamic contrast-enhanced T(1)-weighted MRI of a diffusable tracer: Standardized quantities and symbols. Journal of Magnetic Resonance Imaging, 1999. 10(3): p. 223-232.
4. Brix, G., et al., Microcirculation and microvasculature in breast tumors: pharmacokinetic analysis of dynamic MR image series. Magn Reson Med, 2004. 52(2): p. 420-9.
5. Mischi, M., et al., Magnetic resonance dispersion imaging for localization of angiogenesis and cancer growth. Invest Radiol, 2014. 49(8): p. 561-9.
Figures