0592
Investigation of the use of T1 relaxation time map in synthetic MRI for diagnosis of breast cancer1Department of Medical Imaging, Sun Yat-sen University Cancer Center, Guangzhou, China, 2GE Healthcare, MR Research China, Beijing, China
Synopsis
It is known that benign and malignant breast cancer feature different T1 relaxation, the use of T1 relaxation in differential diagnosis has been reported. However accurate measurement of T1 relaxation requires knowledge of B1 distribution, which is inhomogeneous in breast. Synthetic MRI offers B1 corrected T1 relaxation time, its use breast cancer diagnosis has not yet been reported. Here, the use of the T1 mapping in synthetic MR in differential diagnosis of benign and malignant cancer is investigated. Our results demonstrated that T1 mapping offered by synthetic MR may be a potential quantitative biomarker for diagnosis of breast cancer.
Introduction
Differential diagnosis of benign and malignant breast cancer usually requires the use of dynamic contrast imaging 1. It is known that benign and malignant lesions feature different T1 relaxation, the use of T1 relaxation in differential diagnosis has been previously reported 2-4. However accurate measurement of T1 relaxation requires knowledge of B1 distribution, which is especially inhomogeneous in breast. Synthetic MRI offers B1 corrected T1 relaxation time, its use breast cancer diagnosis has not yet been reported. In this work, the use of the T1 mapping in synthetic MR in differential diagnosis of benign and malignant cancer is investigated.Methods
In this prospective study, a total of 30 patients detected with breast space-occupying lesions using physical examination. All the subjects underwent MR exams on a 3.0T whole body scanner (Signa Pioneer, GE, WI) and then received biopsy. The scan sequences included routine scan and synthetic MR (magnetic resonance image compilation, MAGiC). The scan parameters for synthetic MR were: TR = 4000 ms, TE1=21 and TE2=95 ms, slice thickness/gap = 5/1 mm, FOV = 28 cm, data matrix = 320*256, echo length = 16, bandwidth = 41.67 Hz. Region of interests (ROI) were placed on the lesions based on perfusion enhanced images by one experienced radiologists, then the ROIs were copied onto T1 relaxation maps and mean values were recorded. The results were then analyzed by independent sample t-test.Results
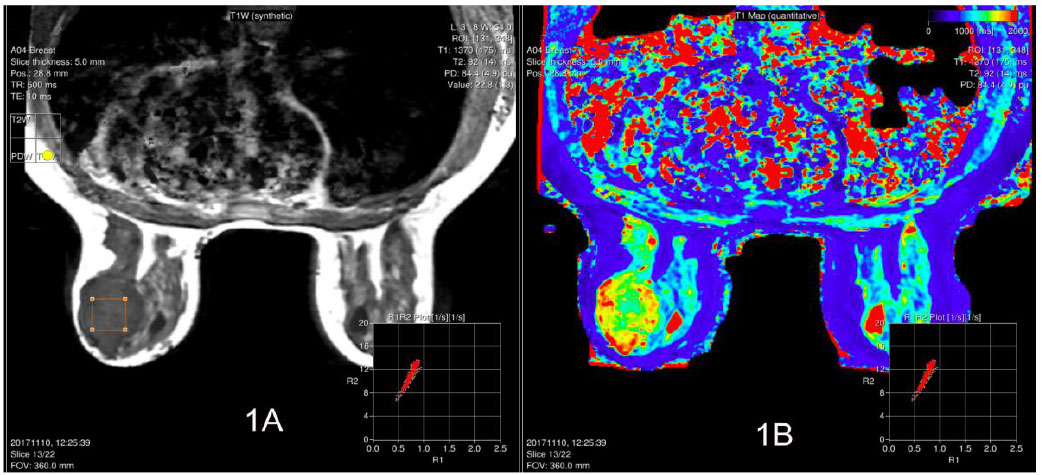
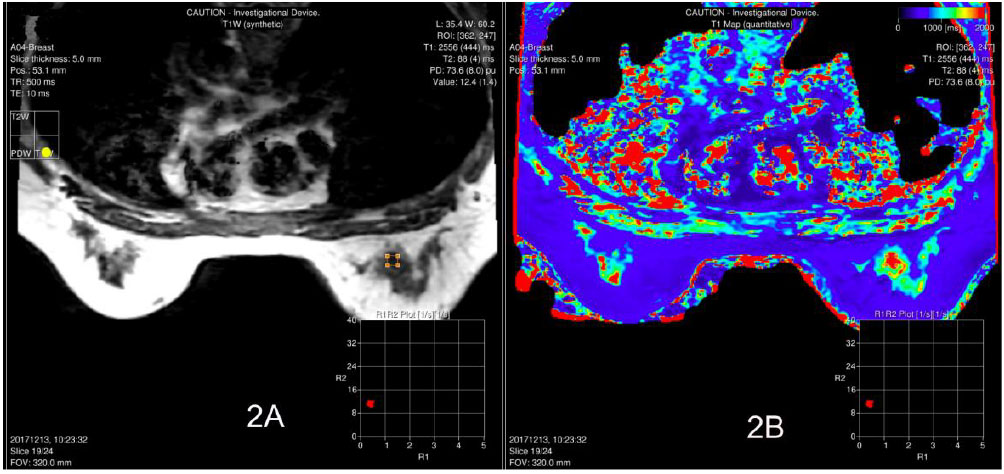
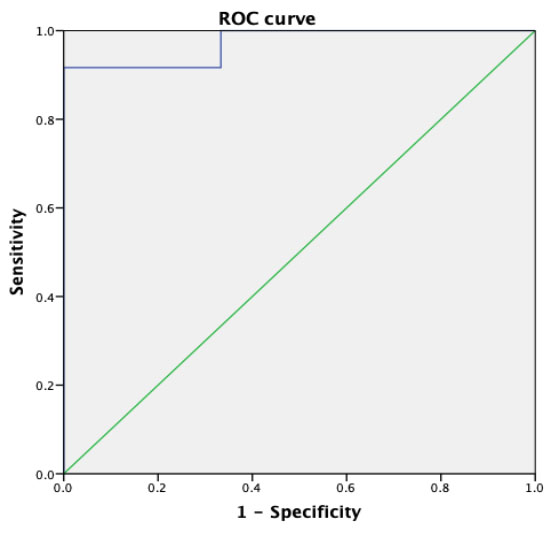
Out of the 30 patients, 18 cases of breast cancer, 11 cases of fibroadenoma and 1 case of inflammatory lesion were confirmed by biopsy. Representative images of patients with benign (fibroadenoma) and malignant lesions (infiltrating cancer) are shown in Figure 1 and 2 respectively. The T1 value of benign lesions was 1812.00 ± 184.99 ms, and that of breast cancer was 2766.83± 130.79 ms. The T1 value of cancer was significantly higher than that of benign lesions (P < 0.001). The area under the curve was 0.972. Using 2314.00 ms as the cut-off between benign and malignant breast lesions, a sensitivity of 91.7% and a specificity of 100% was obtained.Discussion
The use of T1 relaxation may offer a contrast free and quantitative means for differential diagnosis of benign and malignant breast cancer, is however hurdled with practical acquisition and B1 inhomogeneity. Synthetic MR presents a great solution to this need. In this preliminary work, it was observed that benign and malignant lesions feature different T1 relaxation times with statistical significance. Future work with larger cohort may be needed to further verify the clinical utility of the relaxation time offered by synthetic MR.Conclusion
T1 mapping offered by synthetic MR may be a potential quantitative biomarker for diagnosis of breast cancer.Acknowledgements
No acknowledgement found.References
1. Li L, Wang K, Sun X, et al. Parameters of Dynamic Contrast-Enhanced MRI as Imaging Markers for Angiogenesis and Proliferation in Human Breast Cancer[J]. Medical Science Monitor International Medical Journal of Experimental & Clinical Research, 2015, 21(2):376-382.
2. Fernandes JL, Rochitte CE. T1 mapping: technique and applications.[J]. Magnetic Resonance Imaging Clinics of North America, 2015, 23(1):25-34.
3. Karamitsos T D, Piechnik S K, Banypersad S M, et al. Noncontrast T1 mapping for the diagnosis of cardiac amyloidosis[J]. Jacc Cardiovasc Imaging, 2013, 6(4):488-497.
4. Puntmann V O, Voigt T, Chen Z, et al. Native T1 Mapping in Differentiation of Normal Myocardium From Diffuse Disease in Hypertrophic and Dilated Cardiomyopathy[J]. Jacc Cardiovascular Imaging, 2013, 6(4):475-484.
Figures