0591
Preoperative prediction of lymphovascular invasion in invasive breast cancer with DCE-MRI-based radiomics1radiology, Jiangmen Central Hospital, Jiangmen, China, 2Automation, Guilin University of Aerospace Technology, Guilin, China, 3Philips Healthcare, Guangzhou, China
Synopsis
Preoperative assessment of lymphovascular invasion (LVI) plays an important role in the therapeutic planning for individual breast cancer patient. A few MRI features have been shown to be associated with LVI, but remain controversial. This prospective study explored DCE-MRI-based radiomics for preoperative prediction of LVI in breast cancer. The results suggested that radiomics signature and MRI based axillary lymph node status were significantly correlated with LVI. The combined model, which incorporated the radiomics signature and MRI based axillary lymph node status, could preoperatively predict LVI with acceptable performance in the training and validation cohorts.
Introduction
Lymphovascular invasion (LVI) has been widely recognized as a negative prognostic factor in invasive breast cancer1-5. Preoperative assessment of LVI status plays an important role in the therapeutic planning for individual breast cancer patient. In neoadjuvant chemotherapy (NAC), LVI may indicate chemoresistant patients before NAC6. For breast surgery, LVI indicates the need for extended local excision or mastectomy7, 8. Moreover, LVI status assists the decision making of sentinel lymph node biopsy and axillary lymph node (ALN) dissections9, 10. Previous studies on preoperative breast MRI have demonstrated a few MRI features, including adjacent vessel sign, peritumoral edema, prepectoral edema, tumor apparent diffusion coefficient (ADC) and peritumour-to-tumour ADC ratio, that were associated with LVI11-15. However, these MRI features remained controversial. Dynamic contrast-enhanced (DCE)-MRI-based radiomics has been used for differentiating malignancy16, classifying molecular subtypes17, assessing Ki67 status18, evaluating the risk of recurrence19, predicting the response to treatment20, 21 and sentinel lymph node metastasis in breast cancer22. To the best of our knowledge, no studies have investigated LVI prediction by DCE-MRI-based radiomics. The purpose of this prospective study was to determine the role of radiomics base on DCE-MRI for preoperative prediction of LVI in invasive breast cancer.Methods
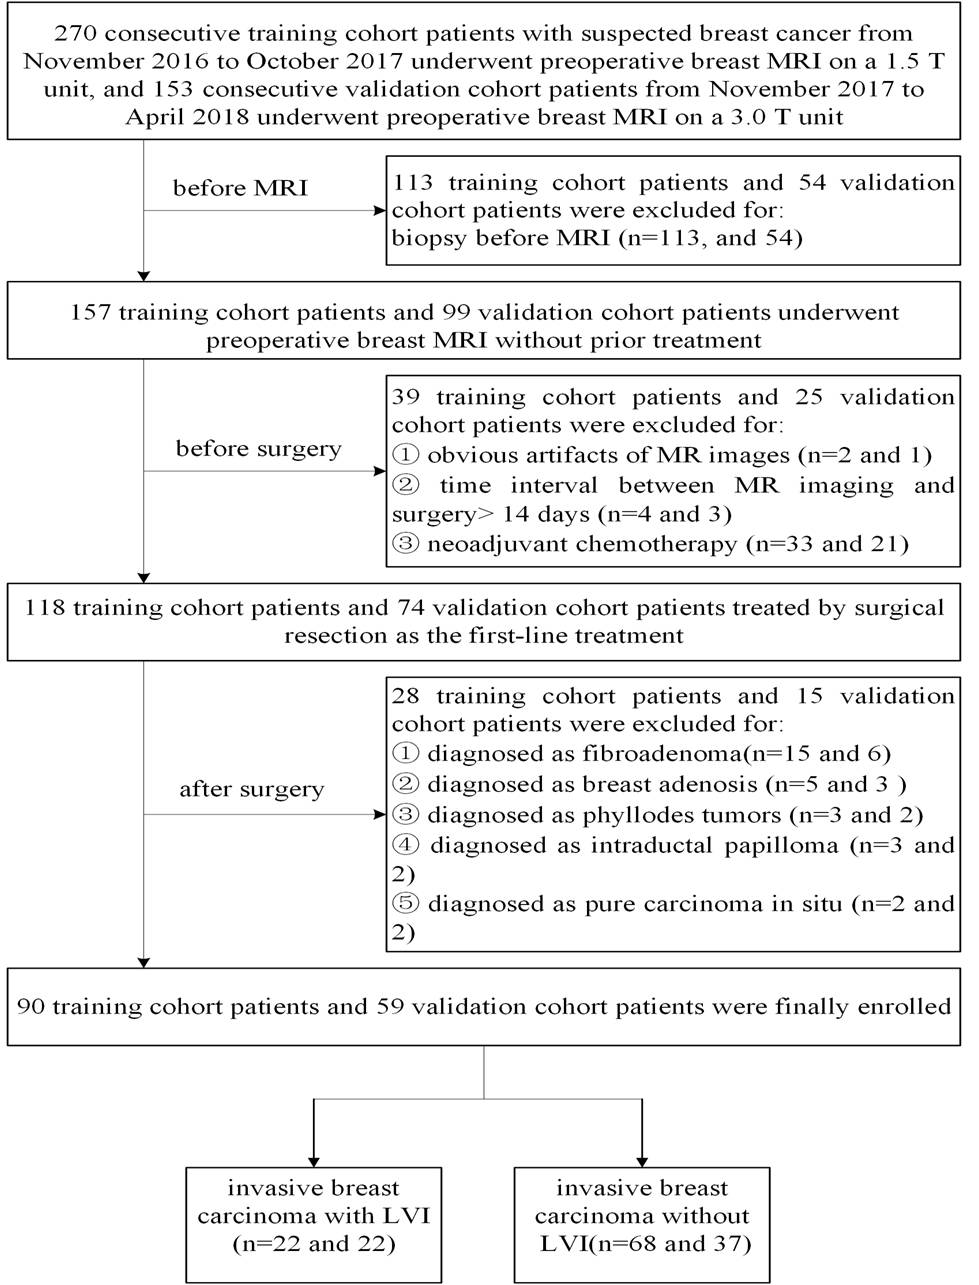
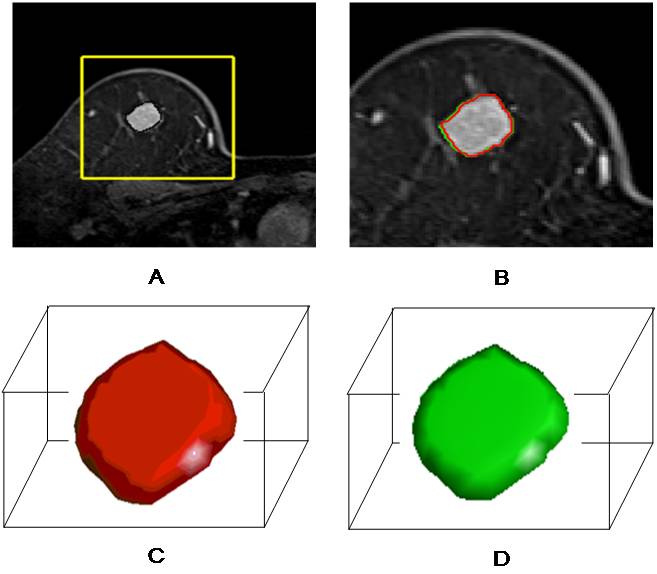
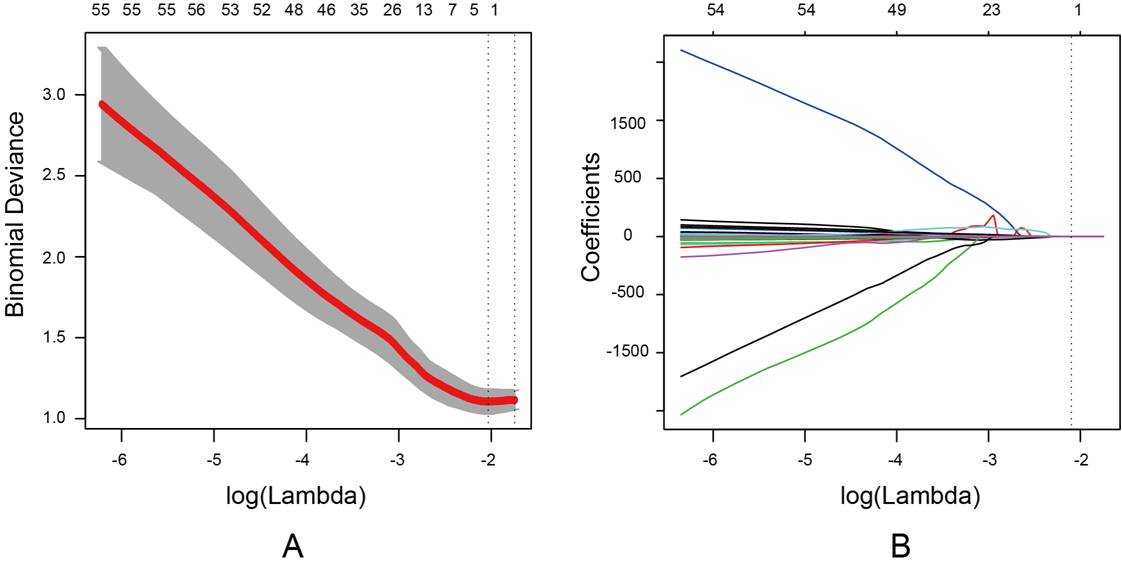
DCE-MRI was performed in a total of 423 consecutive suspected breast cancer female patients. Patients were selected according to inclusion and exclusion criteria and divided into training cohort and validation cohort (Figure 1). ALN status was evaluated based on MR images according to the criteria published in previous studies23-25. DCE semi-quantitative parameters of lesions including the initial percentage of enhancement (E1), percentage of peak enhancement (Epeak), signal enhancement ratio (SER) and time to peak enhancement (TTP) were calculated. Volume of interest (VOI) segmentation of breast cancer lesions based on DCE-MRI was performed for radiomic features extraction (Figure 2). Radiomic features selection and radiomics signature construction were done by the least absolute shrinkage and selection operator (LASSO) regression in the training set with 10-fold cross validation (Figure 3). The independent risk factors of LVI were identified by multivariate logistic regression analyses. LVI related prediction models were built on each independent risk factor and their combination. The performances of the prediction models were assessed with receiver operating characteristics curve (ROC) analysis in the validation cohort and compared by DeLong test. Their clinical usefulness was evaluated by decision curve analysis (DCA).Results
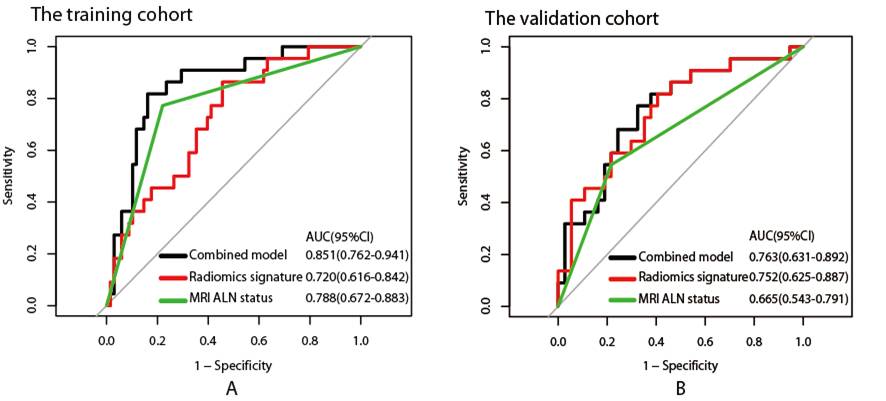
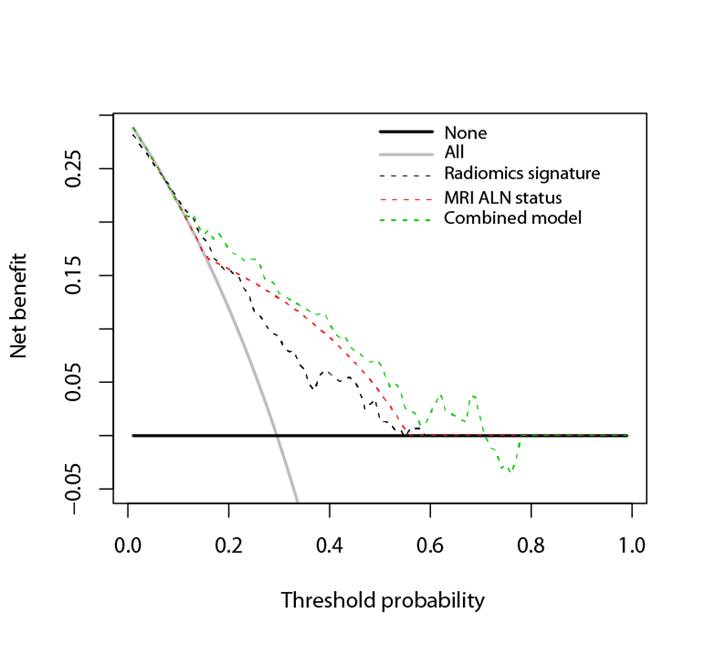
Ninety training cohort patients with 22 LVI-positive and 68 LVI-negative lesions, and 59 validation cohort patients with 22 LVI-positive and 37 LVI-negative lesions were enrolled. No significant differences in LVI prevalence were found between two cohorts (P=0.068). The MRI ALN status was statistically different between LVI-positive and LVI-negative patients in the training cohort (P<0.001) and validation cohort(P=0.001) . There was no significant difference in E1, Epeak, SER or TTP between LVI-positive and LVI-negative patients in the training cohort (P=0.105-0.329) or validation cohort (P=0.060-0.804). A radiomics signature consisted of 2 selected features showed significant difference between the positive and negative groups in the training cohort (P=0.002) and in the validation cohort (P=0.001). MRI ALN status (OR, 10.452; P<0.001) and the radiomics signature (OR, 2.895; P=0.031) were identified as independent risk factors for LVI at multivariate analysis. Figure 4 showed the ROC curves of prediction models in the training and validation cohorts respectively. In the validation cohort, the area under the curve (AUC) of combined model (AUC, 0.763) was higher than MRI ALN status alone (AUC, 0.665) (P=0.029), and similar to radiomics signature (AUC, 0.752) ( P=0.857). DCA showed that within the range of 0.16 to 0.72, the combined model added more net benefit than MRI ALN status or radiomics signature alone (Figure 5).Discussion
Our preliminary results suggested that MRI ALN status and DCE-MRI-based radiomics signature were significantly correlated with LVI. Though as a simple and robust subjective feature, MRI ALN status alone was less effectively in predicting LVI status. The radiomics signature could enhance the predictive performance by introducing it into the prediction model. Variance and gray level variance (GLV) based on GLSZM were two valuable radiomics features for prediction of LVI status. They both implied intratumoral biological heterogeneity, which was mostly caused by a complex microstructure with multiple tissue components, such as necrosis, hemorrhage, inflammation and tumor cell. The combined prediction model, which incorporated two items of the radiomics signature and MRI ALN status, was an effective tool for the preoperative prediction of LVI. It could help the selection of optimal surgical strategy and clinical decision for individuals.
Acknowledgements
No acknowledgement found.References
1. Bae MS, Moon HG, Han W, et al. Early Stage Triple-Negative Breast Cancer: Imaging and Clinical-Pathologic Factors Associated with Recurrence. Radiology. 2016;278(2):356-364.
2. Niemiec JA, Adamczyk A, Ambicka A, et al. Prognostic role of lymphatic vessel density and lymphovascular invasion in chemotherapy-naive and chemotherapy-treated patients with invasive breast cancer. American journal of translational research. 2017;9(3):1435-1447.
3. Khwaja SS, Ivanovich J, DeWees TA, et al. Lymphovascular space invasion and lack of downstaging after neoadjuvant chemotherapy are strong predictors of adverse outcome in young women with locally advanced breast cancer. Cancer medicine. 2016;5(2):230-238.
4. Ahn KJ, Park J, Choi Y. Lymphovascular invasion as a negative prognostic factor for triple-negative breast cancer after surgery. Radiation oncology journal. 2017;35(4):332-339.
5. Cheon H, Kim HJ, Kim TH, et al. Invasive Breast Cancer: Prognostic Value of Peritumoral Edema Identified at Preoperative MR Imaging. Radiology. 2018;287(1):68-75.
6. Uematsu T, Kasami M, Watanabe J, et al. Is lymphovascular invasion degree one of the important factors to predict neoadjuvant chemotherapy efficacy in breast cancer? Breast Cancer. 2011;18(4):309-313.
7. Torabi R, Hsu CH, Patel PN, Dave H, Bouton ME, Komenaka IK. Predictors of margin status after breast-conserving operations in an underscreened population. Langenbecks Arch Surg. 2013;398(3):455-462.
8. Matsuda N, Hayashi N, Ohde S, et al. A nomogram for predicting locoregional recurrence in primary breast cancer patients who received brea st-conserving surgery after neoadjuvant chemotherapy. J Surg Oncol. 2014;109(8):764-769.
9. Weiser MR, Montgomery LL, Tan LK, et al. Lymphovascular invasion enhances the prediction of non-sentinel node metastases in breast cancer patients with positive sentinel nodes. Ann Surg Oncol. 2001;8(2):145-149.
10. Ryu JM, Lee SK, Kim JY, et al. Predictive Factors for Nonsentinel Lymph Node Metastasis in Patients With Positive Sentinel Lymph Nod es After Neoadjuvant Chemotherapy: Nomogram for Predicting Nonsentinel Lymph Node Metastasis. Clin Breast Cancer. 2017;17(7):550-558.
11. Uematsu T, Kasami M, Watanabe J. Is evaluation of the presence of prepectoral edema on T2-weighted with fat-suppression 3 T breast MRI a simple and readily available noninvasive technique for estimation of prognosis in patients with b reast cancer? Breast Cancer. 2014;21(6):684-692.
12. Cheon H, Kim HJ, Lee SM, et al. Preoperative MRI features associated with lymphovascular invasion in node-negative invasive breast cancer: A propensity-matched analysis. J Magn Reson Imaging. 2017;46(4):1037-1044.
13. Uematsu T. Focal breast edema associated with malignancy on T2-weighted images of breast MRI: peritumoral edema, prepectoral edema, and subcutaneous edema. Breast Cancer. 2015;22(1):66-70.
14. Mori N, Mugikura S, Takasawa C, et al. Peritumoral apparent diffusion coefficients for prediction of lymphovascular invasion in clinically node-negative invasive breast cancer. Eur Radiol. 2016;26(2):331-339.
15. Igarashi T, Furube H, Ashida H, Ojiri H. Breast MRI for prediction of lymphovascular invasion in breast cancer patients with clinically negati ve axillary lymph nodes. Eur J Radiol. 2018;107:111-118.
16. Antropova N, Huynh BQ, Giger ML. A deep feature fusion methodology for breast cancer diagnosis demonstrated on three imaging modality datasets. Medical physics. 2017;44(10):5162-5171.
17. Li H, Zhu Y, Burnside ES, et al. Quantitative MRI radiomics in the prediction of molecular classifications of breast cancer subtypes i n the TCGA/TCIA data set. NPJ Breast Cancer. 2016;2.
18. Ma W, Ji Y, Qi L, Guo X, Jian X, Liu P. Breast cancer Ki67 expression prediction by DCE-MRI radiomics features. Clin Radiol. 2018.
19. Li H, Zhu Y, Burnside ES, et al. MR Imaging Radiomics Signatures for Predicting the Risk of Breast Cancer Recurrence as Given by Resea rch Versions of MammaPrint, Oncotype DX, and PAM50 Gene Assays. Radiology. 2016;281(2):382-391.
20. Chan HM, van der Velden BHM, Loo CE, Gilhuijs KGA. Eigentumors for prediction of treatment failure in patients with early-stage breast cancer using dyna mic contrast-enhanced MRI: a feasibility study. Phys Med Biol. 2017;62(16):6467-6485.
21. Fan M, Wu G, Cheng H, Zhang J, Shao G, Li L. Radiomic analysis of DCE-MRI for prediction of response to neoadjuvant chemotherapy in breast cancer patients. Eur J Radiol. 2017;94:140-147.
22. Liu C, Ding J, Spuhler K, et al. Preoperative prediction of sentinel lymph node metastasis in breast cancer by radiomic signatures fro m dynamic contrast-enhanced MRI. J Magn Reson Imaging. 2018.
23. Valente SA, Levine GM, Silverstein MJ, et al. Accuracy of predicting axillary lymph node positivity by physical examination, mammography, ultrasono graphy, and magnetic resonance imaging. Ann Surg Oncol. 2012;19(6):1825-1830.
24. Mortellaro VE, Marshall J, Singer L, et al. Magnetic resonance imaging for axillary staging in patients with breast cancer. J Magn Reson Imaging. 2009;30(2):309-312.
25. Yoshimura G, Sakurai T, Oura S, et al. Evaluation of Axillary Lymph Node Status in Breast Cancer with MRI. Breast Cancer. 1999;6(3):249-258.
Figures