0590
Investigating the relation between amide signal and pH in breast cancer using CEST-MRI and 31P MRSI at 7T.1Radiology, University Medical Centre Utrecht, Utrecht, Netherlands, 2Oncology, Amsterdam Medical Centre, Amsterdam, Netherlands
Synopsis
In this study, we combine CEST-MRI and 31P-MRSI measurements, to better comprehend the underlying mechanisms of the measured changes in APT signal by relating it to the pHi. CEST-MRI and 31P-MRSI were acquired in breast cancer patients receiving neoadjuvant chemotherapy (NAC) treatment before and after the first cycle of NAC at 7T. We found a linear correlation between APT-CEST and pH and a linear correlation between PE/Pi and the pH in the tumor of breast cancer patients before the start of NAC treatment. We hypothesized that an increased pH results in an increased APT signal, yet we found the opposite. As APT mainly depends on mobile amide proton concentration and the exchange rate, this data suggest that the main contributor to the APT signal is the concentration of mobile amide protons.
Introduction
The contrast in CEST-MRI depends on the amount of exchangeable protons in endogenous and exogenous compounds in the body and the exchange rate. According to Zhou et al.1, the measured APT signal is primarily related to the concentration of mobile amide protons, the amide proton exchange rate (influenced by tissue pH), and the T1 of water. It is hypothesized that an increased pH leads to an increased exchange rate, resulting in an increased APT signal 2. The pH of tissue can be measured by observation of the inorganic phosphate (Pi) signal from 31P-MRS as the resonant frequency of Pi is pH dependent3,4. In many tissues, the majority of the Pi resonance is intracellular (~85%) 5,6.In this study, we combine CEST-MRI and 31P-MRS measurements, to better comprehend the underlying mechanisms of the measured changes in APT signal by relating it to the pHi. CEST-MRI and 31P-MRSI were acquired in breast cancer patients receiving neoadjuvant chemotherapy (NAC) treatment before and after the first cycle of NAC at 7T.Methods
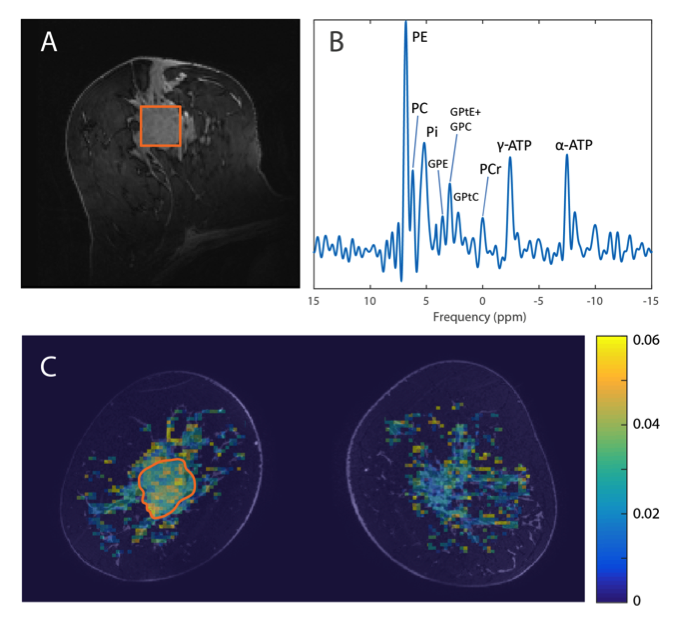
Twenty-two breast cancer patients undergoing NAC treatment gave informed consent to participate in this study. The patients were examined with MRI at 7T(Philips, Best, The Netherlands) before and after the first cycle of NAC (at ~3 week intervals). The CEST-MRI was acquired using a 26-channel bilateral breast 1H transceiver coil (MR Coils, Zaltbommel, The Netherlands) and the 31P-MRSI with a home-built 2-channel unilateral 1H/31P dual-tuned transceiver coil7. Third order image based B0 shimming was performed8. For CEST-MRI, 33 frequency offsets were acquired unevenly distributed over the frequencies from -1 ppm to 33 ppm relative to the water resonance; more offsets were obtained around the amide peak (3.5 ppm) and the water peak (0.0 ppm) for better fitting of these resonances. The frequency offsets associated with the nuclear Overhauser effect (NOE) were not included due to signal distortions by unsuppressed lipid resonances. A 4 s saturation train (20 sinc-Gauss RF pulses, pulse duration=100 ms, inter-pulse delay=100 ms, peak amplitude B1≈2 µT) was followed by a gradient-echo readout, and a short 1-2-1 spectral-spatial RF pulse was used for fat-suppression (TE=1.4 ms, TR=2.6 ms, flip angle=1.2°, FOV=150x320x100 mm3(FHxRLxAP), nominal resolution=2.3x3.0x6.8 mm3). A total of 2 shots with an interval of 4.48 s and a 4-fold acceleration in right-left direction resulted in a total scan time of 4 min 55 s. 31P-MRSI was obtained using the AMESING sequence9 (ΔTE=45 ms, TR=6 s, FOV=160x160x160 mm3, nominal resolution=2x2x2 cm3, BW=8200 Hz, sampling matrix size=256) where one FID and five full echoes were acquired in a total scan time of 25 min 36 s. CEST data was B0 corrected (WASSR method10) and APT maps were calculated using the three-pool Lorentzian model11 in Matlab (MathWorks, Natick, MA, USA). To determine the mean APT signal, a region of interest (ROI) was drawn in the tumor (3D volume) (Figure 1). From the 31P MRSI data one voxel encompassing the tumor was selected and fitted in JMRUI. The pH was determined using the frequency shift between α-ATP and Pi12,13(Figure 1). Values lower than first quartile - 1.5×interquartile range (IQR) or greater than third quartile + 1.5×IQR (outliers) in the data were removed before linear regression analysis was performed.Results
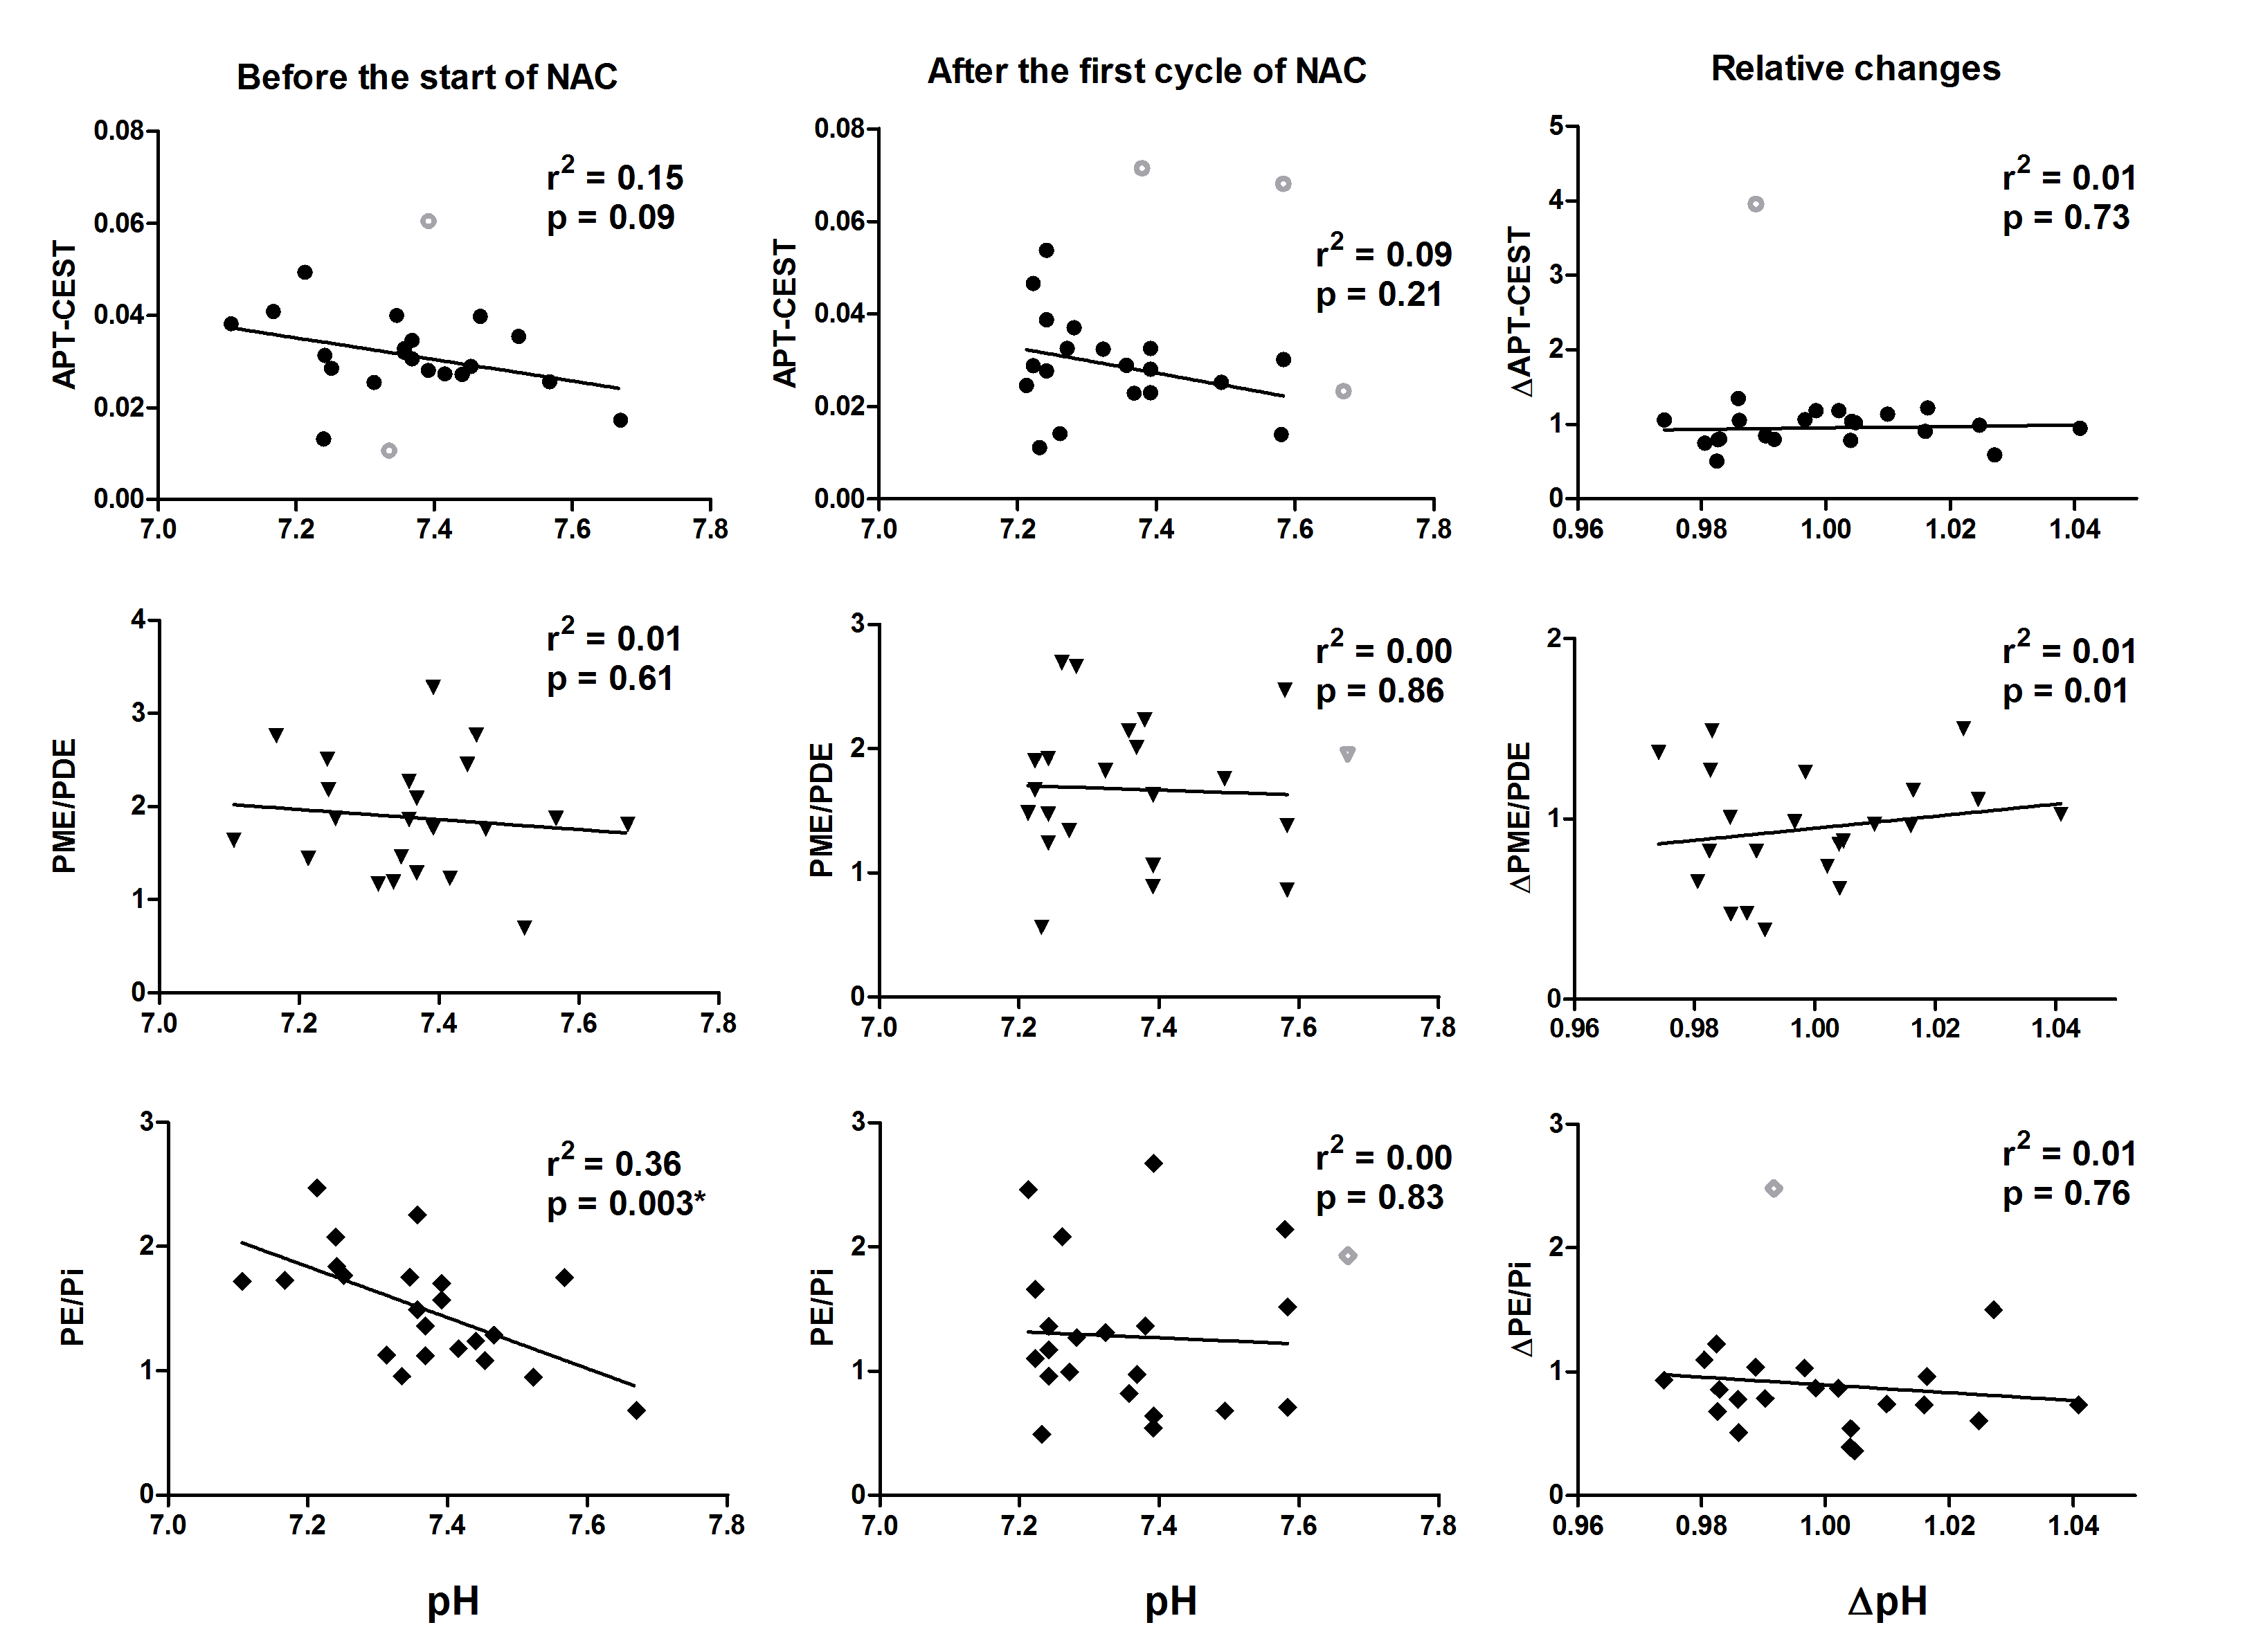
An absolute mean shift of 0.1 unit pH was observed with a maximum of 0.3 unit. When averaging over all patients, the pH stayed constant after NAC with a slightly alkaline pH of 7.4. Figure 2 shows the linear regression analysis of APT-CEST, PME/PDE, PE/Pi and pH before the start of NAC. The relation between APT-CEST signal and pH is opposite as expected; an increase of pHi showed a decrease in APT-CEST signal. The PE/Pi before the start of NAC showed a negative relation with the pH (r2=0.36). No significant correlations were found between the APT-CEST, PME/PDE and PE/Pi and pH after the first cycle of NAC (middle column, Figure 2); neither in the relative changes of these parameters after the first cycle of NAC (right column, Figure 2)Discussion and Conclusion
We found a linear correlation between APT-CEST and pH and a linear correlation between PE/Pi and the pH in the tumor of breast cancer patients before the start of NAC treatment. We hypothesized that an increased pH results in an increased APT signal, yet we found the opposite. As APT mainly depends on mobile amide proton concentration and the exchange rate, this data suggest that the main contributor to the APT signal is the concentration of mobile amide protons. In conclusion, in this study we have shown that APT-CEST and 31P-MRSI provide complementary information about the tumor in breast cancer patients.Acknowledgements
We would like to thank the Dutch Cancer Society (Alpe d’Huzes project nr: UU 2013-6302) and the NWO (VENI grant: 016.148.002) for financial support.References
- Zhou J, Payen JF, Wilson DA, Traystman RJ, Van Zijl PCM. Using the amide proton signals of intracellular proteins and peptides to detect pH effects in MRI. Nat. Med. 2003;9:1085–90.
- Sun PZ, Gregory Sorensen A. Imaging pH using the chemical exchange saturation transfer (CEST) MRI: Correction of concomitant RF irradiation effects to quantify cest MRI for chemical exchange rate and pH. Magn. Reson. Med. 2008;60:390–7.
- Moon RB, Richards JH. Determination of Intracellular pH by 31P Magnetic Resonance. J. Biol. Chem. 1973;248:7276–8.
- Griffiths J, Stevens A, Iles R, Gordon R, Shaw D. 31P-NMR investigation of solid tumours in the living rat. Biosci. Rep. 1981;1:319–25.
- Stubbs M, Bhujwalla ZM, Tozer GM, Rodrigues LM, Maxwell RJ, Morgan R, et al. An assessment of31P MRS as a method of measuring pH in rat tumours. NMR Biomed. 1992;5:351–9.
- Soto GE, Zhu Z, Evelhoch JL, Ackerman JJH. Tumor 31P NMR pH Measurements in Vivo: A Comparison of Inorganic Phosphate and Intracellular 2-Deoxyglucose-6-Phosphate as pHnmr Indicators in Murine Radiation-Induced Fibrosarcoma-1. Magn. Reson. Med. 1996;36:698–704.
- Klomp DWJ, van der Kemp WJM, Korteweg M, Wijnen JP, Bosch M Van De, Luijten PR. P MRS at 7T can be more sensitive and specific than 1 H MRS in monitoring breast cancer treatment . Proc. Intl. Soc. Mag. Reson. Med. 2011;19:343.
- Hancu I, Govenkar A, Lenkinski RE, Lee SK. On shimming approaches in 3T breast MRI. Magn. Reson. Med. 2013;69:862–7.
- van der Kemp WJM, Boer VO, Luijten PR, Stehouwer BL, Veldhuis WB, Klomp DWJ. Adiabatic multi-echo 31P spectroscopic imaging (AMESING) at 7 T for the measurement of transverse relaxation times and regaining of sensitivity in tissues with short T2* values. NMR Biomed. 2013;26:1299–307.
- Kim M, Gillen J, Landman BA, Zhou J, Van Zijl PCM. Water saturation shift referencing (WASSR) for chemical exchange saturation transfer (CEST) experiments. Magn. Reson. Med. 2009;61:1441–50.
- Windschuh J, Zaiss M, Meissner J, Paech D, Radbruch A, Ladd ME, et al. Correction of B 1-inhomogeneities for relaxation-compensated CEST imaging at 7T. NMR Biomed. 2015;28:529–37.
- Smith SR, Martin PA, Davies JM, Edwards RHT, Stevens AN. The assessment of treatment response in non-Hodgkin’s lymphoma by image guided 31P magnetic resonance spectroscopy. Br. J. Cancer. 1990;61:485–90.
- Lanza IR, Bhagra S, Nair KS, Port JD. Measurement of human skeletal muscle oxidative capacity by 31P-MR spectroscopy: A cross-validation with in vitro measurements. J. Magn. Reson. Imaging. 2011;34:1143–50.
Figures