0588
Assessment of Tumor Hypoxia response to sorafenib in Rabbit VX2 Liver Tumor xenografts by Tissue Oxygen Level Dependent MR imaging1Department of Radiology, Zhujiang Hospital, Southern Medical University, Guangzhou, China, 2MR Clinical Science, Philips Healthcare, Guangzhou, China
Synopsis
Developing non-invasive methods that assess drug resistance, which causes tumor hypoxia, is a research hotspot. We applied tissue oxygen level dependent (TOLD) MRI to investigate the changes in tumor oxygen inhalation of rabbit liver VX2 tumor xenografts before and sorafenib treatment.
Introduction
The only approved systemic therapy for advanced hepatocellular carcinoma (HCC) is sorafenib; which is a multikinase inhibitor with proved efficacy in advanced HCC in two major phase III studies (SHARP study in the Western population and AsianPacific study in the Asian population)1, 2. However, sorafenib treatment has heterogeneous individual responses, and drug resistance caused by sustained sorafenib treatment is very concerning. Anti-angiogenesis causes hypoxia in the tissue microenvironment, and the hypoxic tumor cells promotes antagonistic efficacy and drug resistance3, 4. In order to improve efficacy of advanced HCC, promptly adjust clinical treatment plan or individualized treatment of patients, it is essential to identify sorafenib resistance at the earliest. TOLD-MRI is an emerging technique for quantifying tumor oxygen delivery, which can detect changes in the level of molecular oxygen(O2) dissolved in plasma or interstitial tissue fluid5, 6. The aim of this study was to monitor the changes in tumor oxygen inhalation of rabbit liver VX2 tumor after a week of sustained sorafenib treatment.Material and Method
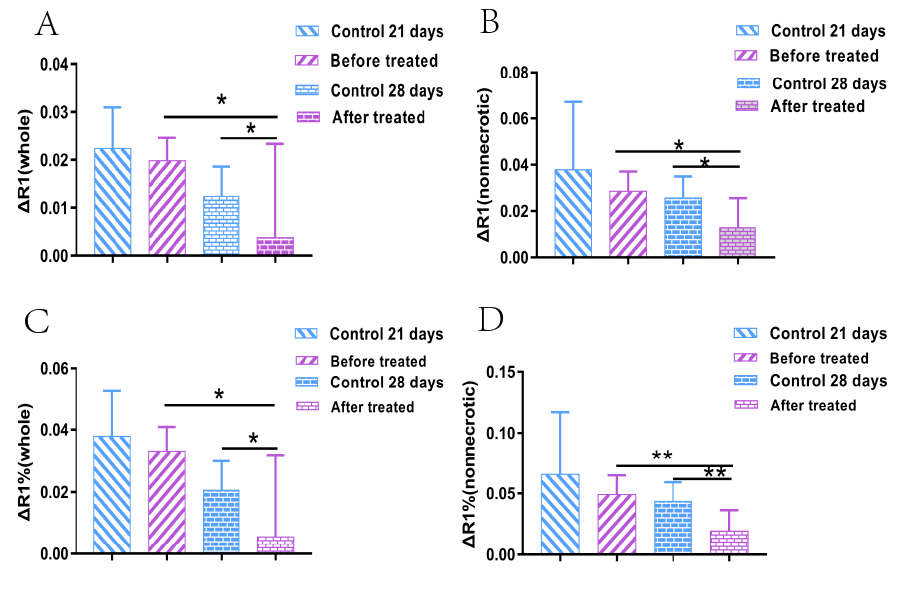
Twenty-six VX2 tumors were implanted in the livers of thirteen New Zealand white rabbits, which were incubated for control group(4 rabbits for 3 and 4 weeks) and treated group (5 rabbits). The treated group were given sorafenib (20mg/kg/d) for a week, three weeks after implantation. TOLD was performed before and after 30 min of oxygen inhalation, using an animal coil. The longitudinal relaxation rate (R1=1/T1; units s-1) was calculated. R1 difference (ΔR1=R1 (O2)-R1 (air)) of VX2 liver tumor was measured for whole lesion (ΔR1whole) and non-necrotic area (ΔR1nonnecrotic), and the corresponding relative change ΔR1%whole and ΔR1%nonnecrotic were calculated. Immunohistochemical analysis of hypoxia-inducible factor-1α(HIF-1α) expression of positive cell of rabbit VX2 liver tumor was performed on a high-powered microscope(grade for H0-H4).Result
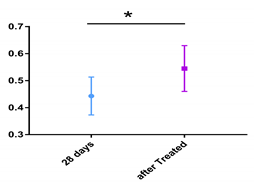
No significant differences were found between control group and treated group at week 3 in ΔR1whole, ΔR1nonnecrotic, ΔR1%whole and ΔR1%nonnecrotic (p>0.05). Significant differences were found in ΔR1whole, ΔR1nonnecrotic , ΔR1%whole and ΔR1%nonnecrotic between treated group and control group at week 4 (p< 0.01)(Figure 1). Significant differences were also detected in the treated group before and after sorafenib treatment. There was no significant difference in the pathological grade of HIF-1α between the treated group and the control group after a week of sorafenib(p>0.05), but the HIF-1α positive cell expression rate of the treated group was significantly higher than the control group (at 28 days). The difference was statistically different(p<0.05)(Figure 2).Discussion
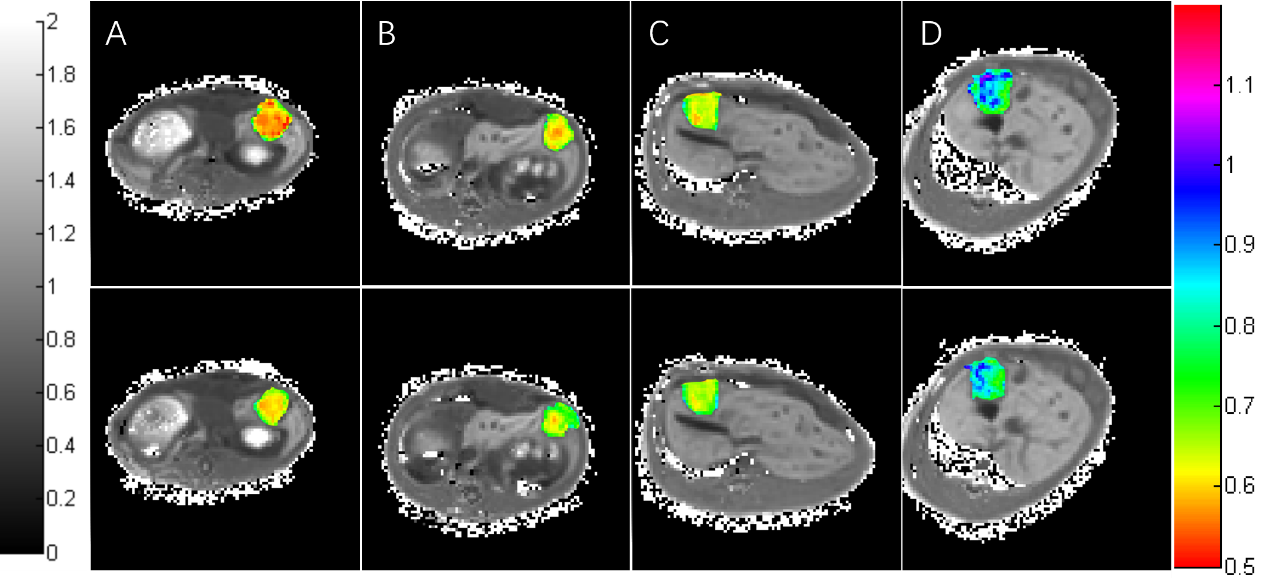
In this study, the R1 value was significantly decreased after one week of sorafenib treatment, and ΔR1 was negative, indicating an increase in hypoxia in the tumor(Figure 3). The ΔR1 value of the treated group was significantly lower than that of the control group. After a week of continuous sorafenib treatment, the amount of hypoxia in the tumor increased compared with the control group Sorafenib treatment in human HCC patients and mouse models reported in the literature are consistent with the results of intratumoral hypoxia. Sorafenib, an anti-angiogenic drugs, can cause tumor blood vessel contraction and reduce blood flow, resulting in a lack of oxygen to the tumor. Sustained sorafenib treatment resulted in decreased microvessel density, increased HIF-1α hypoxic positive cells and promoted intratumoral hypoxia. R1 is very sensitive to changes in the oxygen content dissolved in plasma or tissue fluids. TOLD can dynamically monitor tumor tissue oxygenation of continuous sorafenib treatment.Conclusion
Sustained treatment with sorafenib accelerated tumor hypoxia and increased positive cell expression of HIF-1α. The ΔR1 of the treated group decreased obviously after a week of sorafenib treatment, as compared to control group. This trend was consistent with the increased expression of HIF-1α.The change of ΔR1 can be detected by TOLD. As a repeatable non-invasive examination technique, TOLD can monitor and evaluate the therapeutic effects of anti-tumor drugs. It has important potential application value in individualized treatment for adjusting treatment plans.Acknowledgements
NoReferences
[1] Bruix J, Raoul J L, Sherman M, et al. Efficacy and safety of sorafenib in patients with advanced hepatocellular carcinoma: subanalyses of a phase III trial[J]. J Hepatol,2012,57(4):821-829.
[2] Cheng A L, Kang Y K, Chen Z, et al. Efficacy and safety of sorafenib in patients in the Asia-Pacific region with advanced hepatocellular carcinoma: a phase III randomised, double-blind, placebo-controlled trial[J]. Lancet Oncol,2009,10(1):25-34.
[3] Paez-Ribes M, Allen E, Hudock J, et al. Antiangiogenic therapy elicits malignant progression of tumors to increased local invasion and distant metastasis[J]. Cancer Cell,2009,15(3):220-231.
[4] Abdel-Rahman O, Lamarca A. Development of sorafenib-related side effects in patients diagnosed with advanced hepatocellular carcinoma treated with sorafenib: a systematic-review and meta-analysis of the impact on survival[J]. Expert Rev Gastroenterol Hepatol,2017,11(1):75-83.
[5] O'Connor J P, Boult J K, Jamin Y, et al. Oxygen-Enhanced MRI Accurately Identifies, Quantifies, and Maps Tumor Hypoxia in Preclinical Cancer Models[J]. Cancer Res,2016,76(4):787-795.
[6] Beeman S C, Shui Y B, Perez-Torres C J, et al. O2 -sensitive MRI distinguishes brain tumor versus radiation necrosis in murine models[J]. Magn Reson Med,2016,75(6):2442-2447.
Figures