0587
Non-Contrast Multiparametric Mapping for Pancreatic Ductal Adenocarcinoma Cancer (PDAC) Tissue Characterization1Radiological Department, Beijing Chaoyang Hospital, Capital Medical University, Beijing, China, 2Biomedical Imaging Research Institute, Cedars-Sinai Medical Center, Los Angeles, CA, United States, 3Cedars-Sinai Medical Center, Los Angeles, CA, United States
Synopsis
Pancreatic ductal adenocarcinoma (PDAC) is one of the most-common malignant tumors and has poor outcomes. With increasing size, the mass causes obstruction of the main pancreatic duct which results in chronic pancreatitis of the upstream pancreas (towards the tail). However, the downstream pancreas (towards the head) does not have these changes. In this study, we quantitatively measured multiple MR parameters (T1, T2, and ADC) of PDAC, upstream, and downstream pancreas along with normal pancreas in healthy volunteers and found these values can be used to differentiate these tissue types. The combination of the three parameters improves overall accuracy in differentiating PDAC with upstream pancreas, downstream pancreas, and normal pancreas over single parameter.
Introduction
Pancreatic ductal adenocarcinoma (PDAC) is one of the most common malignant tumors1. The growing tumor causes obstruction of the main pancreatic duct resulting in chronic pancreatitis, fibrosis and atrophy of the distal end towards the tail2(upstream pancreas). However, the proximal aspect of the tumor towards the head (downstream pancreas) does not exhibit the same changes. Qualitative non-contrast MRI can be severely limited in early detection and differentiating the non-tumor area with normal healthy pancreas. Better understanding of tissue characteristics in the tumor and non-tumor area can help improve accuracy of detection of PDAC. The purpose of the study was to evaluate the ability of non-contrast multiparametric mapping (T1, T2, and ADC) in differentiating PDAC from upstream and downstream pancreas, and normal control healthy pancreas.Methods
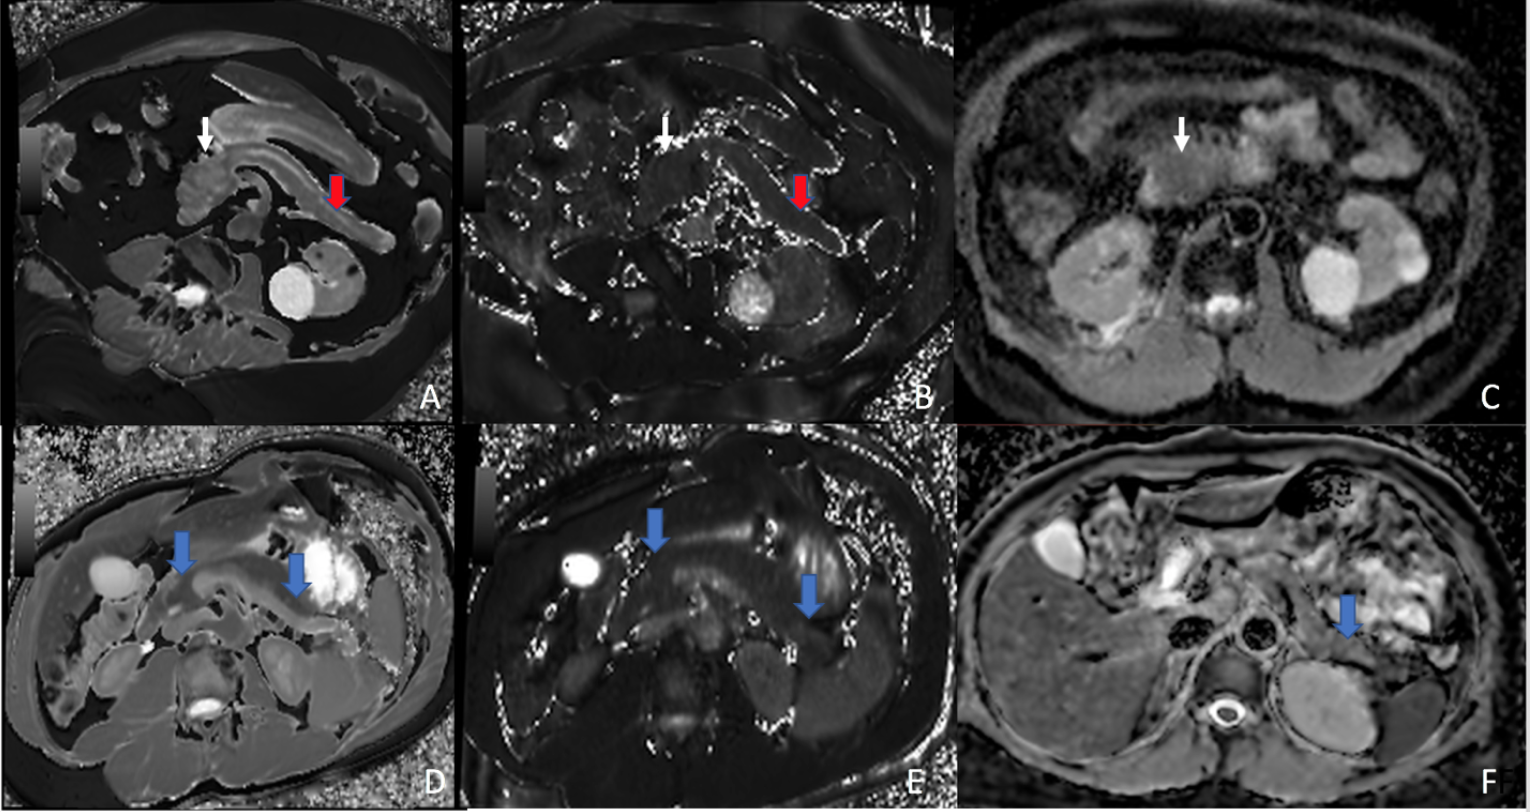
Ten patients (7 male, 3 females, mean age 65 yrs) with histo-pathologically-proven PDAC and 23 volunteers with normal healthy pancreas (13 male and 10 females, mean age 50 yrs) underwent 3.0T MR imaging (Magnetom mMR, Siemens, Germany). Diffusion-weighted images (DWI) were acquired using single-shot echo-planar imaging (SS-EPI) during free breathing (b-values of 50, 400, and 800 s/mm2). T1-mapping using a Modified Look-Locker Inversion Recovery (MOLLI) sequence with motion correction was acquired in the axial plane. T2-mapping was acquired using T2-prepared steady-state free precession (SSFP) in an axial plane. Clinical diagnosis using T1-VIBE MRI and histopathological reports were used as gold-standard criteria. Regions of interest (ROIs) were determined for the tumor, upstream, and downstream pancreas while avoiding the vessels, necrosis and the dilated pancreatic duct. This was performed by a radiologist with 20-year experience of abdominal MRI. T1, T2, and ADC values were obtained from the ROIs. For comparison of the quantitative parameters of different ROIs, one-way ANOVA and Tukey tests were used between groups and within groups, respectively. P-value of < 0.05 was considered to be significant. Receiver operator characteristic (ROC) curves and the areas under the curve (AUCs) were calculated for different ROIs using single parameters and combined parameters.Result
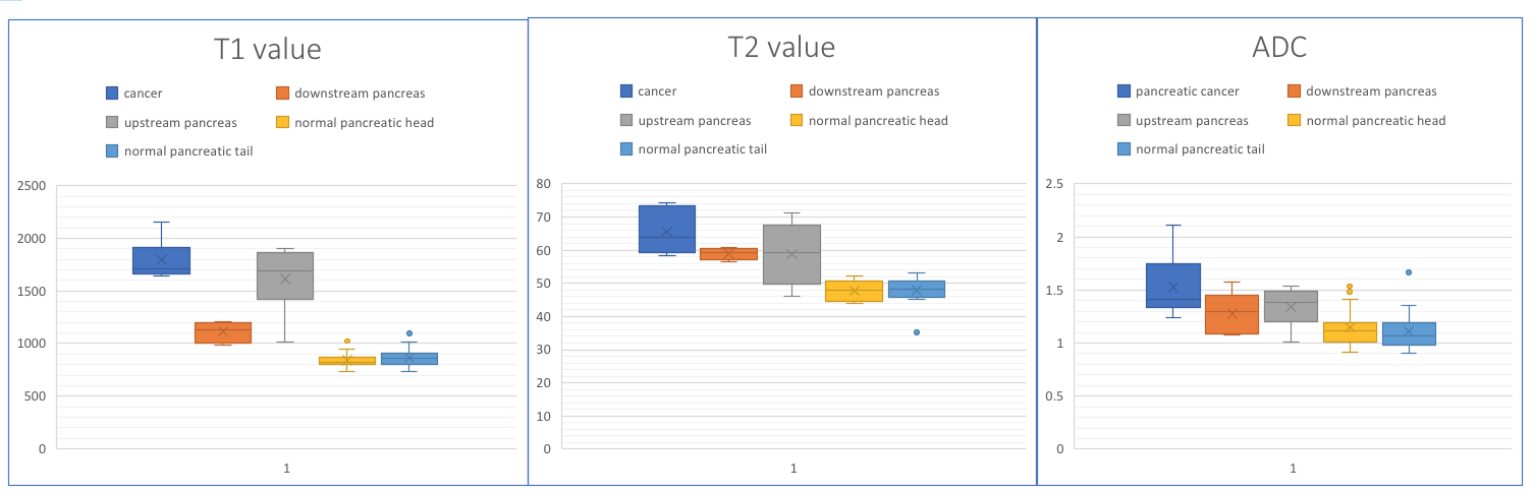
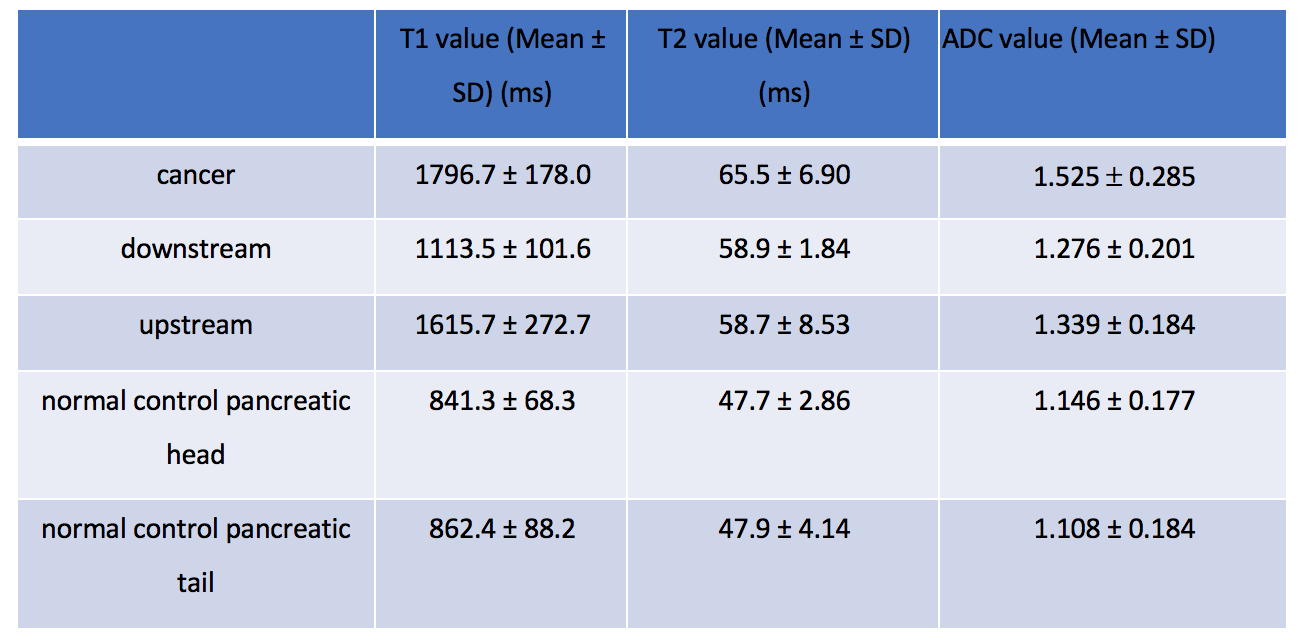
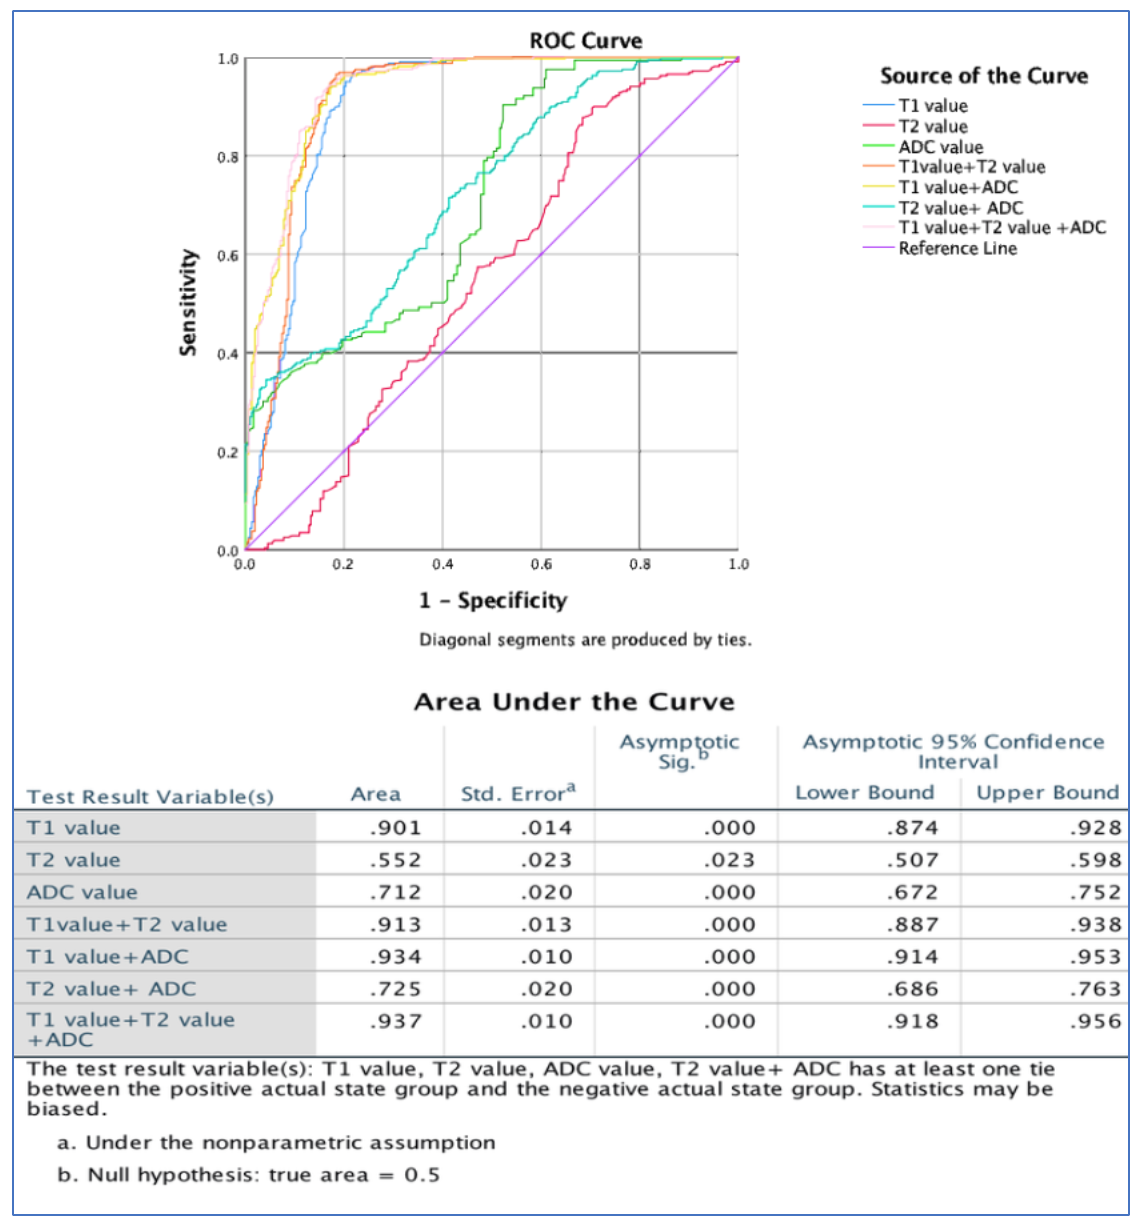
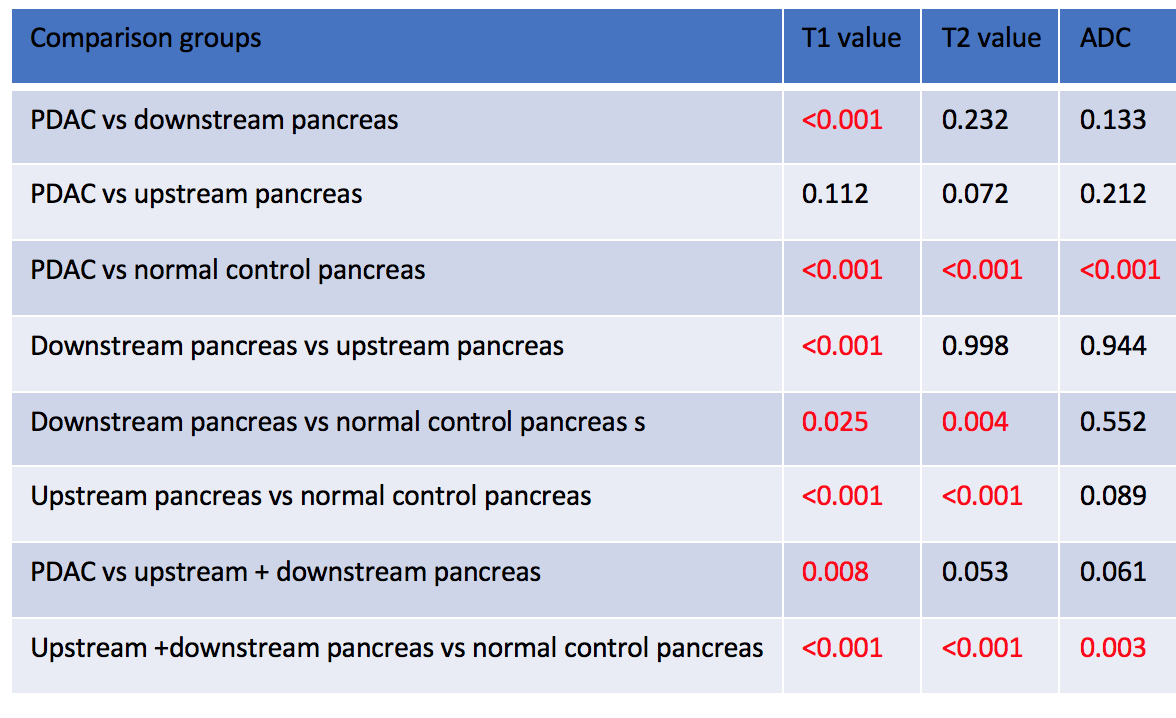
The T1, T2, and ADC values of PDAC, upstream, downstream, normal control pancreatic head and tail are listed in Table 1. The P values between the ROIs are shown in Table 2. The difference between PDAC versus normal control pancreas, non-tumor pancreas (upstream or downstream) versus normal control pancreas, upstream versus downstream pancreas all showed statistically significance (P<0.05). For multiparametric mapping the AUC was 0.94 (sensitivity 91.54%, specificity 85.81%, 95% CI:0.918-0.956) and was significantly better than any other single parameter (P<0.001)and higher than any combination of two parameters in differentiating PDAC with upstream and downstream pancreas.Discussion
PDAC arises from pancreatic ductal epithelium and identification of small tumor can be difficult in non-contrast MRI. The ADC value is well-established to differentiate PDAC from pancreatitis, and normal pancreas. T1 and T2 values play a greater role in tumors in the liver and response to therapy3,4. However, multiparameter mapping is rarely reported in PDAC patients5. We found that multiparametric mapping can not only differentiate tumor from non-tumor area, it can also differentiate upstream or downstream pancreas versus normal control pancreas. The histology of normal and diseased pancreas may explain the differences in these quantitative parameters between normal, upstream, and downstream pancreas and PDAC. The upstream pancreas has changes of long-term chronic pancreatitis, fibrosis and the pancreatic atrophy from main pancreatic duct obstruction or tumor induced fibroblastic hyperplasia and therefore has different multiparameter mapping.Conclusion
Non-contrast multiparametric mapping can be used in differentiating PDAC, upstream or downstream pancreas and normal control pancreas accurately. It provides the highest accuracy compared with single parameter. In the future multiparametric mapping potentially a useful tool for screening PDAC and may be an alternative to contrast-enhanced MRI in patients who cannot tolerate contrast media.Acknowledgements
References
1 Siegel RL, Miller KD, Jemal A. Cancer statistics, 2017. Ca Cancer J Clin. 2017; 67:7–30
2 Hecht EM, Liu MZ, Prince MR, Jambawalikar S, Remotti HE, et al. Can diffusion-weighted imaging serve as a biomarker of fibrosis in pancreatic adenocarcinoma?J Magn Reson Imaging. 2017 Aug;46(2):393-402
3 Cassinotto C, Feldis M, Vergniol J, et al. MR relaxometry in chronic liver diseases: Comparison of T1 mapping, T2 mapping, and diffusion-weighted imaging for assessing cirrhosis diagnosis and severity. European Journal of Radiology 2015, 84:1459–1465
4 WangWT, Zhu S, Ding Y, et al. T1 mapping on gadoxetic acid-enhanced MR imaging predicts recurrence of hepatocellular carcinoma after hepatectomy. European Journal of Radiology 2018,103: 25–31
5 Yin T, Peeters R, Feng Y, Liu Y, Yu J, et al. Characterization of a rat orthotopic pancreatic head tumor model using three-dimensional and quantitative multi-parametric MRI.NMR Biomed. 2017 Feb;30(2):1-10
Figures