0584
T1 mapping of neuroblastoma pathology: insight from a computational pathology study in the Th-MYCN transgenic mouse model
1Division of Radiotherapy and Imaging, The Institute of Cancer Research, London, Sutton, United Kingdom, 2Division of Molecular Pathology, The Institute of Cancer Research, London, Sutton, United Kingdom, 3Division of Clinical Studies, The Institute of Cancer Research, London, Sutton, United Kingdom
Synopsis
A reduction in T1 has been reported as a generic biomarker of successful treatment in the Th-MYCN model of neuroblastoma, a childhood tumor of the developing nervous system. The aim of this study was to decipher the pathological determinant(s) contributing to global and regional variations in native T1 by comparison with R2* maps and registered computed density maps of both segmented cells and classified cells, extracted from whole-slide digital pathology images in tumors arising in the Th-MYCN transgenic model of neuroblastoma.
Introduction / Purpose
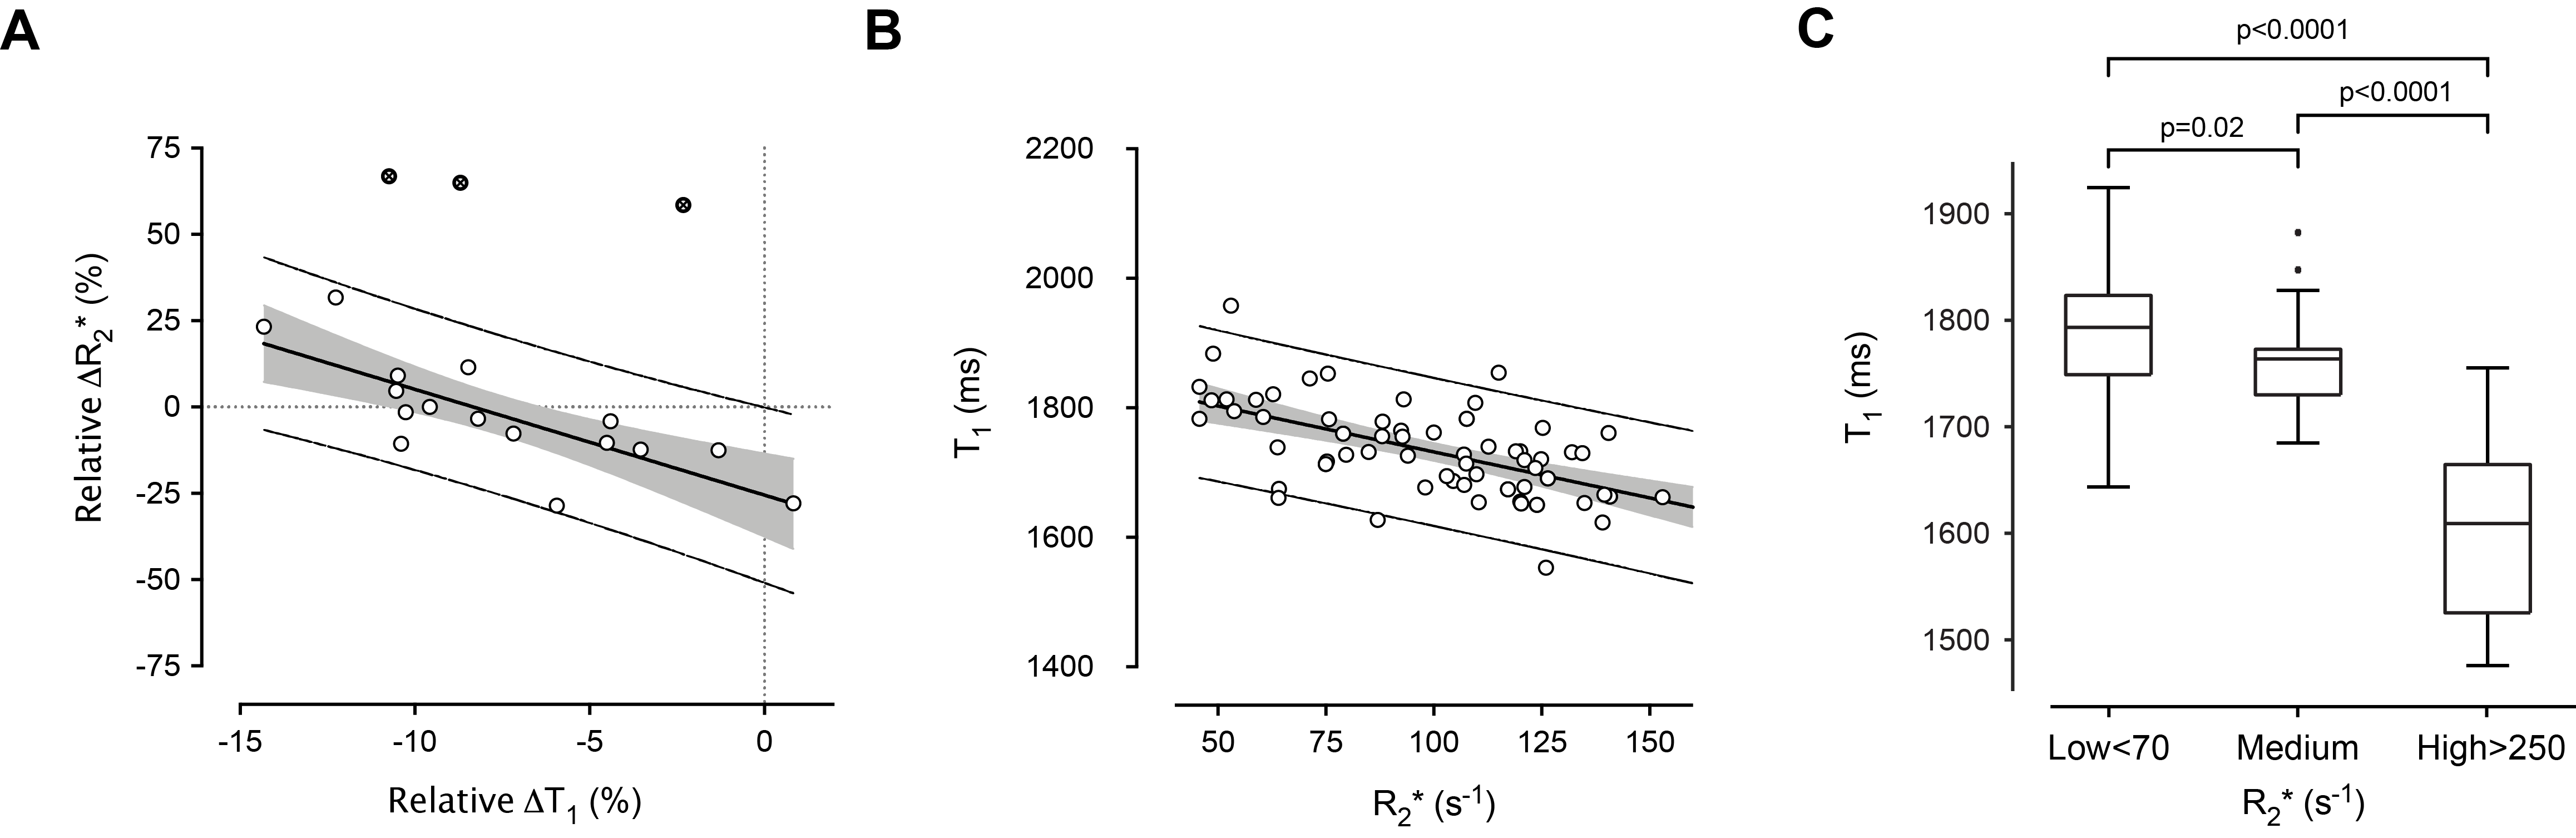
A decrease in tumor native T1 has been reported as a generic biomarker of successful treatment (chemotherapy, vascular-targeted and MYCN-targeted therapeutics) typically associated with increased cell death in the Th-MYCN model of neuroblastoma, a childhood tumor of the developing nervous system1. The Th-MYCN tumors are stroma-poor, hemorrhagic and hypervascular, undifferentiated or poorly-differentiated with a high mitosis-karyorrhexis index (MKI), mirroring the histology of childhood high-risk tumors2. In addition to being associated with cell death, successful therapy with MYCN-targeted therapeutics shows that the reduction in T1 also inversely correlated with change in R2* (Fig 1.A.), a biomarker of red blood cell (RBC) content3.
The aim of this study was to decipher the pathological determinant(s) contributing to global and regional variations in native T1 by comparison with R2* maps and registered computed density maps of segmented cells and classified neuroblasts, extracted from whole-slide digital pathology images in treatment-naïve Th-MYCN tumors.
Methods
T1 mapping and intrinsic-susceptibility (IS)-MRI were performed at 7T using an inversion recovery True-FISP and multi-gradient echo sequence respectively. T1 and R2* were calculated voxel-wise with a robust Bayesian approach1. We retrospectively compared the median T1 and R2* values in 71 treatment-naïve tumors before acquiring data from 13 mice for MRI-pathology comparison.
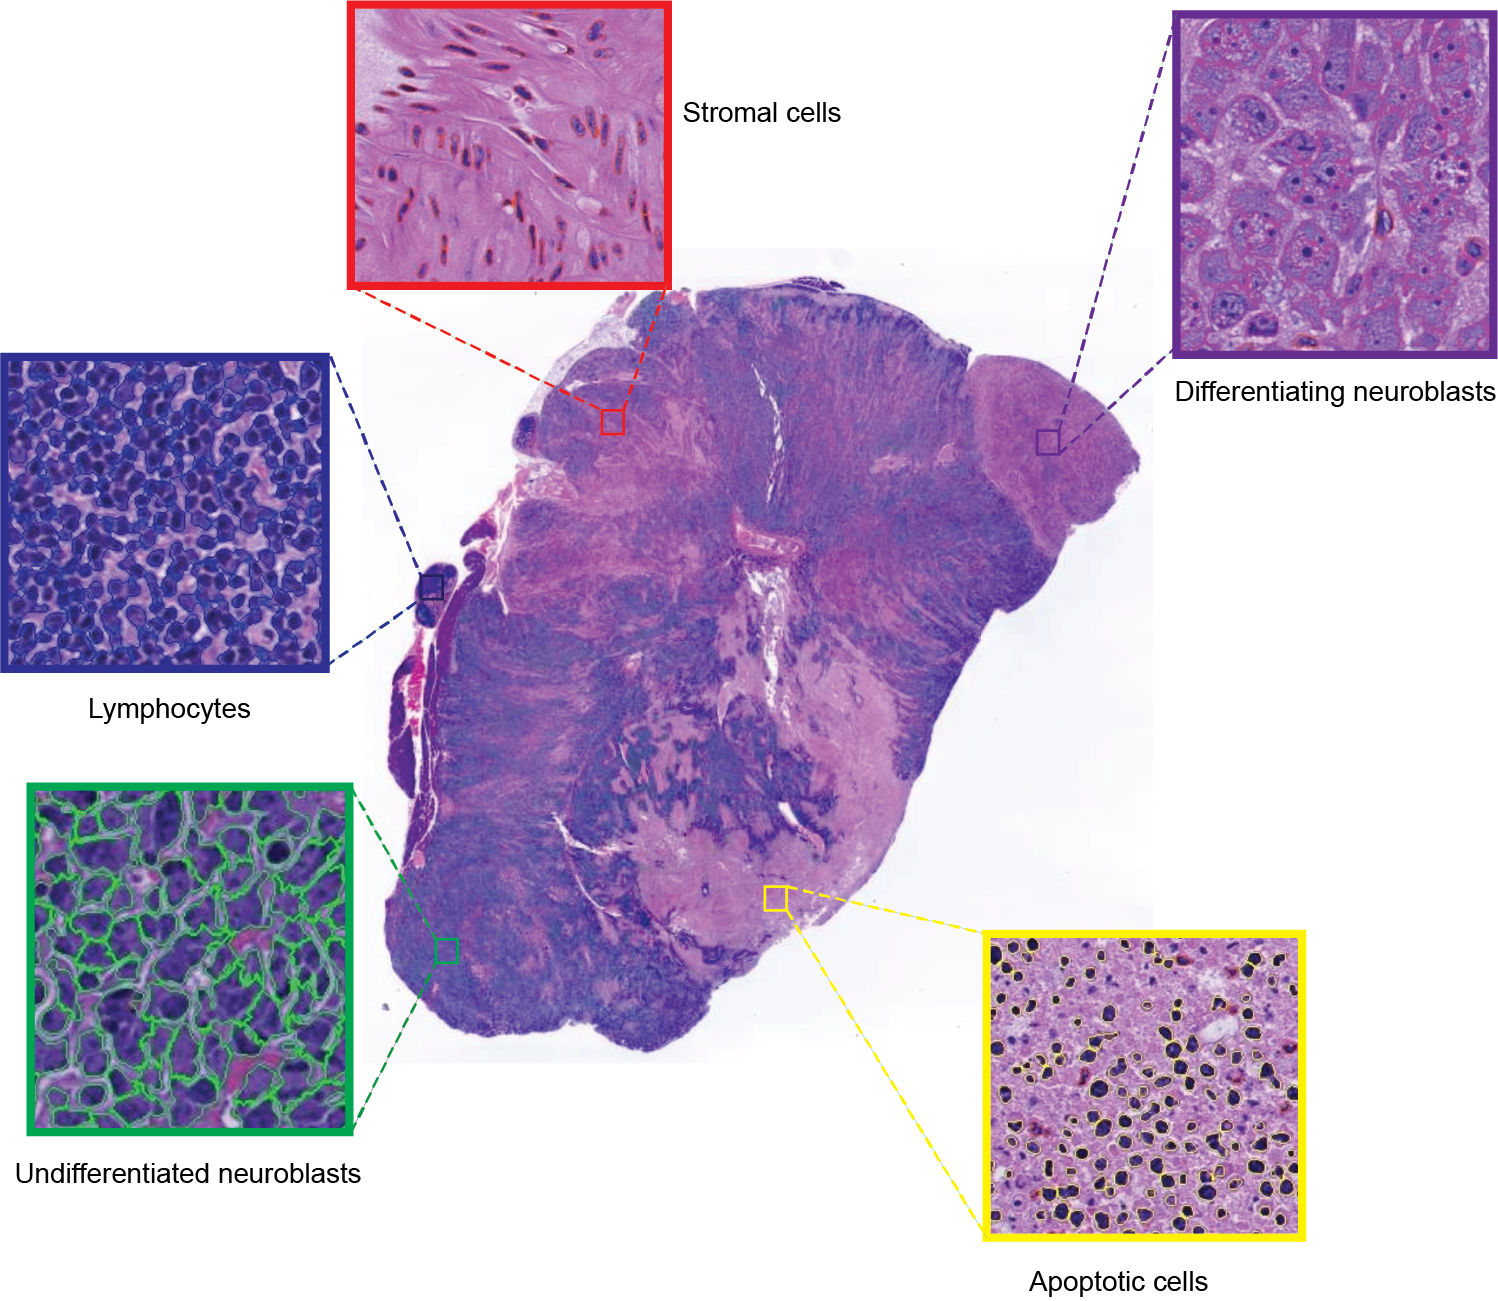
Cell segmentation and classification. Guided by T2w-MRI, tumors were carefully excised and orientated for histopathological processing. Formalin-fixed and paraffin-embedded tumors were sectioned (3μm). Hematoxylin and eosin (H&E)-stained whole-slide images were digitized (20x magnification, 0.46μm pixel resolution, Hamamatsu NanoZoomer-XR). Cells were automatically segmented and classified into 5 categories: undifferentiated neuroblasts, differentiating neuroblasts, apoptotic cells, lymphocytes, stromal cells (Fig.2).
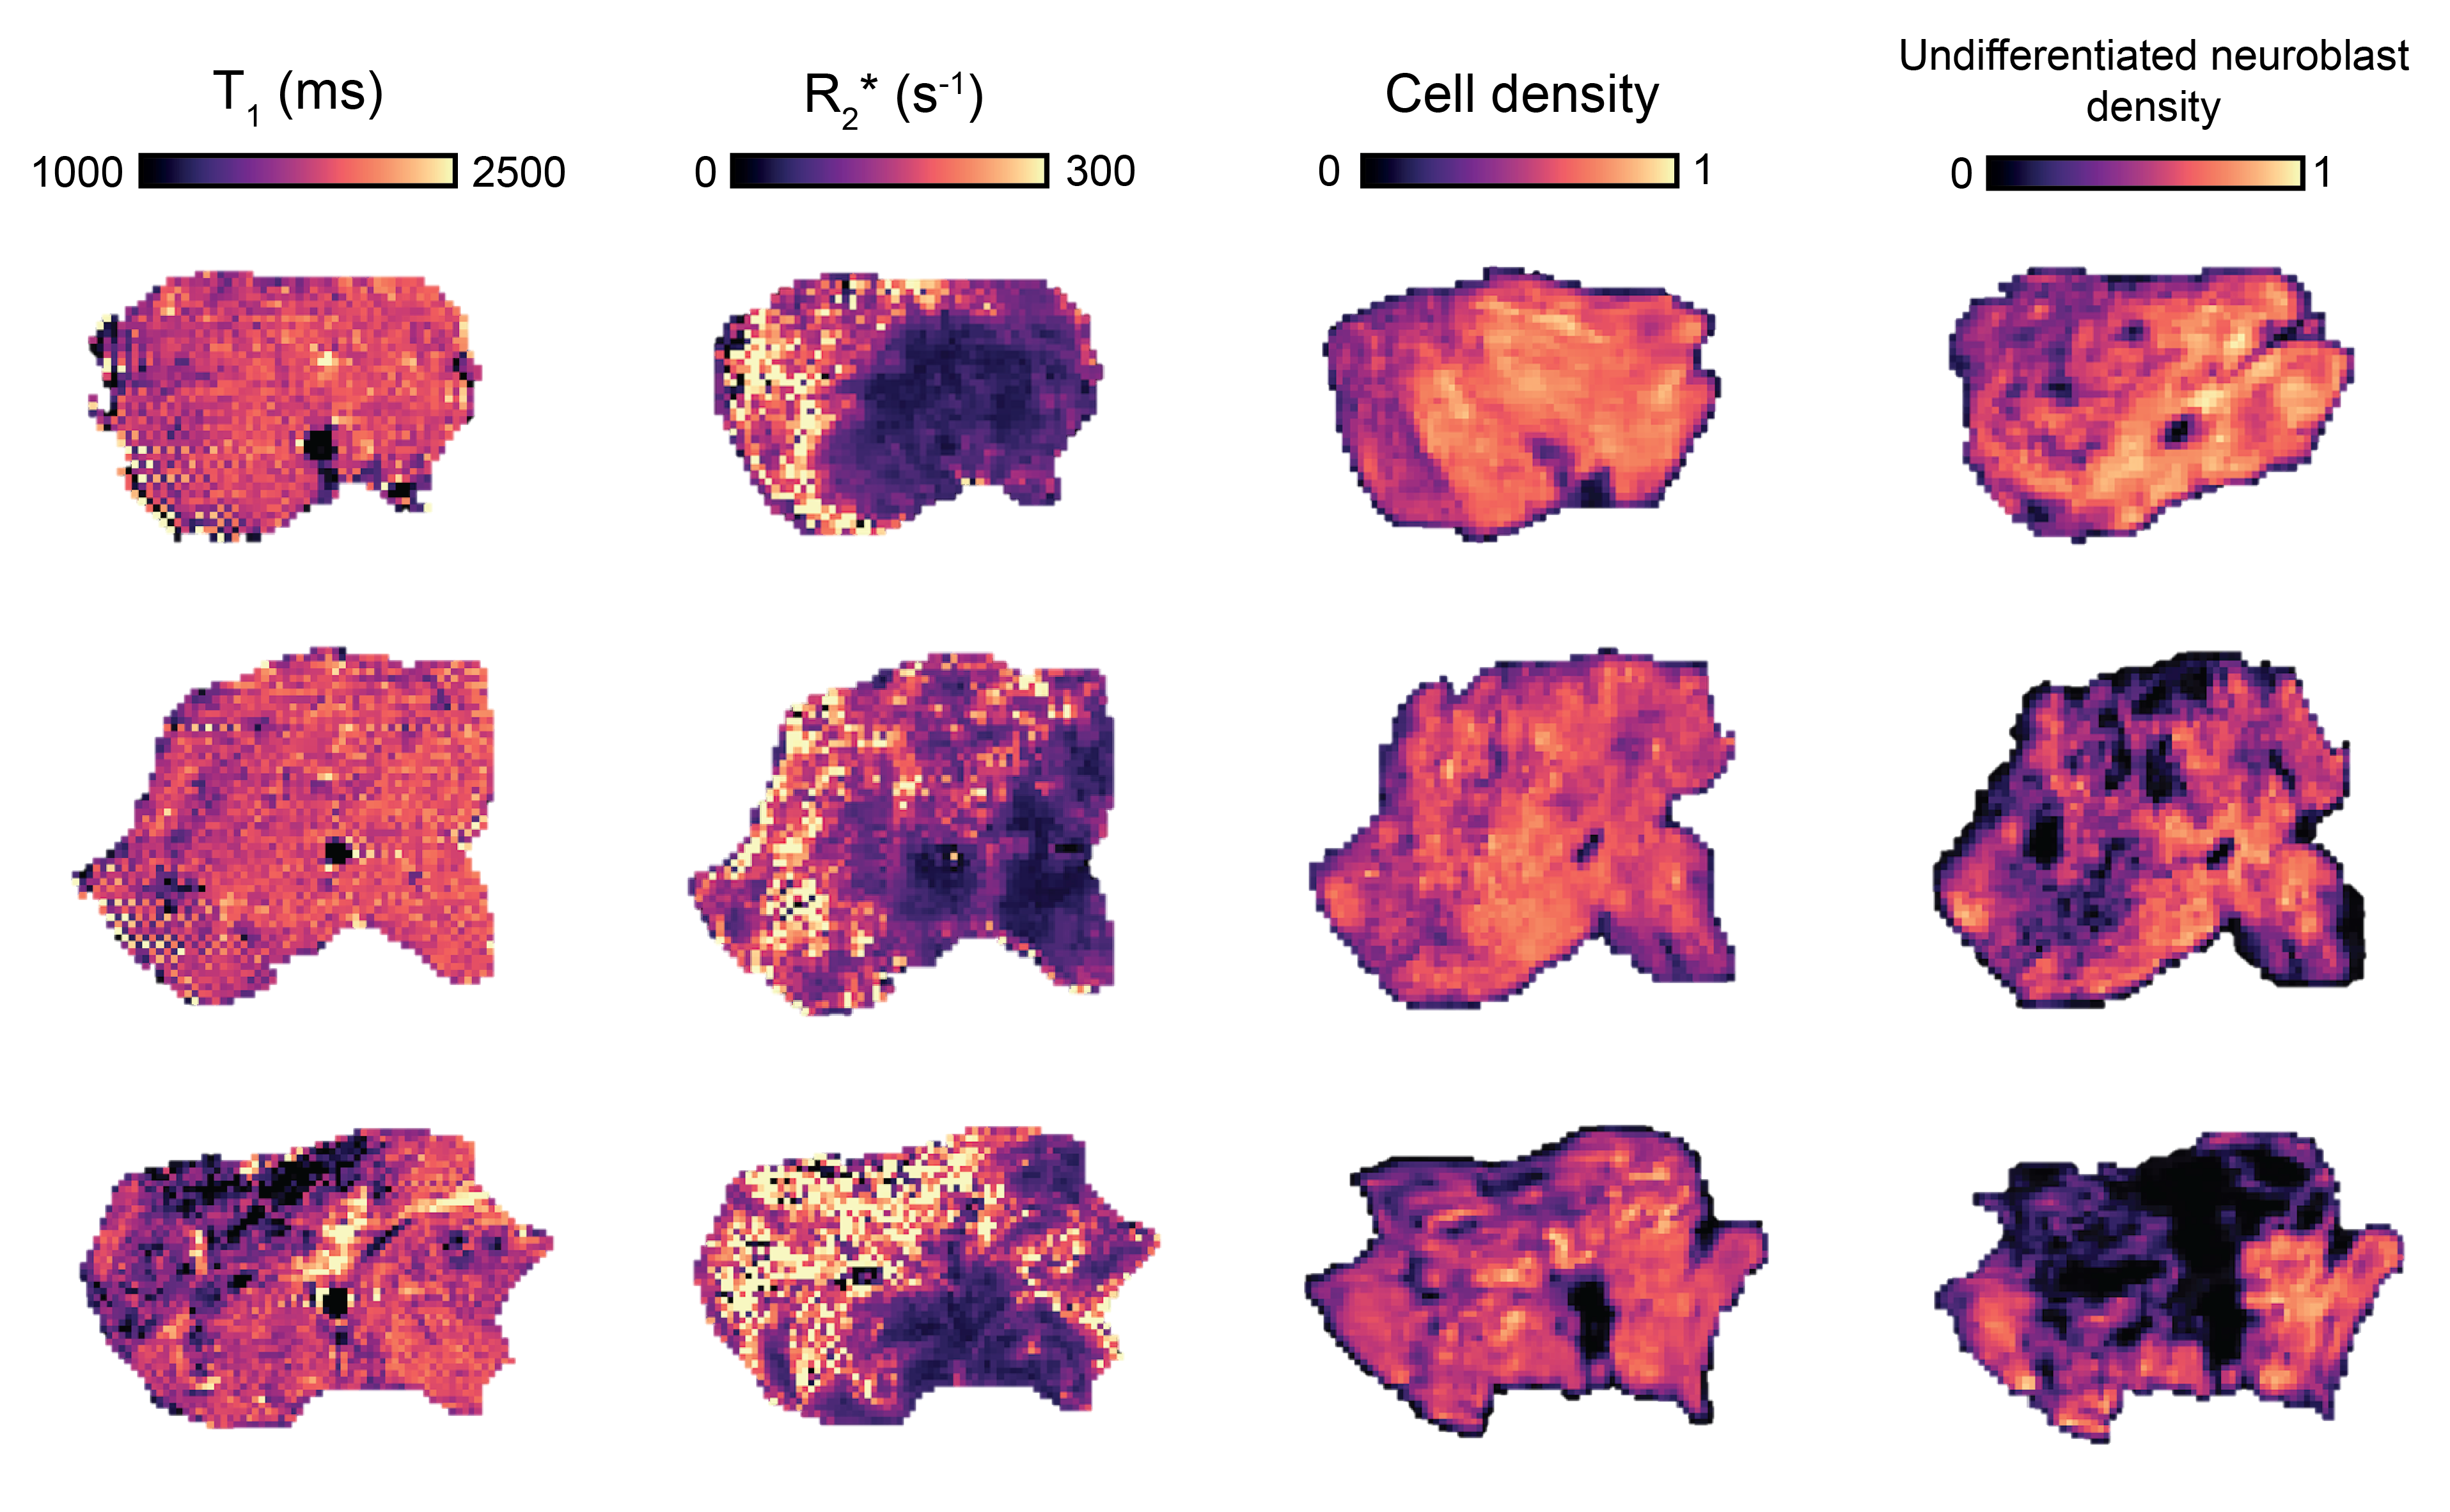
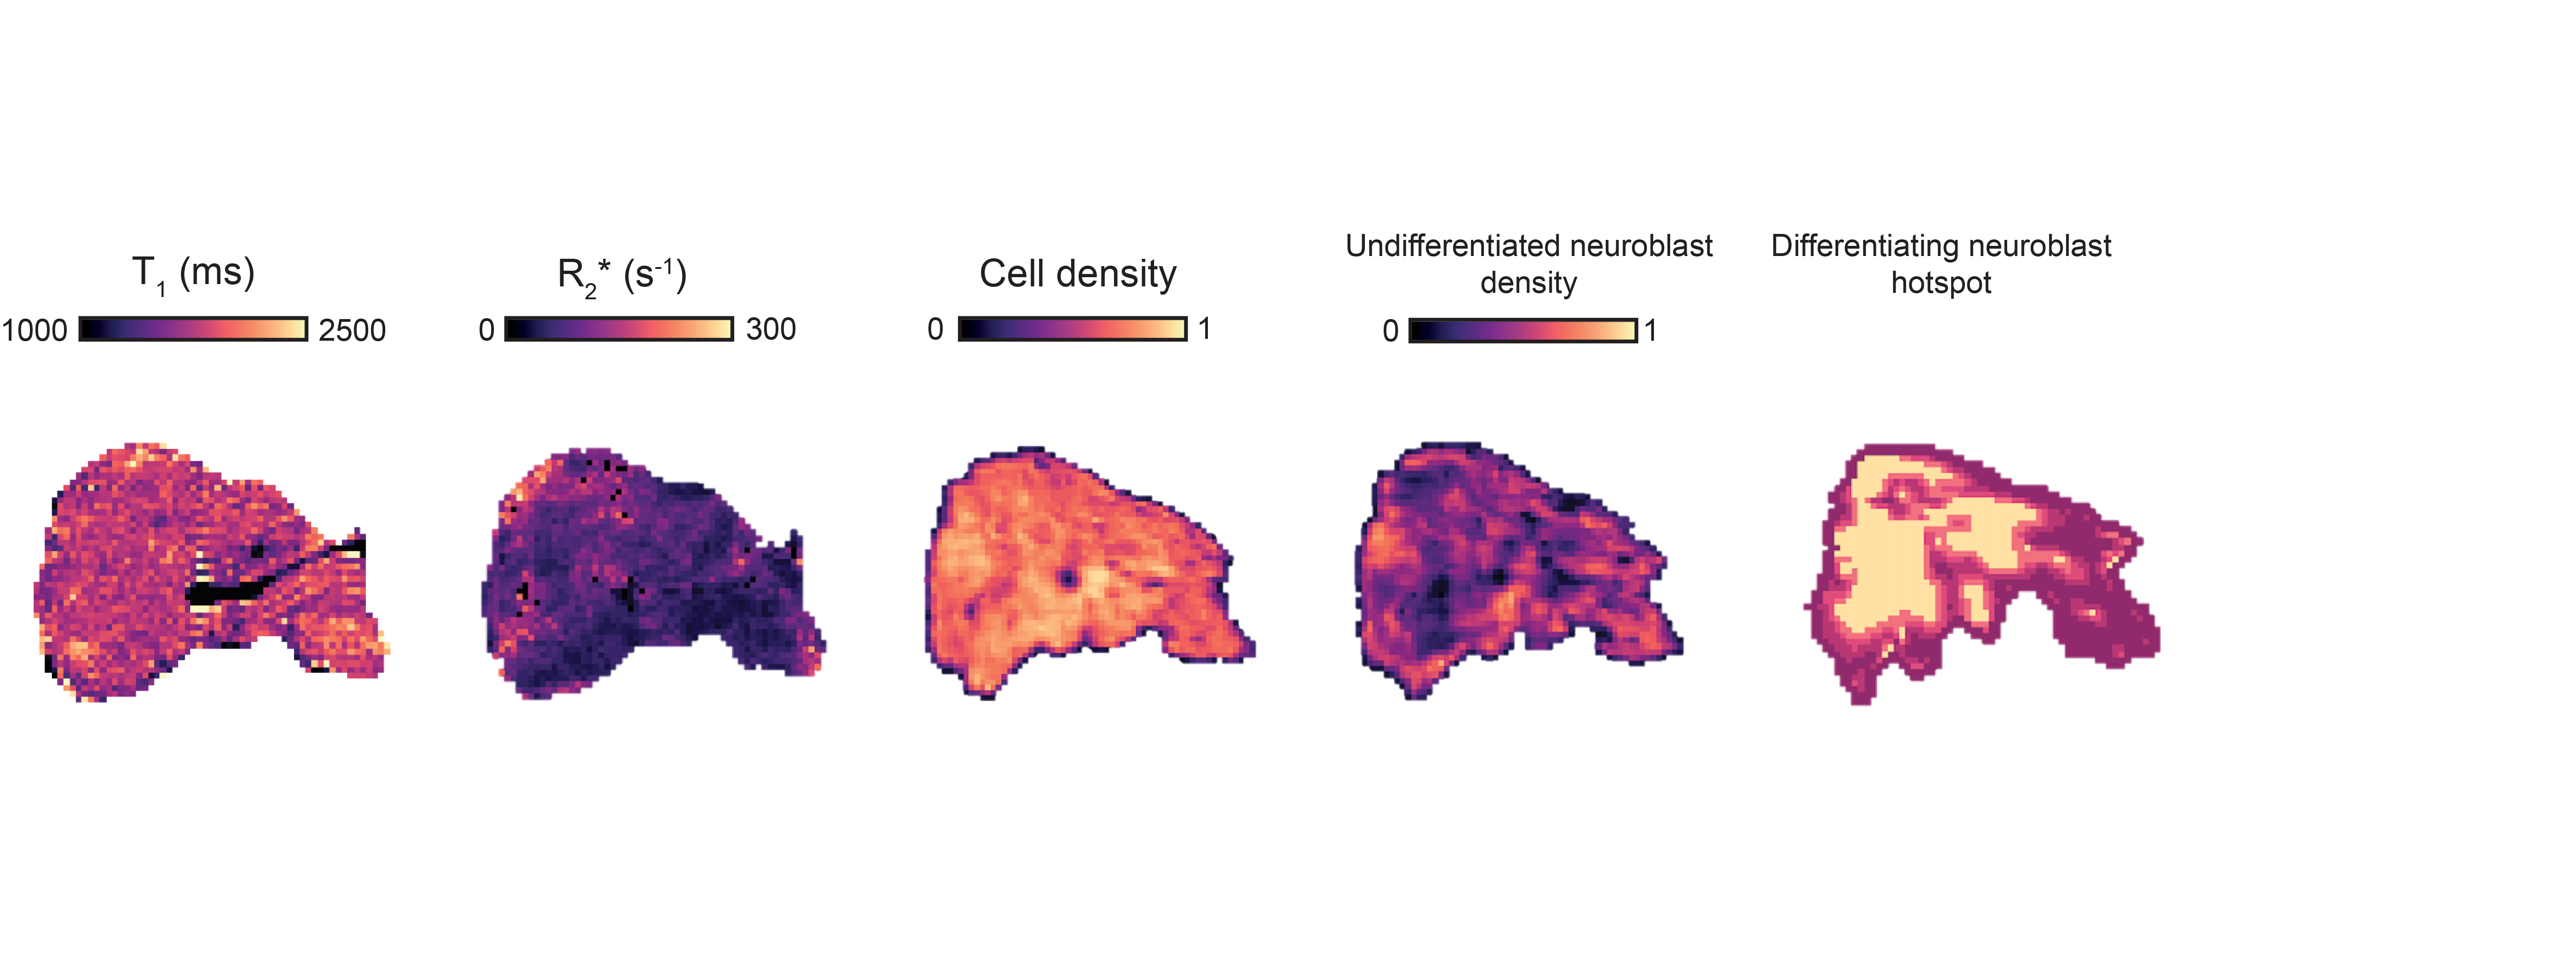
MRI-histology registration. Density maps of segmented cells and classified undifferentiated neuroblasts matching the MRI resolution were generated (Fig.3). Firstly, segmented cells density maps were automatically non-rigidly registered to the T1 images using the coherent point drift algorithm4 based on features extracted by a Canny edge detector. The edge features extracted from the cellular density maps, were used to register the classified undifferentiated neuroblasts density maps to the T1 maps. The Getis-Ord algorithm5 was applied to identify significant hotspots of classified undifferentiated and differentiating neuroblasts.
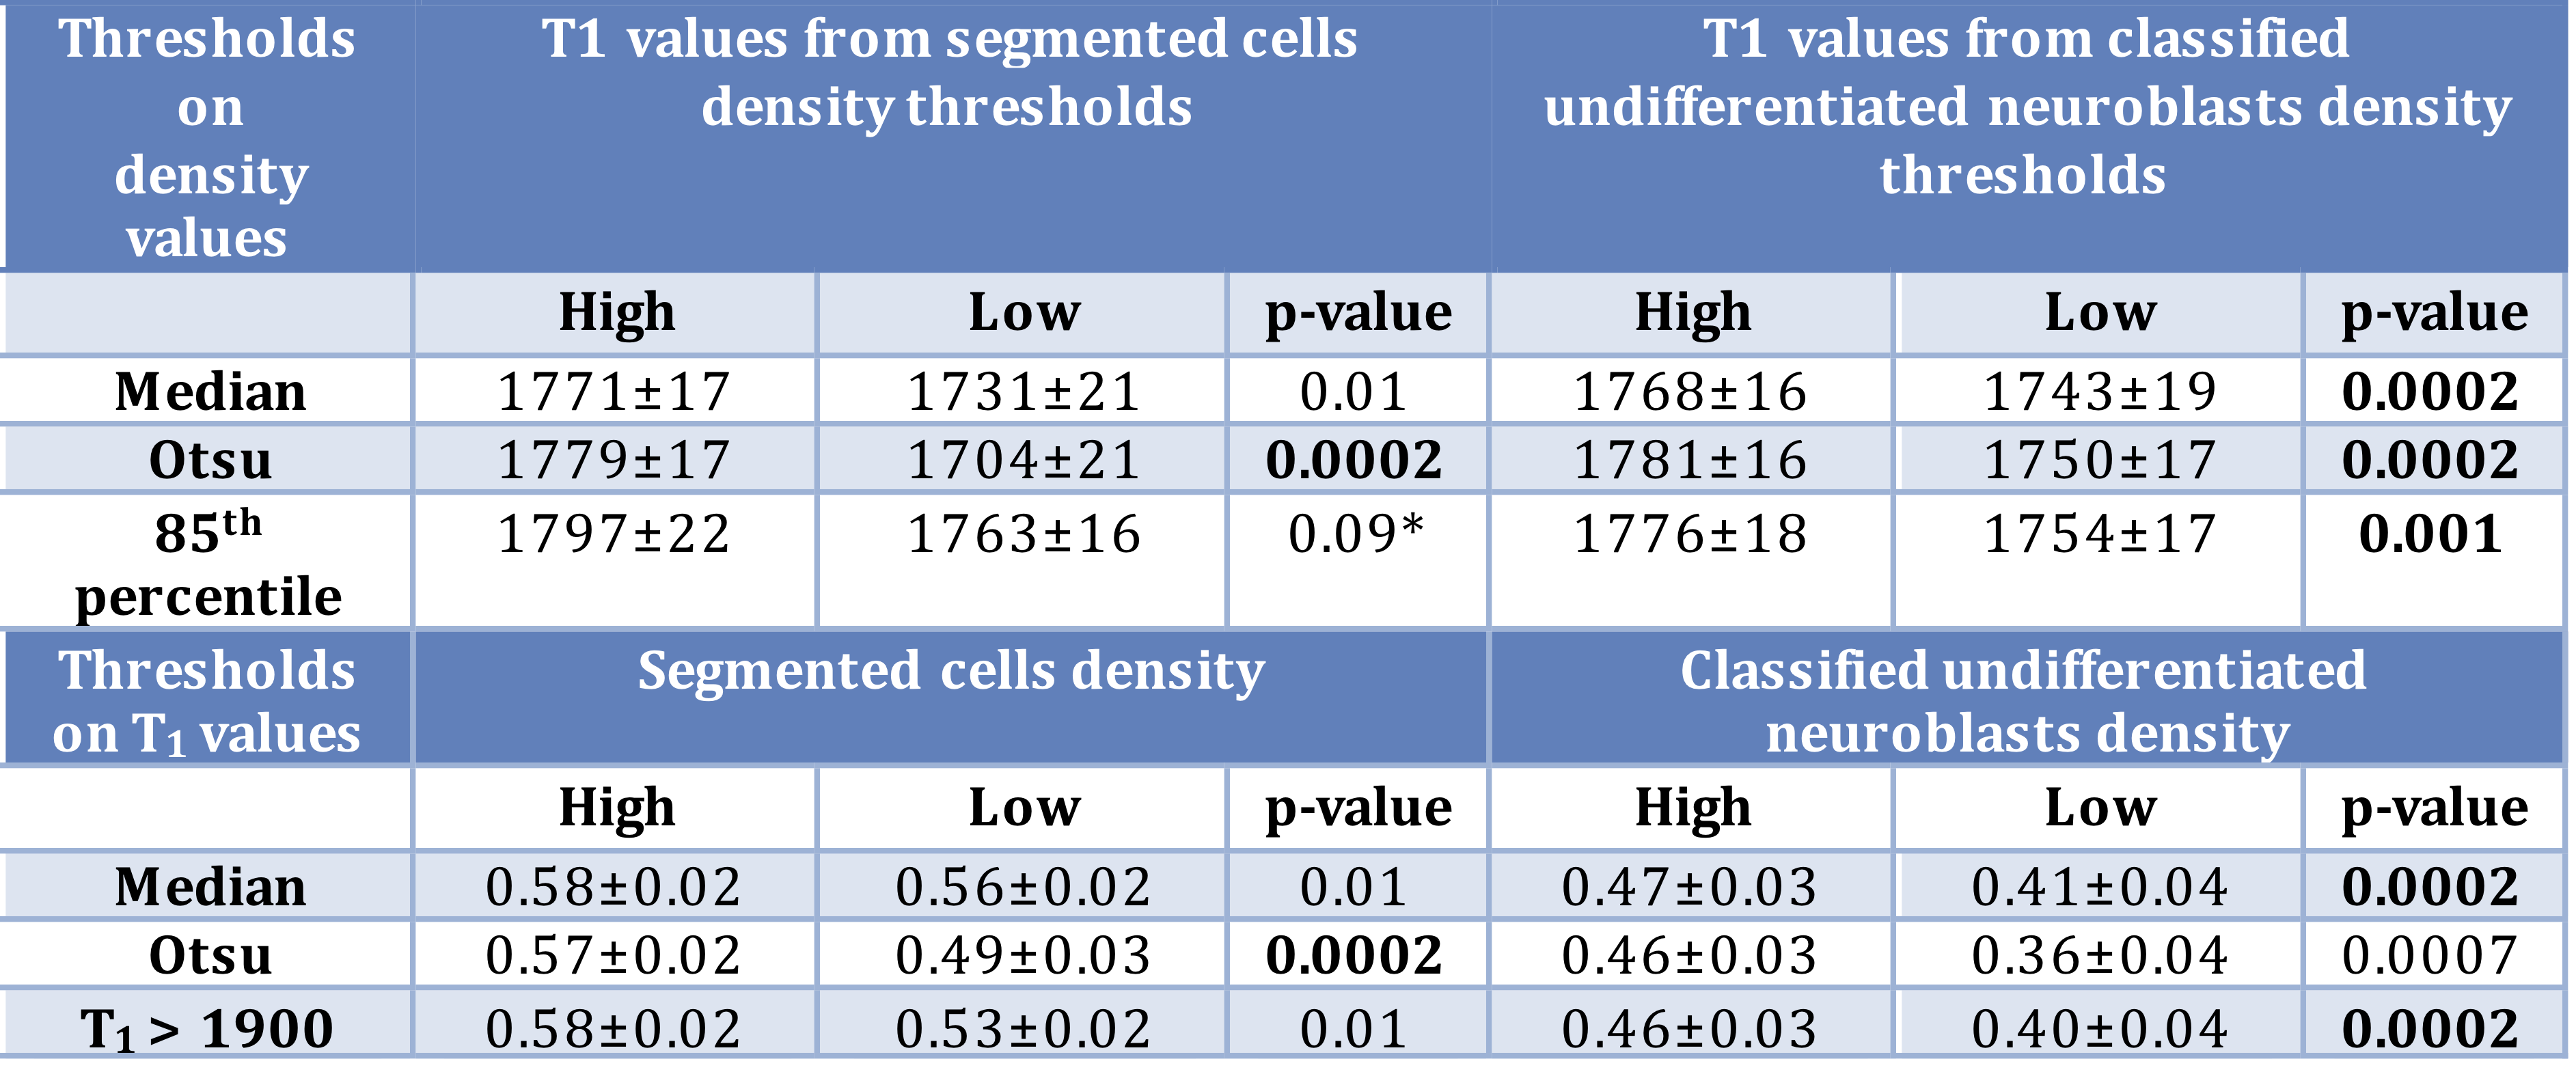
T1, R2* and histology-derived maps spatial quantitative comparison. First, various thresholds were used to divide the T1 maps into sub-regions of high and low values. Then we tested for any significant difference in values of R2* and histological parameters between these two sub-regions. Subsequently, we performed the same analysis using thresholds for R2* and histology-derived parameters.
Statistical Analysis. Any significant differences between groups were identified using the Wilcoxon signed rank test. All linear correlations were determined by Pearson’s correlation method and confirmed by using the robust regression and outlier removal approach. All levels of significance were 5%.
Results
Fig.1 shows a significant inverse relationship between median tumor T1 and R2*, i.e. extravasated RBC. MRI-pathology comparison confirmed that higher T1 values corresponded to areas of increased cellular density; an even stronger link was identified with areas of classified undifferentiated neuroblasts (Fig.3 and Fig.4). Hotspots of undifferentiated neuroblasts were also characterized by higher T1 (1758±16s-1 vs 1712±23s-1, median±1sem, p=0.0007). Interestingly, in one tumor showing low median T1 despite uniformly high cellularity (Fig.5), regional differences in T1 visually and spatially corresponded to differences in undifferentiated neuroblast density, with the large regions of low T1 and low undifferentiated neuroblasts, corresponding to hotspots of differentiating neuroblasts.Discussion
Native T1 mapping is sensitive to the high content of RBC, a consequence of the hypervascular and hemorrhagic phenotype of MYCN-driven neuroblastoma, consistent with the relationship of blood T1 with hematocrit6. While RBC aggregation decreases T1, subregions of high T1 were associated with high density of undifferentiated neuroblasts, typically presenting with high MKI, indicative of high level of proliferation. This suggests that high T1 is a biomarker of cellular proliferation in treatment-naïve tumors. Combined with the absence of significant changes in R2* over treatment, (with both positive and negative ΔR2*), this suggests that the decrease in T1 observed upon successful treatment is consistent with significant cell death, i.e. the disappearance of high T1 fraction, observed in these highly chemosensitive tumors. Comparing T1 mapping with immuno-histological Ki67 staining would confirm T1 as a marker of proliferation and early marker of therapy response.Conclusion
This study suggests that native T1 is a biomarker of neuroblast proliferation. The reduction in T1 observed upon successful therapy in the Th-MYCN transgenic model of neuroblastoma is consistent with cell death. This study supports further clinical evaluation of T1 mapping in clinical trials for neuroblastoma, and also suggests that combining T1 mapping with IS-MRI could provide important, complementary noninvasive pathological information to plan and guide surgical biopsies.Acknowledgements
Cancer Research UK and EPSRC to the Cancer Imaging Centre at ICR, in association with the MRC and Department of Health (England) (C1060/A10334 and C1060/A16464), NHS funding to the NIHR Biomedicine Research Centre and the Clinical Research Facility in Imaging, The Rosetrees Trust, and Children with Cancer UK Research Fellow.References
1. Jamin, Y., Tucker, E.R., Poon, E., et al. Evaluation of clinically translatable MR imaging biomarkers of therapeutic response in the TH-MYCN transgenic mouse model of neuroblastoma. Radiology 266, 130-140 (2013).
2. Moore, H.C., Wood, K.M., Jackson, M.S., et al. Histological profile of tumours from MYCN transgenic mice. Journal of clinical pathology (2008).
3. Zormpas-Petridis, K. et al., Proceedings of the International Society for Magnetic Resonance in Medicine, Annual Conference, Paris, 2018, #3926
4. Myronenko, A. & Song, X. Point set registration: Coherent point drift. IEEE transactions on pattern analysis and machine intelligence 32, 2262-2275 (2010).
5. Nawaz, S., Heindl, A., Koelble, K., et al. Beyond immune density: critical role of spatial heterogeneity in estrogen receptor-negative breast cancer. Modern Pathology 28, 766 (2015).
6. Lu, H., Clingman, C., Golay, X., et al. Determining the longitudinal relaxation time (T1) of blood at 3.0 Tesla. Magnetic Resonance in Medicine: An Official Journal of the International Society for Magnetic Resonance in Medicine 52, 679-682 (2004).
7. Pau, G., Fuchs, F., Sklyar, O., et al. EBImage—an R package for image processing with applications to cellular phenotypes. Bioinformatics 26, 979-981 (2010).
8. Otsu, N. A threshold selection method from gray-level histograms. IEEE transactions on systems, man, and cybernetics 9, 62-66 (1979).
9. Yuan, Y., Failmezger, H., Rueda, O.M., et al. Quantitative image analysis of cellular heterogeneity in breast tumors complements genomic profiling. Science translational medicine 4, 157ra143-157ra143 (2012).
Figures